


-
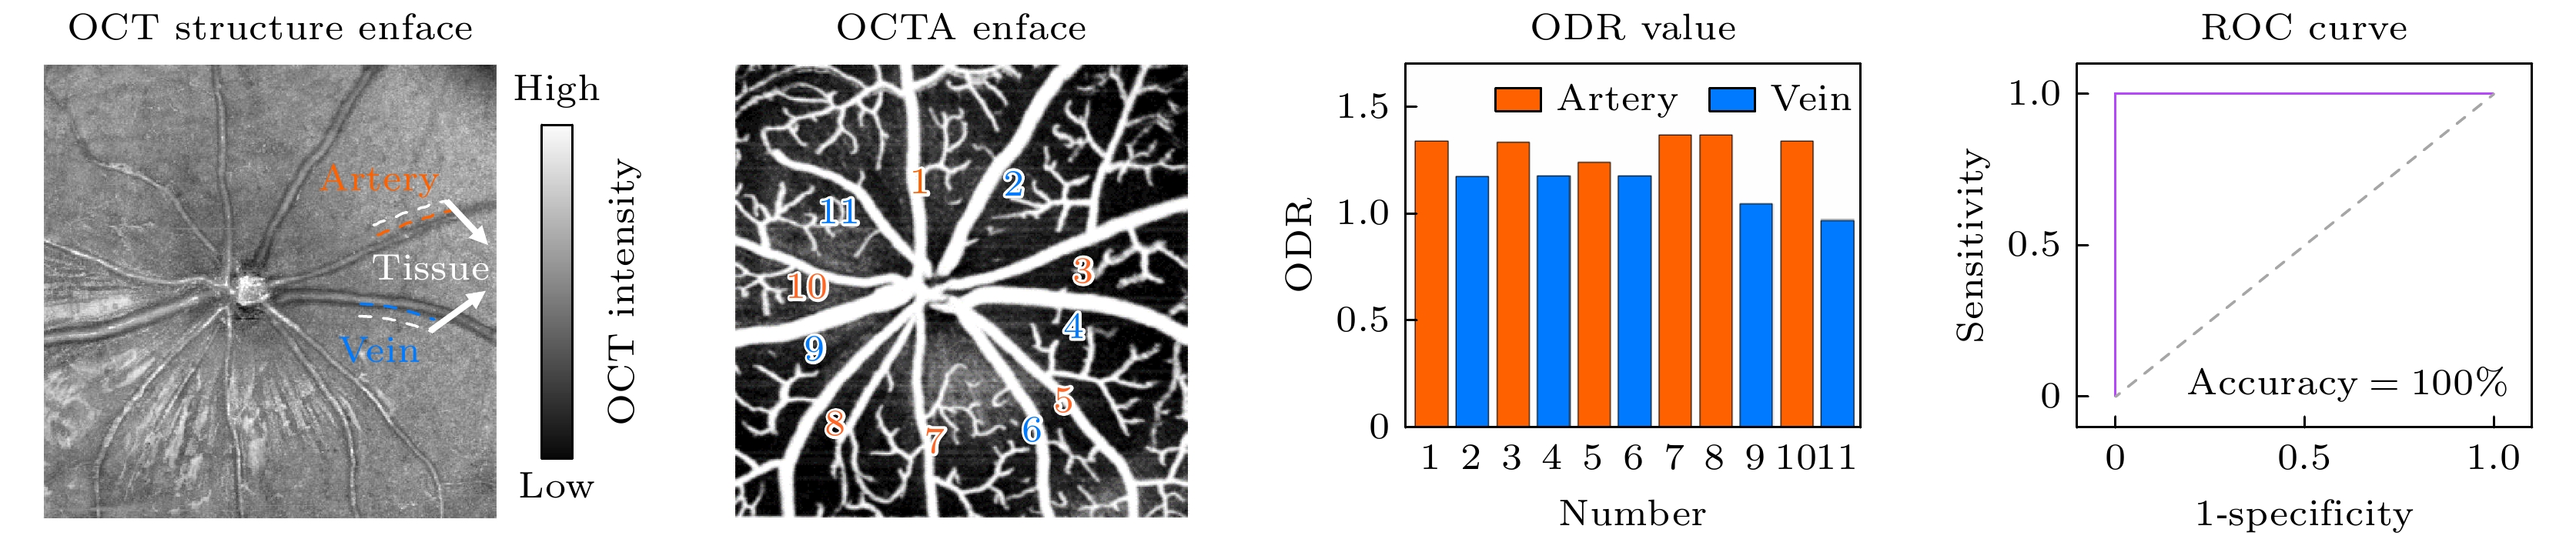
Accurate measurement of retinal blood oxygen saturation (SO2) provides valuable early insights into the pathophysiology of ocular diseases such as diabetic retinopathy, glaucoma, and retinal vein occlusion. Visible-light optical coherence tomography (OCT) can directly measure SO2 through spectral fitting, but its application is limited due to the irritability of visible light and its influence on the physiological state of the retina. Near-infrared band I (NIR-I) causes less ocular stimulation. Even though the hemoglobin absorption effect is weaker in this region, its scattering property is also related to SO2. According to this principle, we propose a novel optical coherence tomography (OCTA) guided NIR-I technique for retinal blood oxygen saturation measurement. This method is used to calculate SO2 through calibrating the optical density ratio (ODR) of oxygen-sensitive wavelength (855 nm) to isosbestic wavelength (805 nm). By utilizing the three-dimensional (3D) blood flow maps generated by the OCTA, this technique can automatically identify retinal vessels and surrounding tissue regions, thereby minimizing the errors caused by manual selection. Consequently, the classification accuracy of arteries and veins increases from 82.1% to 96.7%. The calibrated average retinal blood oxygen saturation is 94%±21% for arteries and 56%±13% for veins, which aligns with normal physiological range. The representative result of artery-vein classification is presented in the following figure. This method greatly improves the accuracy and efficiency of measurement, and provides a reliable tool for early diagnosis, disease assessment, and treatment monitoring of ophthalmic diseases, which has broad application prospects.
-
Keywords:
- optical coherence tomography angiography /
- optical coherence tomography /
- blood oxygen saturation /
- optical density
[1] Hammer M, Vilser W, Riemer T, et al. 2009 Graefes. Arch. Clin. Exp. Ophthalmol. 247 1025
 Google Scholar
[2] Hardarson S H, Stefánsson E 2012 Br. J. Ophthalmol. 96 560
Google Scholar
[3] Olafsdottir O B, Hardarson S H, Gottfredsdottir M S, Harris A, Stefánsson E 2011 Invest. Ophthalmol. Vis. Sci. 52 6409
Google Scholar
[4] Hardarson S H, Gottfredsdottir M S, Halldorsson G H, et al. 2009 Invest. Ophthalmol. Vis. Sci. 50 5247
Google Scholar
[5] Hardarson S H, Stefánsson E 2012 Acta Ophthalmol. 90 466
Google Scholar
[6] Hardarson S H, Stefánsson E 2010 Am. J. Ophthalmol. 150 871
Google Scholar
[7] Eliasdottir T S 2018 Acta Ophthalmol. 96 1
Google Scholar
[8] Garg A K, Knight D, Lando L, Chao D L 2021 Transl. Vis. Sci. Technol. 10 5
Google Scholar
[9] 高椿明, 先永利, 戴云 2017 激光与光电子学进展 54 45
Gao C M, Xian Y L, Dai Y 2017 Laser Optoelectron. Prog. 54 45
[10] Yi J, Wei Q, Liu W Z, Backman V, Zhang H F 2013 Opt. Lett. 38 1796
Google Scholar
[11] Chen S Y, Shu X, Nesper P L, Liu W Z, Fawzi A A, Zhang H F 2017 Biomed. Opt. Express 8 1415
Google Scholar
[12] Pi S H, Camino A, Cepurna W, Wei X, Zhang M, Huang D, Morrison J, Jia Y L 2018 Biomed. Opt. Express 9 2056
Google Scholar
[13] Liu K Y, Zhu T P, Gao M Q, Yin X T, Zheng R, Yan Y, Gao L, Ding Z H, Ye J, Li P 2023 Biomed. Opt. Express 14 1670
Google Scholar
[14] Faber D J, Aalders M C G, Mik E G, et al. 2004 Phys. Rev. Lett. 93 028102
Google Scholar
[15] Kagemann L, Wollstein G, Wojtkowski M, et al. 2007 J. Biomed. Opt. 12 041212
Google Scholar
[16] Ye Y F, Jiang H, Shen M X, Lam B L, Debuc D C, Ge L L, Sehi M, Wang J H 2012 Clin. Ophthalmol. 6 2085
Google Scholar
[17] Son T, Alam M, Kim T H, Liu C G, Toslak D, Yao X C 2019 Exp. Biol. Med. 244 813
Google Scholar
[18] Huang D, Swanson E A, Lin C P, et al. 1991 Science 254 1178
Google Scholar
[19] 唐弢, 赵晨, 陈志彦, 李鹏, 丁志华 2015 64 174202
Google Scholar
Tang T, Zhao C, Chen Z Y, Li P, Ding Z H 2015 Acta Phys. Sin. 64 174202
Google Scholar
[20] Deng X F, Liu K Y, Zhu T P, Guo D Y, Yin X T, Yao L, Ding Z H, Ye J, Li P 2022 Biomed. Opt. Express 13 3615
Google Scholar
[21] Huang L Z, Fu Y M, Chen R X, et al. 2019 IEEE Trans. Med. Imaging 38 2695
Google Scholar
[22] Li H K, Liu K Y, Yao L, Deng X F, Zhang Z Y, Li P 2021 J. Innov. Opt. Health. Sci. 14 2130001
Google Scholar
[23] Zhang Y M, Li H K, Cao T T, Chen R X, Qiu H X, Gu Y, Li P 2021 Quant. Imaging Med. Surg. 11 895
Google Scholar
[24] Bosschaart N, Edelman G J, Aalders M C G, van Leeuwen T G, Faber D J 2014 Lasers Med. Sci. 29 453
Google Scholar
[25] Hardarson S H, Harris A, Karlsson R A, et al. 2006 Invest. Ophthalmol. Vis. Sci. 47 5011
Google Scholar
[26] Delori F C 1988 Appl. Opt. 27 1113
Google Scholar
-
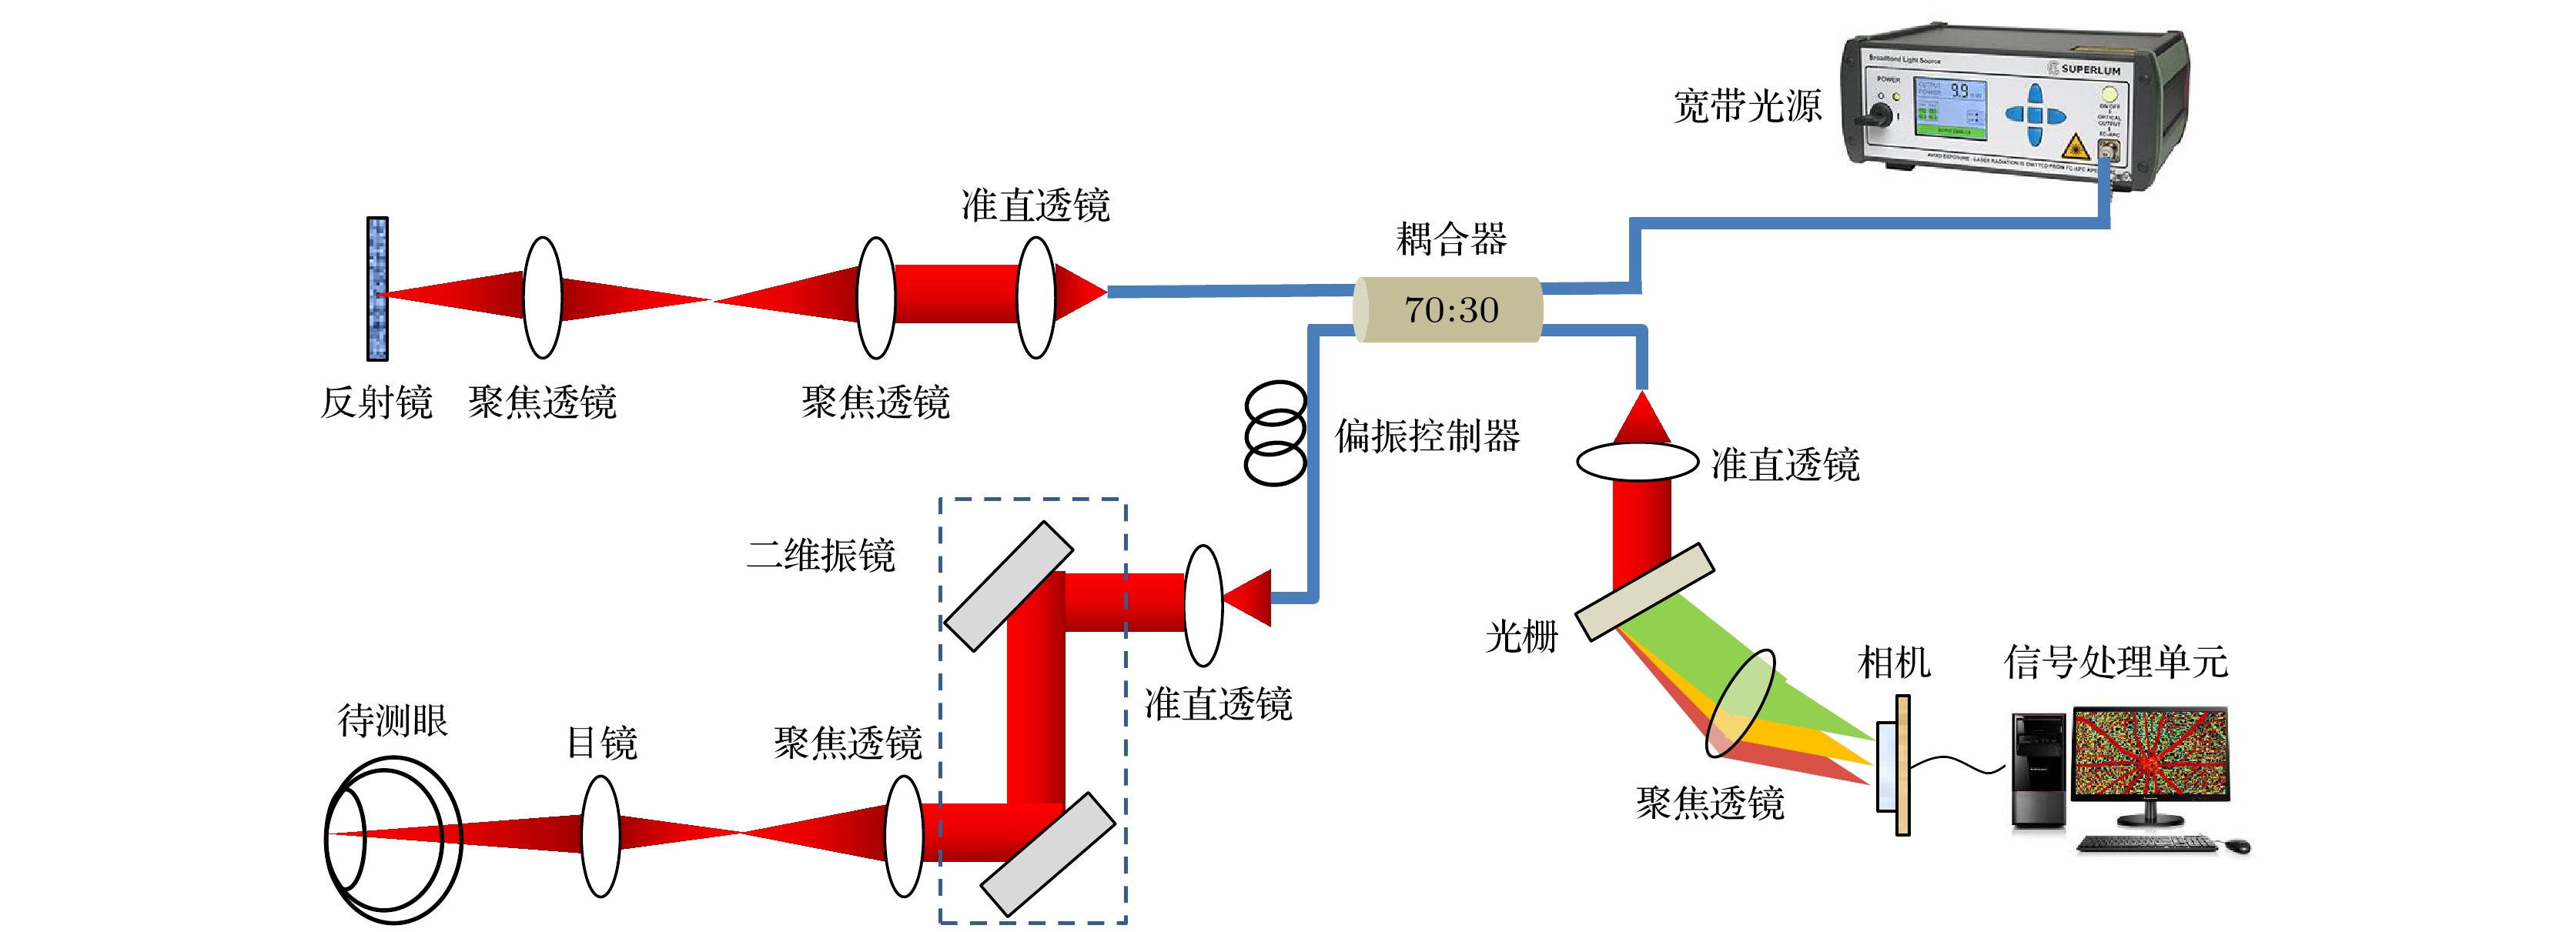
图 1 谱域OCT系统示意图
Figure 1. Schematic of SD-OCT system.
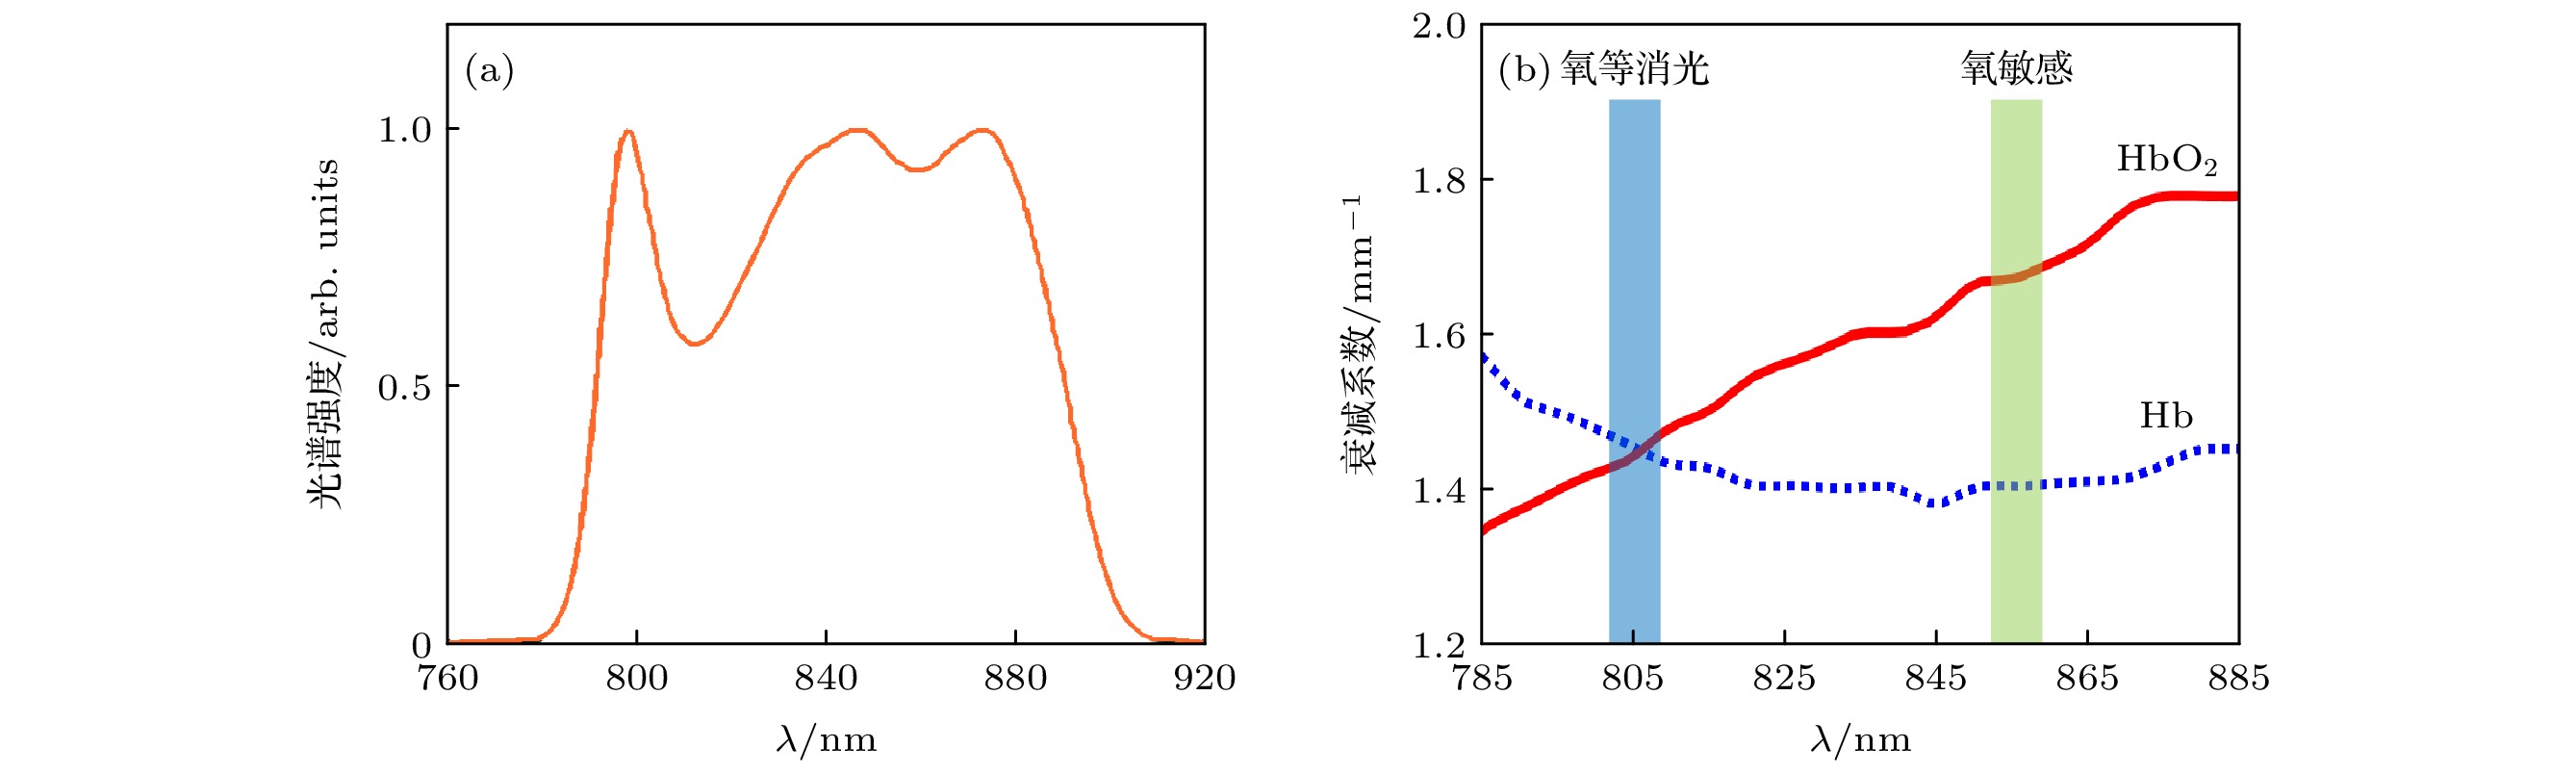
图 2 (a)近红外宽带光源光谱强度图; (b) HbO2和Hb在近红外波段的衰减光谱, 数据来源于Nienke等[24]的研究. 蓝色和绿色矩形分别代表氧等消光波长805 nm, 氧敏感波长855 nm
Figure 2. (a) Spectral intensity of the near-infrared (NIR) SLD light source; (b) extinction spectra of HbO2 and Hb at NIR band, and the data from the study of Nienke et al.[24]. The blue and green rectangles represent the oxygen-isosbestic wavelength (around 805 nm) and oxygen-sensitive wavelength (around 855 nm), respectively.
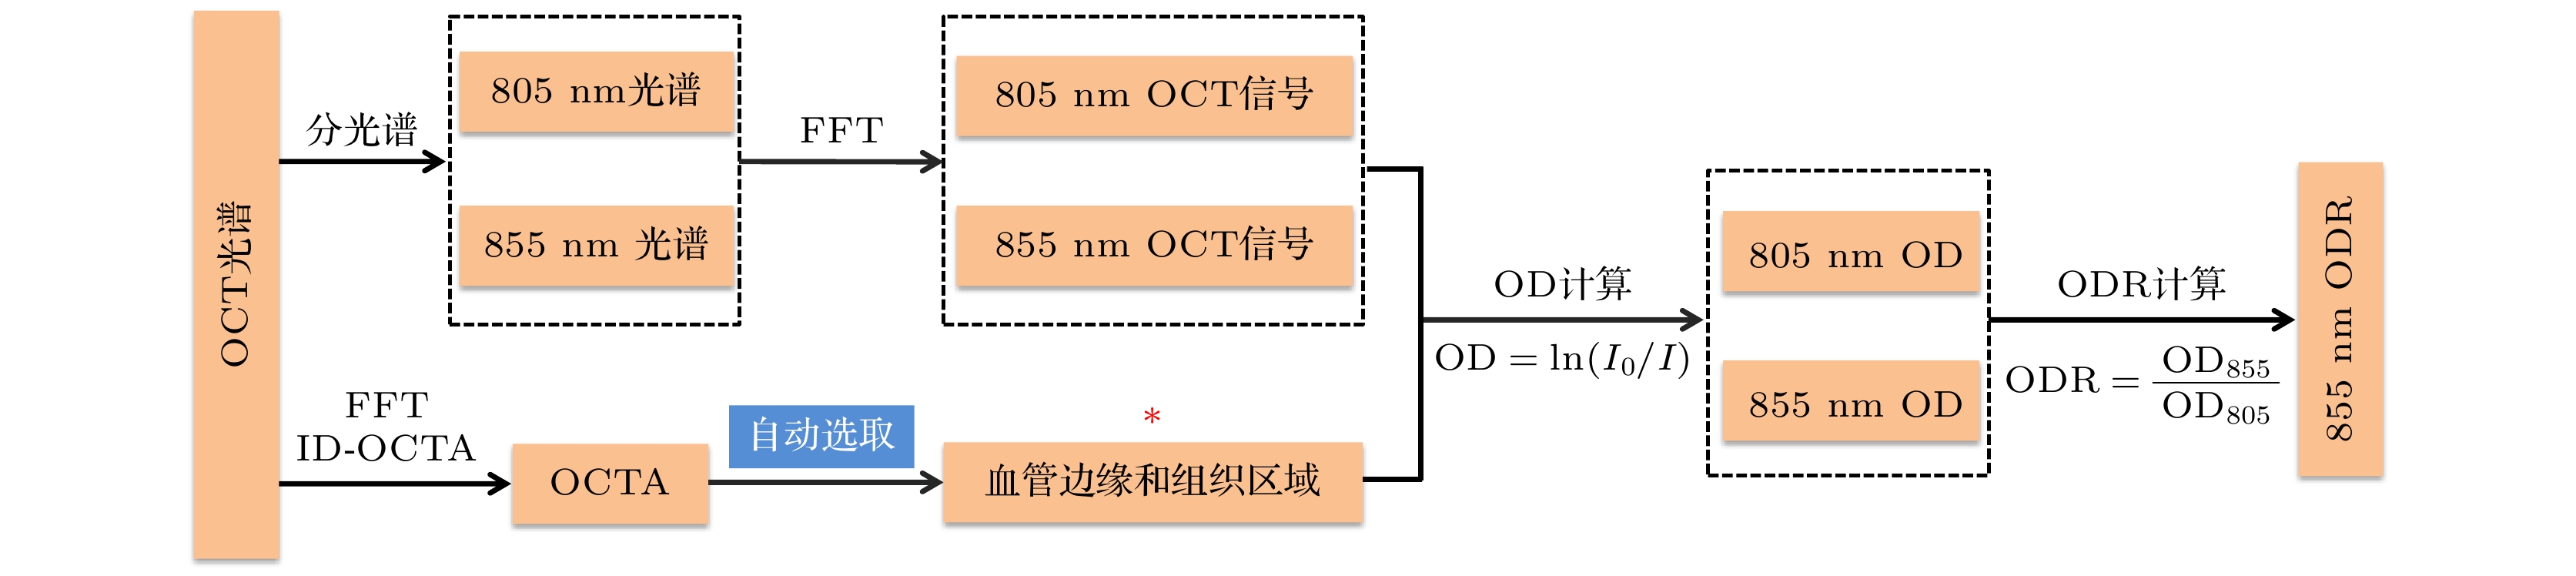
图 3 ODR分析算法流程图, ID-OCTA为基于逆信噪比和退相关的OCTA算法
Figure 3. Flowchart of the ODR analysis algorithm, ID-OCTA is OCTA based on inverse SNR and decorrelation features.
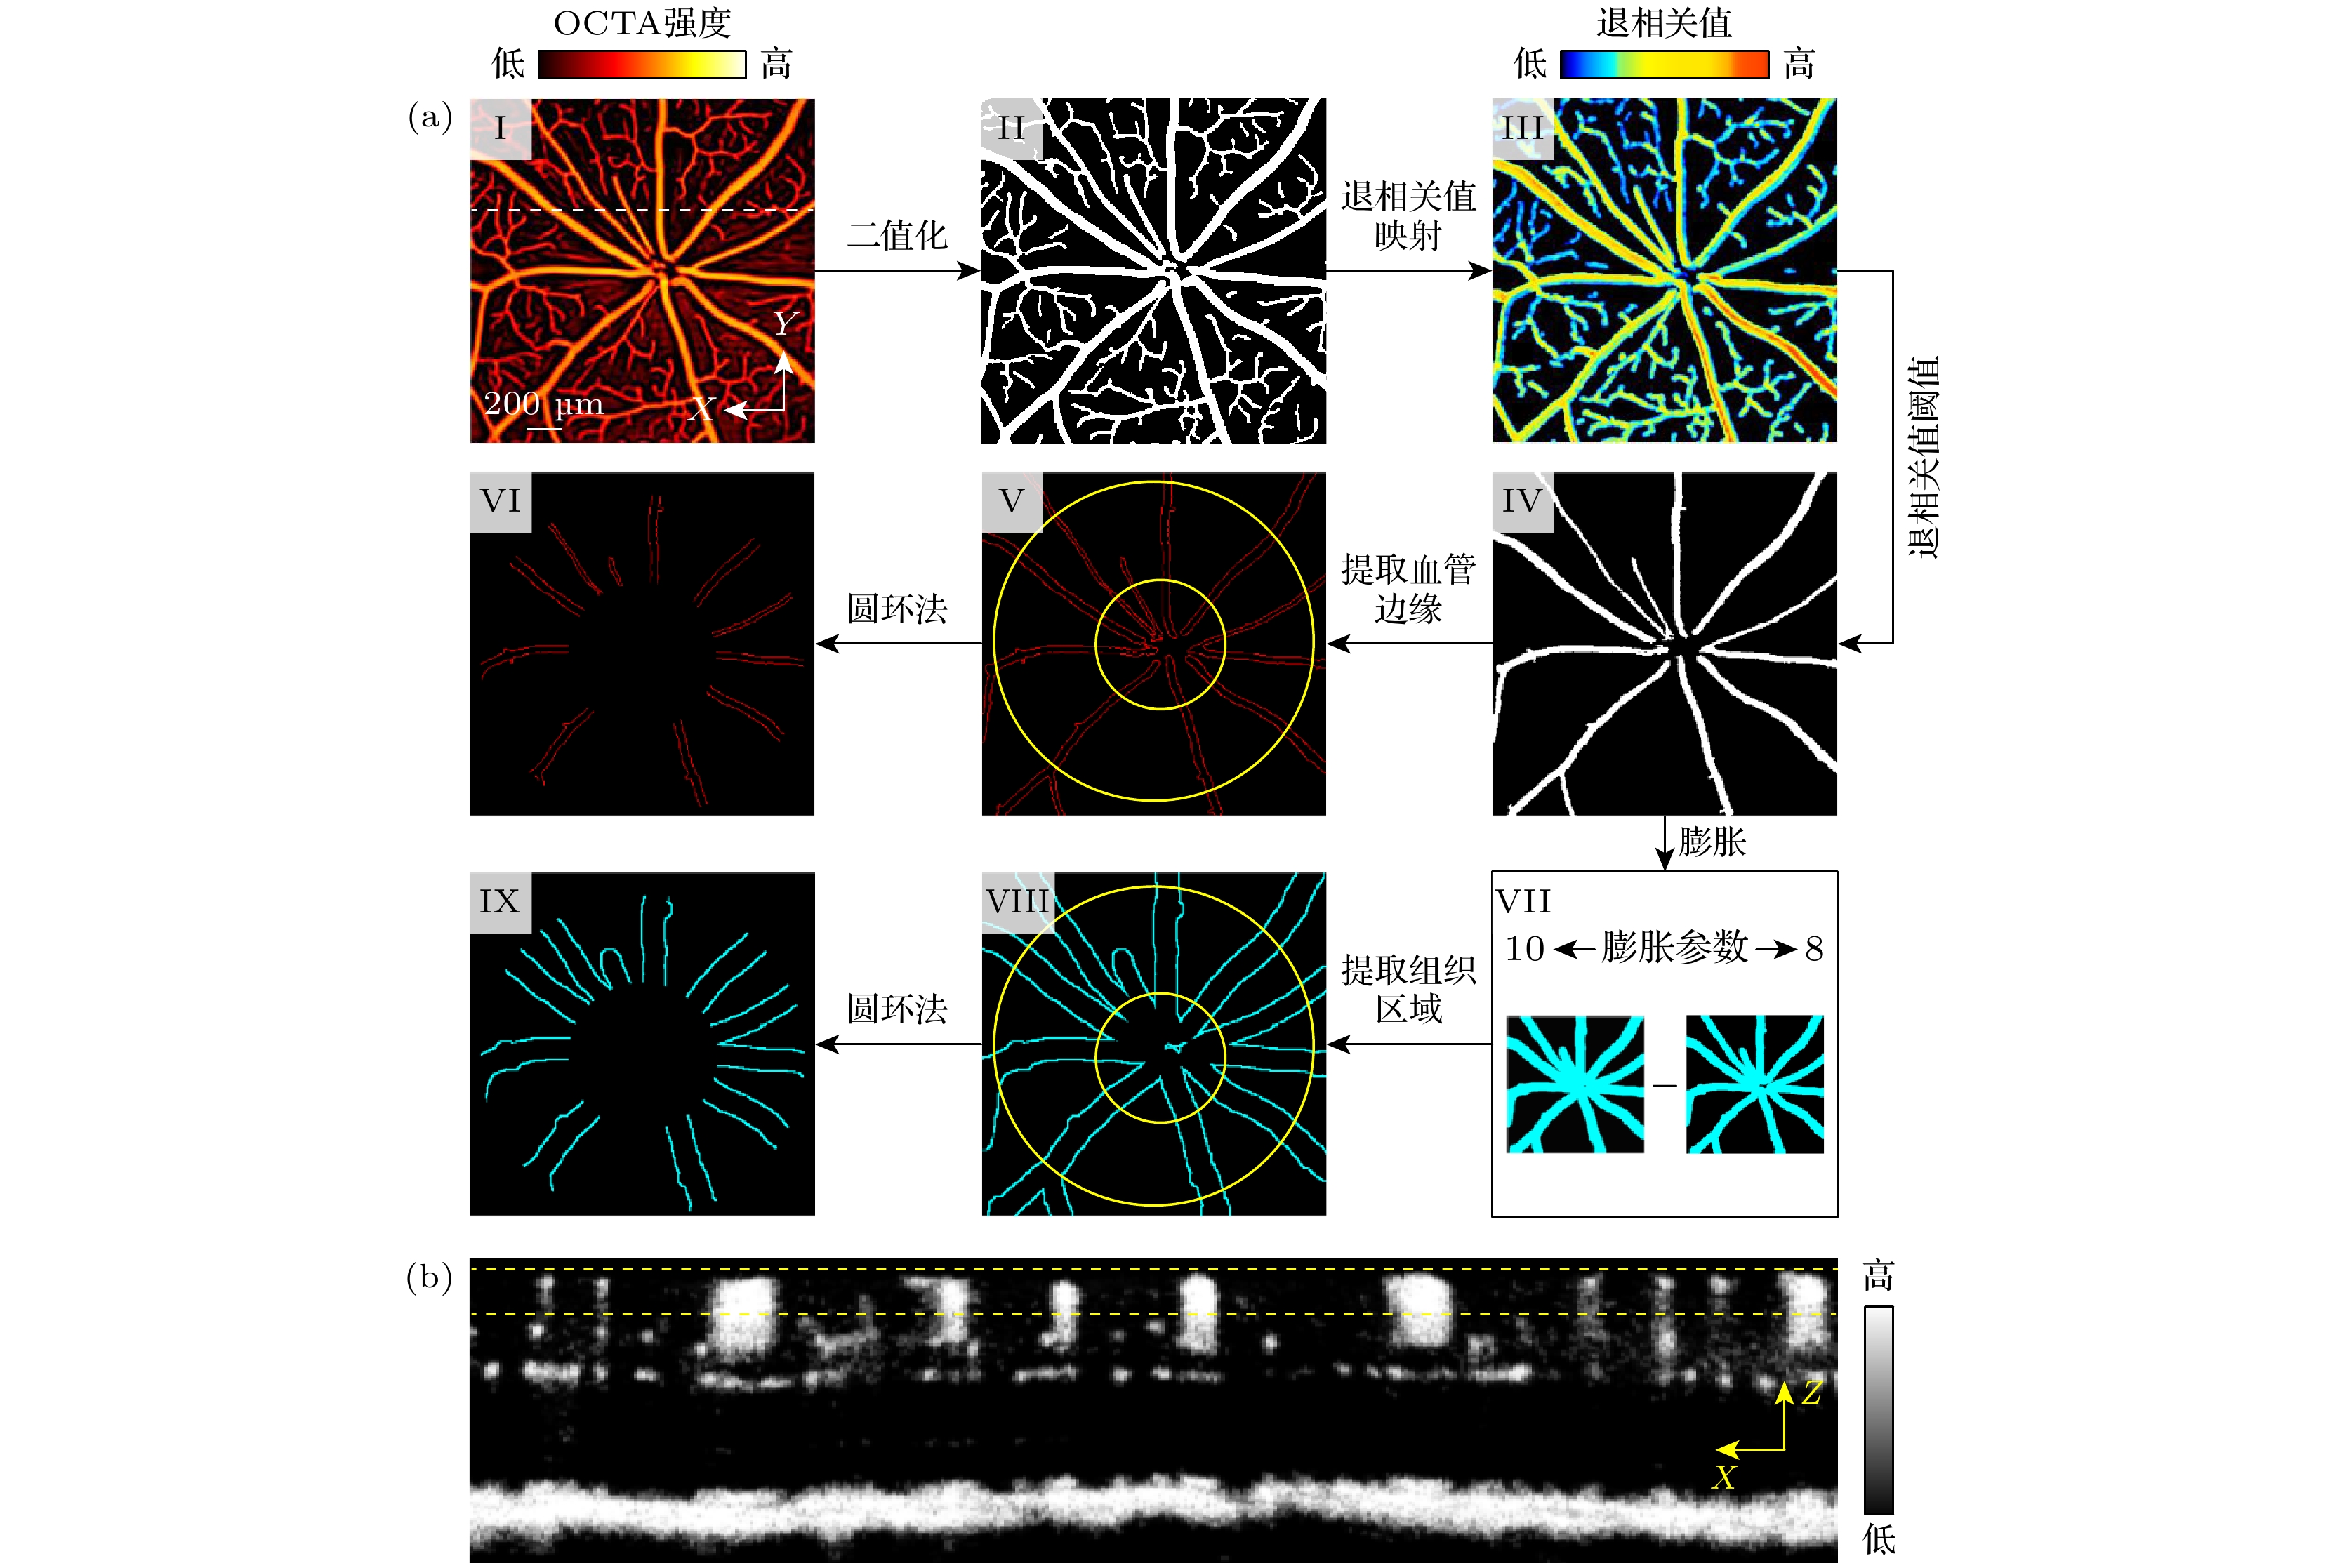
图 4 自动识别血管边缘和组织区域三维位置算法流程 (a)自动识别血管边缘和组织区域X-Y平面上位置, 其中(I), (II), (III)分别为小鼠视网膜SVP层血管的造影图, 掩模图和退相关系数图, (IV), (V)分别为小鼠视网膜SVP层大血管的掩模图和轮廓图, (VI)代表了用于ODR计算的血管区域, (VII), (VIII)分别为不同膨胀系数(10, 8)的大血管膨胀图和大血管周围组织区域图, (IX) 代表了用于ODR计算的组织区域. (b)小鼠视网膜血流断层示意图, 其位置由(I)中白色虚线示意, 黄色虚线表示深度方向上用于ODR计算的区域
Figure 4. Workflow of the algorithm for automatically identifying the 3D locations of vascular edges and adjacent tissues: (a) Automatic identification of vessel edges and tissue regions in the x-y plane, where (I)—(III) show the OCTA image, vascular mask, and decorrelation map of the mouse retina SVP, respectively, (IV) and (V) depict the mask and edge map of large vessels in the SVP, respectively, (VI) represents the vascular region used for ODR calculation. (VII) and (VIII) display images of the dilated large vessels with different dilation coefficients (10, 8) and the surrounding tissue region, (IX) shows the tissue region used for ODR calculation. (b) Representative tomogram of mouse retinal blood flow, with its position indicated by the white dashed line in (I), the yellow dashed lines in panel (b) represent the depth range used for the ODR calculation.
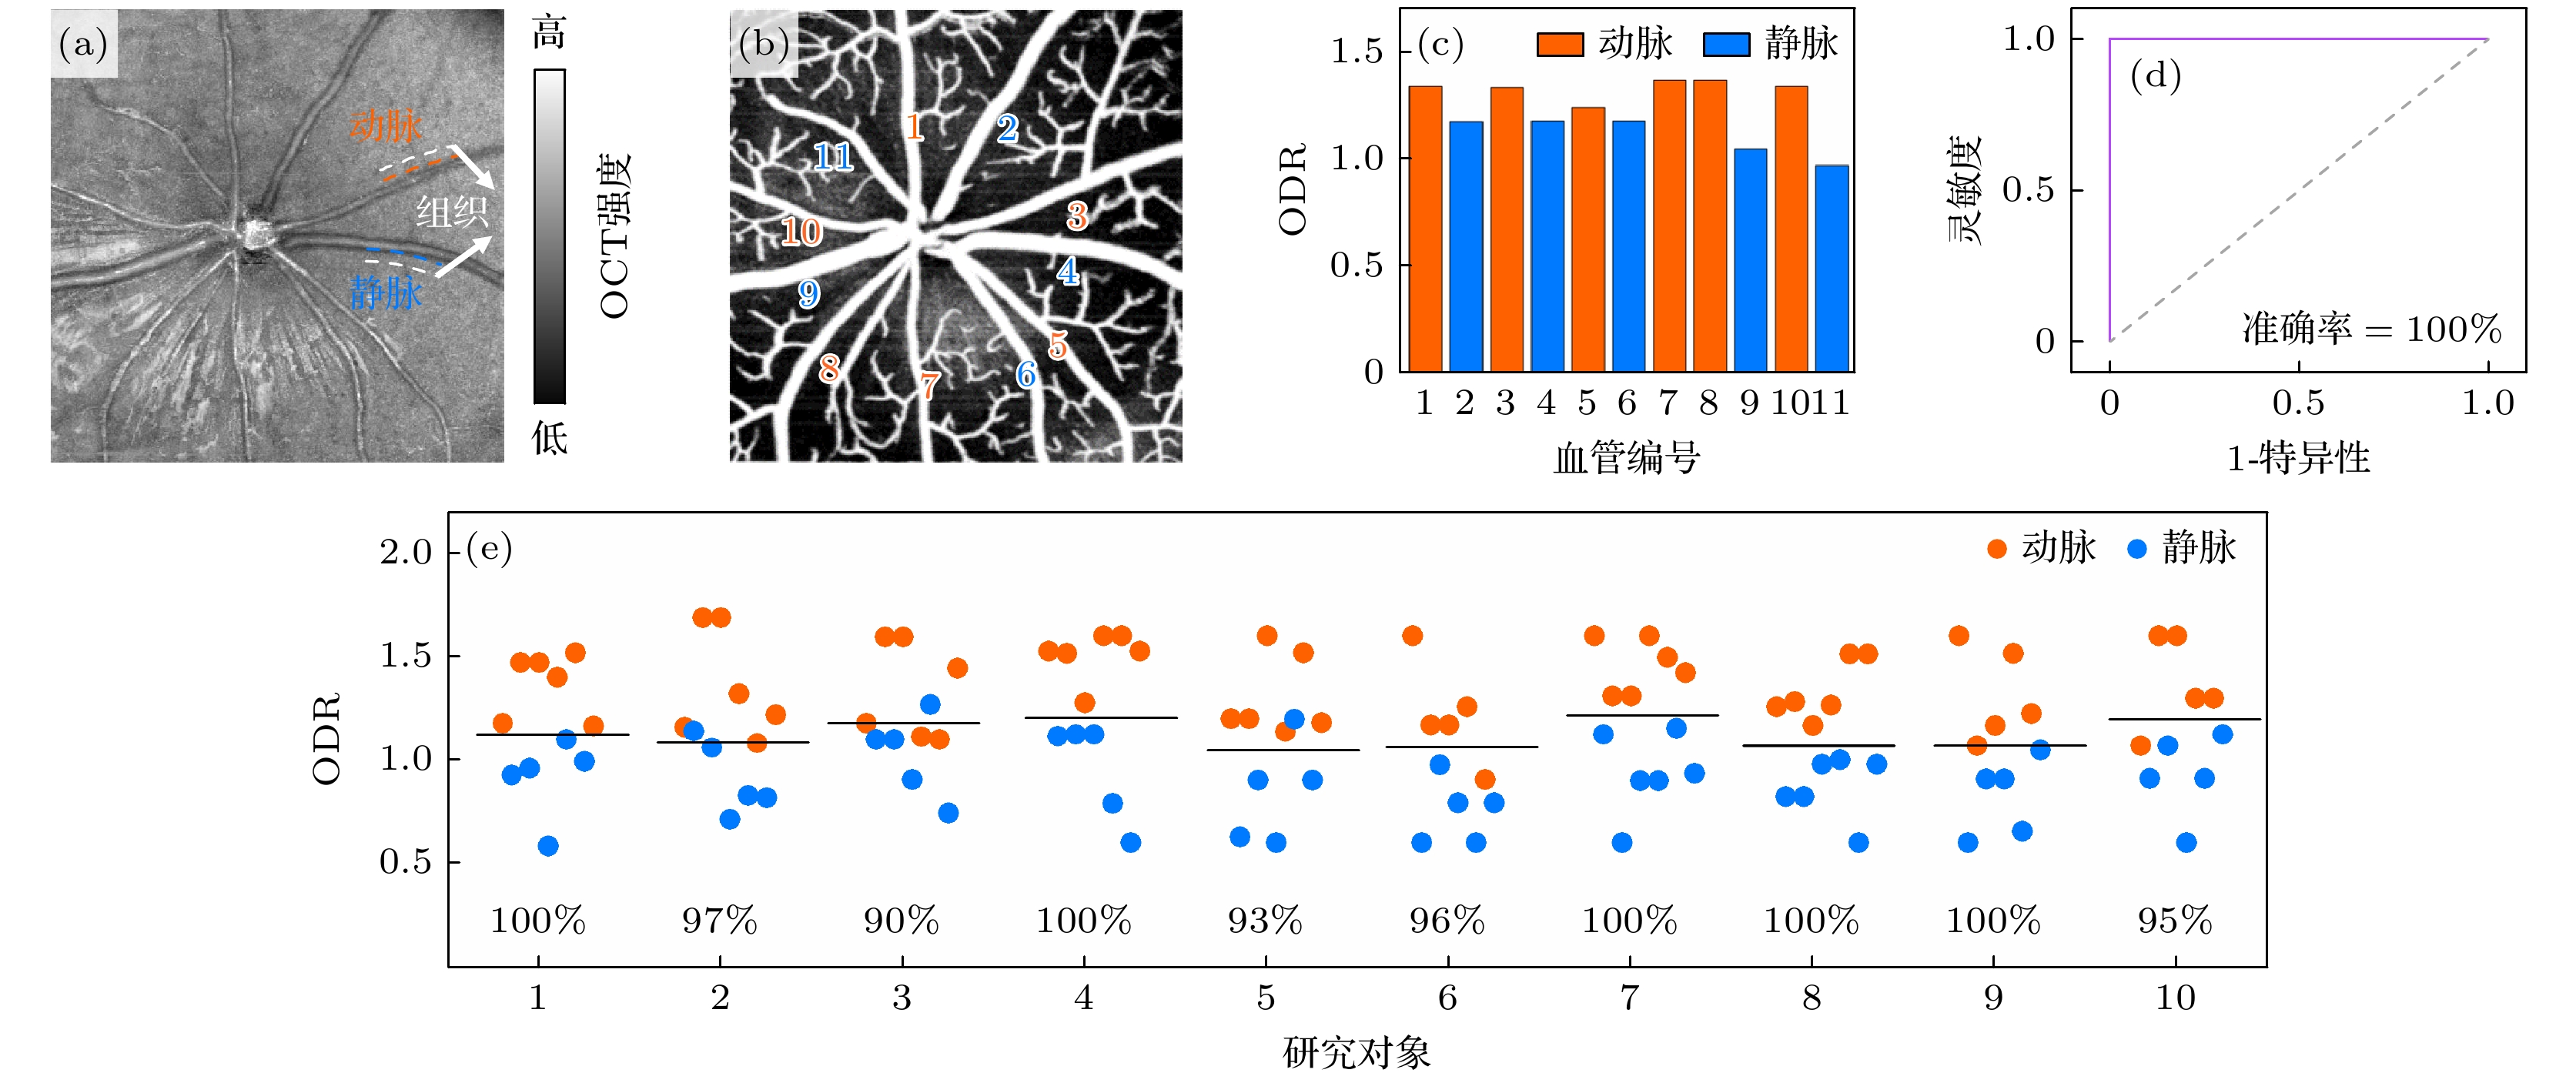
图 5 小鼠视网膜动静脉分类结果 (a) OCT均值投影图, 白色虚线为血管周围组织区域示意; (b) SVP层OCTA图; (c)图(a), (b)中大血管对应的ODR值; (d) ODR动静脉分类的ROC分析曲线; (e)代表性的10组研究对象的所有大血管的ODR值, 黑色实线表示该组中所有大血管ODR值的平均值, 图中百分比数据代表各组相应的动静脉ROC分类准确率, 所有图中红色代表动脉, 蓝色代表静脉
Figure 5. Classification results of arteries and veins in mouse retina: (a) Mean projection of OCT, with the white dashed lines indicating the tissue regions around vessels; (b) SVP OCTA image; (c) ODR values of large vessels shown in panels (a) and (b); (d) ROC analysis curve of the ability of ODR index to classify the arteries and veins; (e) ODR values of all large vessels in the representative ten subjects, with the black solid line representing the average ODR value for each subject, the percentage data in the figure represents the classification accuracy of the corresponding arteriovenous ROC in each group, red represents arteries, and blue represents veins in all panels.
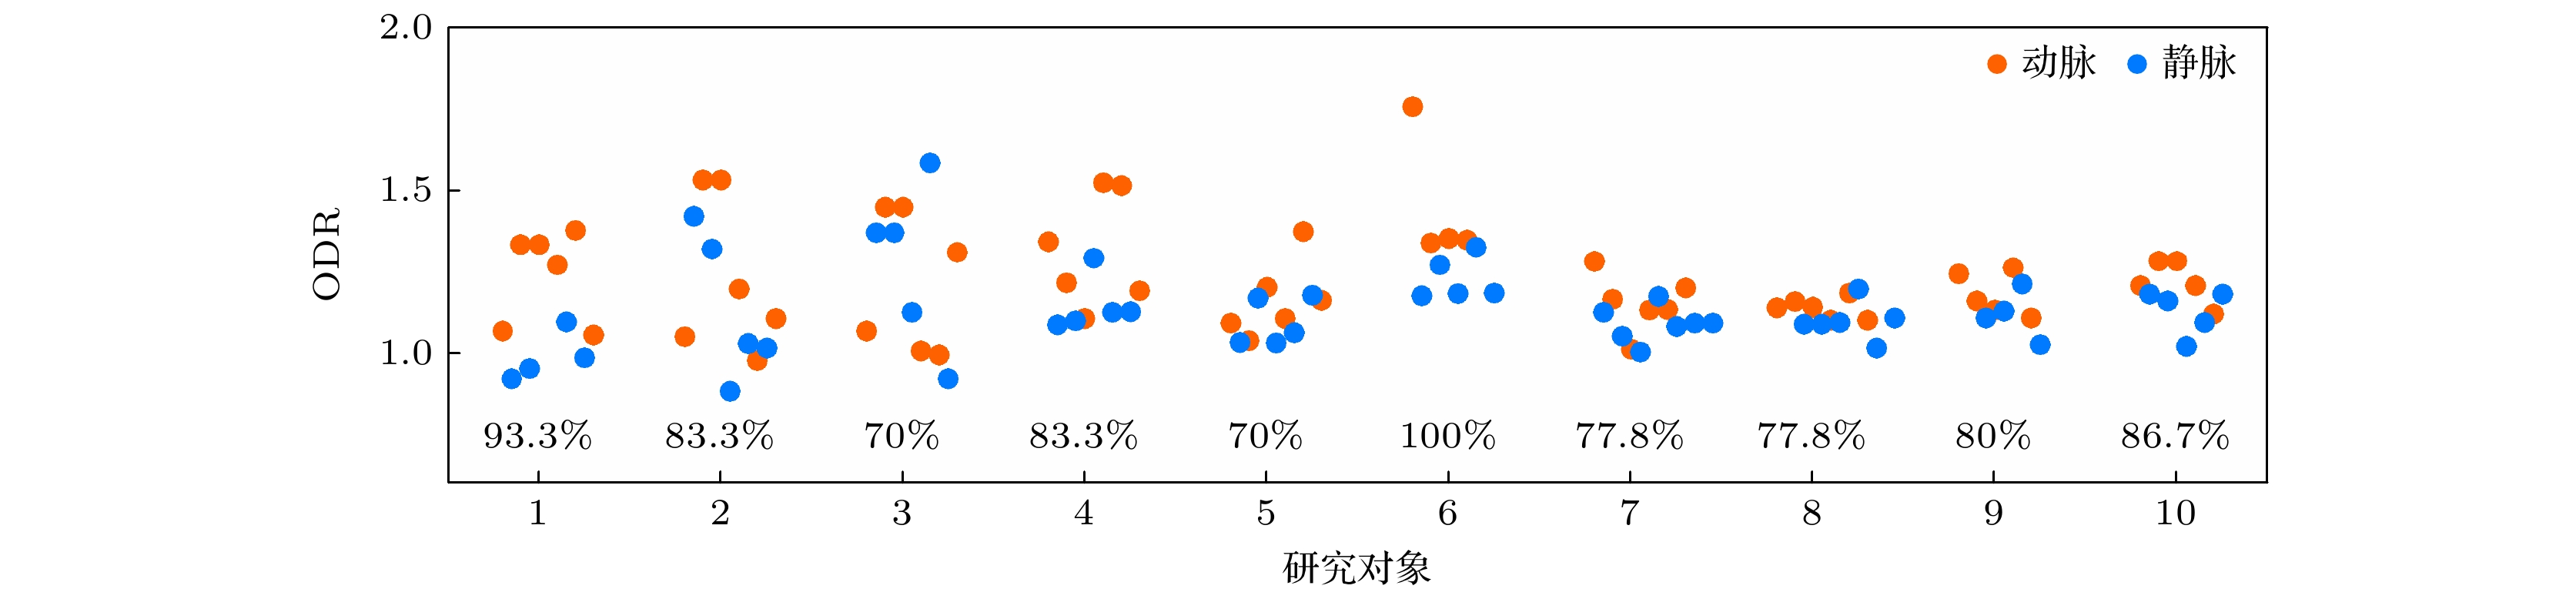
图 6 手动选取血管和组织区域得到的小鼠视网膜动静脉分类代表性结果. 图中百分比数据代表各组相应的动静脉ROC分类准确率
Figure 6. Representative arteriovenous classification results in mouse retina based on manual selection of vascular and tissue regions. the percentage data in the figure represents the classification accuracy of the corresponding arteriovenous ROC in each group.
表 1 近红外OCT视网膜血氧测量代表性结果
Table 1. Representative results of NIR OCT retinal oximetry.
研究对象 #1 #2 #3 #4 #5 #6 #7 #8 #9 #10 动脉血氧/% 91±12 90±21 92±18 99±9 91±16 90±20 98±10 91±11 90±18 91±18 静脉血氧/% 57±7 51±14 54±15 58±19 50±19 42±12 57±16 51±12 43±13 57±15  DownLoad: CSV
-
[1] Hammer M, Vilser W, Riemer T, et al. 2009 Graefes. Arch. Clin. Exp. Ophthalmol. 247 1025
Google Scholar
[2] Hardarson S H, Stefánsson E 2012 Br. J. Ophthalmol. 96 560
Google Scholar
[3] Olafsdottir O B, Hardarson S H, Gottfredsdottir M S, Harris A, Stefánsson E 2011 Invest. Ophthalmol. Vis. Sci. 52 6409
Google Scholar
[4] Hardarson S H, Gottfredsdottir M S, Halldorsson G H, et al. 2009 Invest. Ophthalmol. Vis. Sci. 50 5247
Google Scholar
[5] Hardarson S H, Stefánsson E 2012 Acta Ophthalmol. 90 466
Google Scholar
[6] Hardarson S H, Stefánsson E 2010 Am. J. Ophthalmol. 150 871
Google Scholar
[7] Eliasdottir T S 2018 Acta Ophthalmol. 96 1
Google Scholar
[8] Garg A K, Knight D, Lando L, Chao D L 2021 Transl. Vis. Sci. Technol. 10 5
Google Scholar
[9] 高椿明, 先永利, 戴云 2017 激光与光电子学进展 54 45
Gao C M, Xian Y L, Dai Y 2017 Laser Optoelectron. Prog. 54 45
[10] Yi J, Wei Q, Liu W Z, Backman V, Zhang H F 2013 Opt. Lett. 38 1796
Google Scholar
[11] Chen S Y, Shu X, Nesper P L, Liu W Z, Fawzi A A, Zhang H F 2017 Biomed. Opt. Express 8 1415
Google Scholar
[12] Pi S H, Camino A, Cepurna W, Wei X, Zhang M, Huang D, Morrison J, Jia Y L 2018 Biomed. Opt. Express 9 2056
Google Scholar
[13] Liu K Y, Zhu T P, Gao M Q, Yin X T, Zheng R, Yan Y, Gao L, Ding Z H, Ye J, Li P 2023 Biomed. Opt. Express 14 1670
Google Scholar
[14] Faber D J, Aalders M C G, Mik E G, et al. 2004 Phys. Rev. Lett. 93 028102
Google Scholar
[15] Kagemann L, Wollstein G, Wojtkowski M, et al. 2007 J. Biomed. Opt. 12 041212
Google Scholar
[16] Ye Y F, Jiang H, Shen M X, Lam B L, Debuc D C, Ge L L, Sehi M, Wang J H 2012 Clin. Ophthalmol. 6 2085
Google Scholar
[17] Son T, Alam M, Kim T H, Liu C G, Toslak D, Yao X C 2019 Exp. Biol. Med. 244 813
Google Scholar
[18] Huang D, Swanson E A, Lin C P, et al. 1991 Science 254 1178
Google Scholar
[19] 唐弢, 赵晨, 陈志彦, 李鹏, 丁志华 2015 64 174202
Google Scholar
Tang T, Zhao C, Chen Z Y, Li P, Ding Z H 2015 Acta Phys. Sin. 64 174202
Google Scholar
[20] Deng X F, Liu K Y, Zhu T P, Guo D Y, Yin X T, Yao L, Ding Z H, Ye J, Li P 2022 Biomed. Opt. Express 13 3615
Google Scholar
[21] Huang L Z, Fu Y M, Chen R X, et al. 2019 IEEE Trans. Med. Imaging 38 2695
Google Scholar
[22] Li H K, Liu K Y, Yao L, Deng X F, Zhang Z Y, Li P 2021 J. Innov. Opt. Health. Sci. 14 2130001
Google Scholar
[23] Zhang Y M, Li H K, Cao T T, Chen R X, Qiu H X, Gu Y, Li P 2021 Quant. Imaging Med. Surg. 11 895
Google Scholar
[24] Bosschaart N, Edelman G J, Aalders M C G, van Leeuwen T G, Faber D J 2014 Lasers Med. Sci. 29 453
Google Scholar
[25] Hardarson S H, Harris A, Karlsson R A, et al. 2006 Invest. Ophthalmol. Vis. Sci. 47 5011
Google Scholar
[26] Delori F C 1988 Appl. Opt. 27 1113
Google Scholar


 DownLoad:


Catalog
Metrics
- Abstract views: 1293
- PDF Downloads: 33
- Cited By: 0
