-
The minimum amount that can be detected and quantitatively analyzed by Fourier infrared spectrometer depends on the signal-to-noise ratio of the measured gas spectrum. In order to use Fourier transform infrared absorption spectroscopy to measure CO2, CO, CH4, N2O and other greenhouse gases, the signal-to-noise ratio and instrument detection limit of the mixed gas are studied. We propose a method to calculate the gas detection limit of the instrument through the HITRAN simulation spectrum. In addition, we build an experimental platform to verify the accuracy of the detection limit approximation based on the HITRAN simulation spectrum calculation, which serves as the actual measurement detection limit of the instrument, and we also analyze the reasons why there appears the error between the existing experimental platform and optimization scheme and their deficiencies as well.
-
Keywords:
- Fourier transform infrared spectroscopy /
- spectral simulation /
- detection limit /
- greenhouse gas
[1] Arevalo-Martinez D L, Beyer M, Krumbholz M, Piller I, Kock A, Steinhoff T, Körtzinger A, Bange H W 2013 Ocean Sci. 9 1071
 Google Scholar
[2] Baer D, Gupta M, Leen J B, Berman E 2012 American Laboratory 44 20
[3] Schibig M F, Steinbacher M, Buchmann B, Van Der Laan-Luijkx I, van Der Laan S, Ranjan S, Leuenberger M C 2015 Atmos. Meas. Tech. 8 57
 Google Scholar
[4] Bacsik Z, Mink J, Keresztury G 2004 Appl. Spectrosc. Rev. 39 295
 Google Scholar
[5] 程巳阳, 徐亮, 高闽光, 金岭, 李胜, 冯书香, 刘建国, 刘文清 2013 62 124206
 Google Scholar
Cheng S Y, Xu L, Cao M G, Jin L, Li S, Feng S X, Liu J G, Liu W Q 2013 Acta Phys. Sin. 62 124206
 Google Scholar
[6] 焦洋, 徐亮, 高闽光, 金岭, 童晶晶, 李胜, 魏秀丽 2013 62 140705
 Google Scholar
Jiao Y, Xu L, Gao M G, Jin L, Tong J J, Li S, Wei X L 2013 Acta Phys. Sin. 62 140705
 Google Scholar
[7] Griffith D W T, Jamie I, Esler M, Wilson S R, Parkes S D, Waring C, Bryant G W 2006 Isot. Environ. Health Stud. 42 9
 Google Scholar
[8] Griffith D W T, Deutscher N M, Caldow C, Kettlewell G, Riggenbach M, Hammer S 2012 Atmos. Meas. Tech. 5 2481
 Google Scholar
[9] Smale D, Sherlock V, Griffith D T, Moss R, Brailsford G, Nichol S, Kotkamp M 2019 Atmos. Meas. Tech. 12 637
 Google Scholar
[10] Bak J, Clausen S 1999 Appl. Spectrosc. 53 697
 Google Scholar
[11] Griffiths P R 1972 Anal. Chem. 44 1909
 Google Scholar
[12] Griffiths P R, De Haseth J A 2007 Fourier Transform Infrared Spectrometry (Vol. 171) (New Jersey: John Wiley & Sons, Inc) pp161–164
[13] Esler M B, Griffith D W T, Wilson S R, Steele L P 2000 Anal. Chem. 72 206
 Google Scholar
[14] Esler M B, Griffith D W T, Wilson S R, Steele L P 2000 Anal. Chem. 72 216
 Google Scholar
[15] Haaland D M, Easterling R G, Vopicka D A 1985 Appl. Spectrosc. 39 73
 Google Scholar
[16] Zimmermann B, Kohler A 2013 Appl Spectrosc 67 892
 Google Scholar
[17] Liu T T, Liu H, Chen Z Z, Lesgold A M 2018 IEEE Trans. Ind. Inf. 14 5268
 Google Scholar
[18] Liu H, Li Y, Zhang Z, Liu S, Liu T 2018 Opt. Express 26 22837
 Google Scholar
[19] Liu L, Huan H, Li W, Mandelis A, Wang Y, Zhang L, Zhang X, Yin X, Wu Y, Shao X 2021 Photoacoustics 21 100228
 Google Scholar
[20] Hill C, Gordon I E, Kochanov R V, Barrett L, Wilzewski J S, Rothman L S 2016 J. Quant. Spectrosc. Radiat. Transfer 177 4
 Google Scholar
[21] Kochanov R V, Gordon I, Rothman L, Wcisło P, Hill C, Wilzewski J 2016 Spectrosc. Radiat. Transfer 177 15
 Google Scholar
[22] Gordon I E, Rothman L S, Hargreaves R, Hashemi R, Karlovets E, Skinner F, Conway E, Hill C, Kochanov R, Tan Y 2021 Transfer 277 107949
[23] Manning C J, Griffiths P R 1997 Appl. Spectrosc. 51 1092
 Google Scholar
-
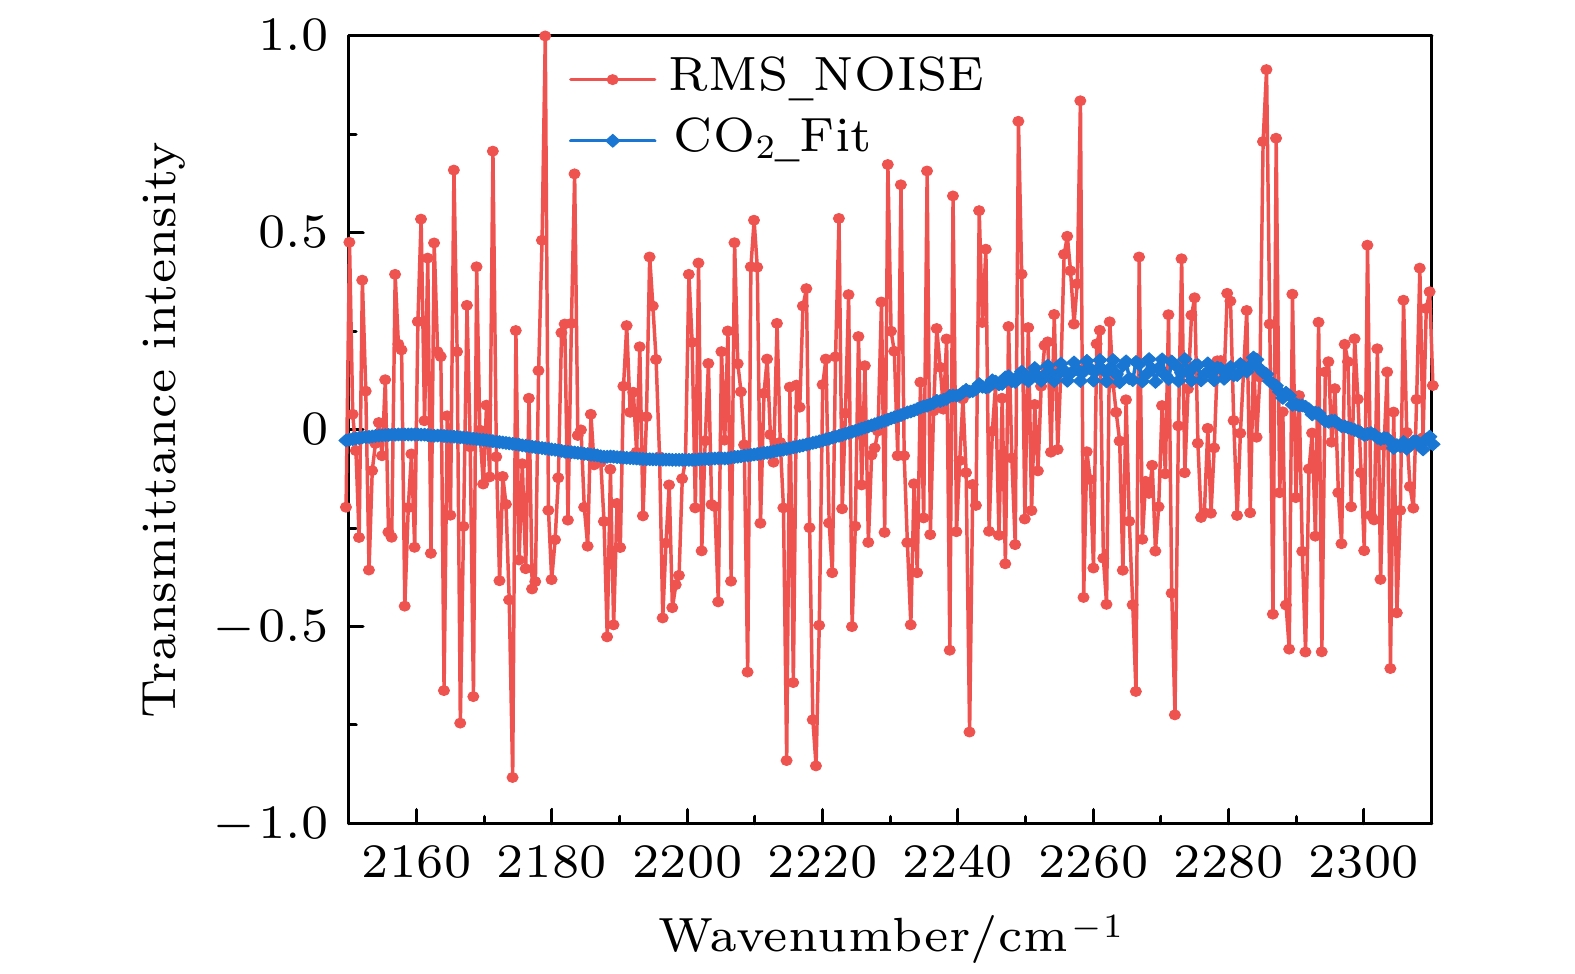
图 3 叠加噪声的透过率仿真光谱 (a)未叠加噪声与叠加噪声的仿真光谱图对比; (b)随机100次叠加0.001标准偏差的噪声的仿真光谱图的反演浓度
Figure 3. Transmittance simulation spectrum with noise added: (a) Comparing the simulated spectrogram with no noise added and noise added; (b) inversion concentration of simulated spectra with noise with 0.01 standard deviation added randomly 100 times.
表 1 WMO范围内建议的测量网络兼容性
Table 1. Recommended measurement network compatibility within WMO.
Component Wave number/cm–1 Extended network
compatibility goalRange in unpolluted
troposphereRange covered by the
WMO scaleCO2/(μmol·mol–1) 2150—2310 0.2 380—450 250—520 N2O/(nmol·mol–1) 2097—2242 0.3 325—335 260—370 CO/(nmol·mol–1) 2097—2242 5 30—300 30—500 CH4/(nmol·mol–1) 2810—3150 5 1750—2100 300—5900 表 2 检测限结果对比
Table 2. Retrieving concentration from actual spectral data of low noise detector.
Componentsequence CO2/(μmol·mol–1) N2O/(nmol·mol–1) CO/(nmol·mol–1) CH4/(μmol·mol–1) DL of MCT detector experimental measurement 6.95634 30.01392 32.98644 0.01947 DL of simulated spectrum detection 3.24915 15.63831 41.69358 0.02526 DL of MIP detector experimental measurement 2.43627 6.35112 16.89 0.012 -
[1] Arevalo-Martinez D L, Beyer M, Krumbholz M, Piller I, Kock A, Steinhoff T, Körtzinger A, Bange H W 2013 Ocean Sci. 9 1071
 Google Scholar
[2] Baer D, Gupta M, Leen J B, Berman E 2012 American Laboratory 44 20
[3] Schibig M F, Steinbacher M, Buchmann B, Van Der Laan-Luijkx I, van Der Laan S, Ranjan S, Leuenberger M C 2015 Atmos. Meas. Tech. 8 57
 Google Scholar
[4] Bacsik Z, Mink J, Keresztury G 2004 Appl. Spectrosc. Rev. 39 295
 Google Scholar
[5] 程巳阳, 徐亮, 高闽光, 金岭, 李胜, 冯书香, 刘建国, 刘文清 2013 62 124206
 Google Scholar
Cheng S Y, Xu L, Cao M G, Jin L, Li S, Feng S X, Liu J G, Liu W Q 2013 Acta Phys. Sin. 62 124206
 Google Scholar
[6] 焦洋, 徐亮, 高闽光, 金岭, 童晶晶, 李胜, 魏秀丽 2013 62 140705
 Google Scholar
Jiao Y, Xu L, Gao M G, Jin L, Tong J J, Li S, Wei X L 2013 Acta Phys. Sin. 62 140705
 Google Scholar
[7] Griffith D W T, Jamie I, Esler M, Wilson S R, Parkes S D, Waring C, Bryant G W 2006 Isot. Environ. Health Stud. 42 9
 Google Scholar
[8] Griffith D W T, Deutscher N M, Caldow C, Kettlewell G, Riggenbach M, Hammer S 2012 Atmos. Meas. Tech. 5 2481
 Google Scholar
[9] Smale D, Sherlock V, Griffith D T, Moss R, Brailsford G, Nichol S, Kotkamp M 2019 Atmos. Meas. Tech. 12 637
 Google Scholar
[10] Bak J, Clausen S 1999 Appl. Spectrosc. 53 697
 Google Scholar
[11] Griffiths P R 1972 Anal. Chem. 44 1909
 Google Scholar
[12] Griffiths P R, De Haseth J A 2007 Fourier Transform Infrared Spectrometry (Vol. 171) (New Jersey: John Wiley & Sons, Inc) pp161–164
[13] Esler M B, Griffith D W T, Wilson S R, Steele L P 2000 Anal. Chem. 72 206
 Google Scholar
[14] Esler M B, Griffith D W T, Wilson S R, Steele L P 2000 Anal. Chem. 72 216
 Google Scholar
[15] Haaland D M, Easterling R G, Vopicka D A 1985 Appl. Spectrosc. 39 73
 Google Scholar
[16] Zimmermann B, Kohler A 2013 Appl Spectrosc 67 892
 Google Scholar
[17] Liu T T, Liu H, Chen Z Z, Lesgold A M 2018 IEEE Trans. Ind. Inf. 14 5268
 Google Scholar
[18] Liu H, Li Y, Zhang Z, Liu S, Liu T 2018 Opt. Express 26 22837
 Google Scholar
[19] Liu L, Huan H, Li W, Mandelis A, Wang Y, Zhang L, Zhang X, Yin X, Wu Y, Shao X 2021 Photoacoustics 21 100228
 Google Scholar
[20] Hill C, Gordon I E, Kochanov R V, Barrett L, Wilzewski J S, Rothman L S 2016 J. Quant. Spectrosc. Radiat. Transfer 177 4
 Google Scholar
[21] Kochanov R V, Gordon I, Rothman L, Wcisło P, Hill C, Wilzewski J 2016 Spectrosc. Radiat. Transfer 177 15
 Google Scholar
[22] Gordon I E, Rothman L S, Hargreaves R, Hashemi R, Karlovets E, Skinner F, Conway E, Hill C, Kochanov R, Tan Y 2021 Transfer 277 107949
[23] Manning C J, Griffiths P R 1997 Appl. Spectrosc. 51 1092
 Google Scholar
Catalog
Metrics
- Abstract views: 11301
- PDF Downloads: 242
- Cited By: 0


 DownLoad:


