-
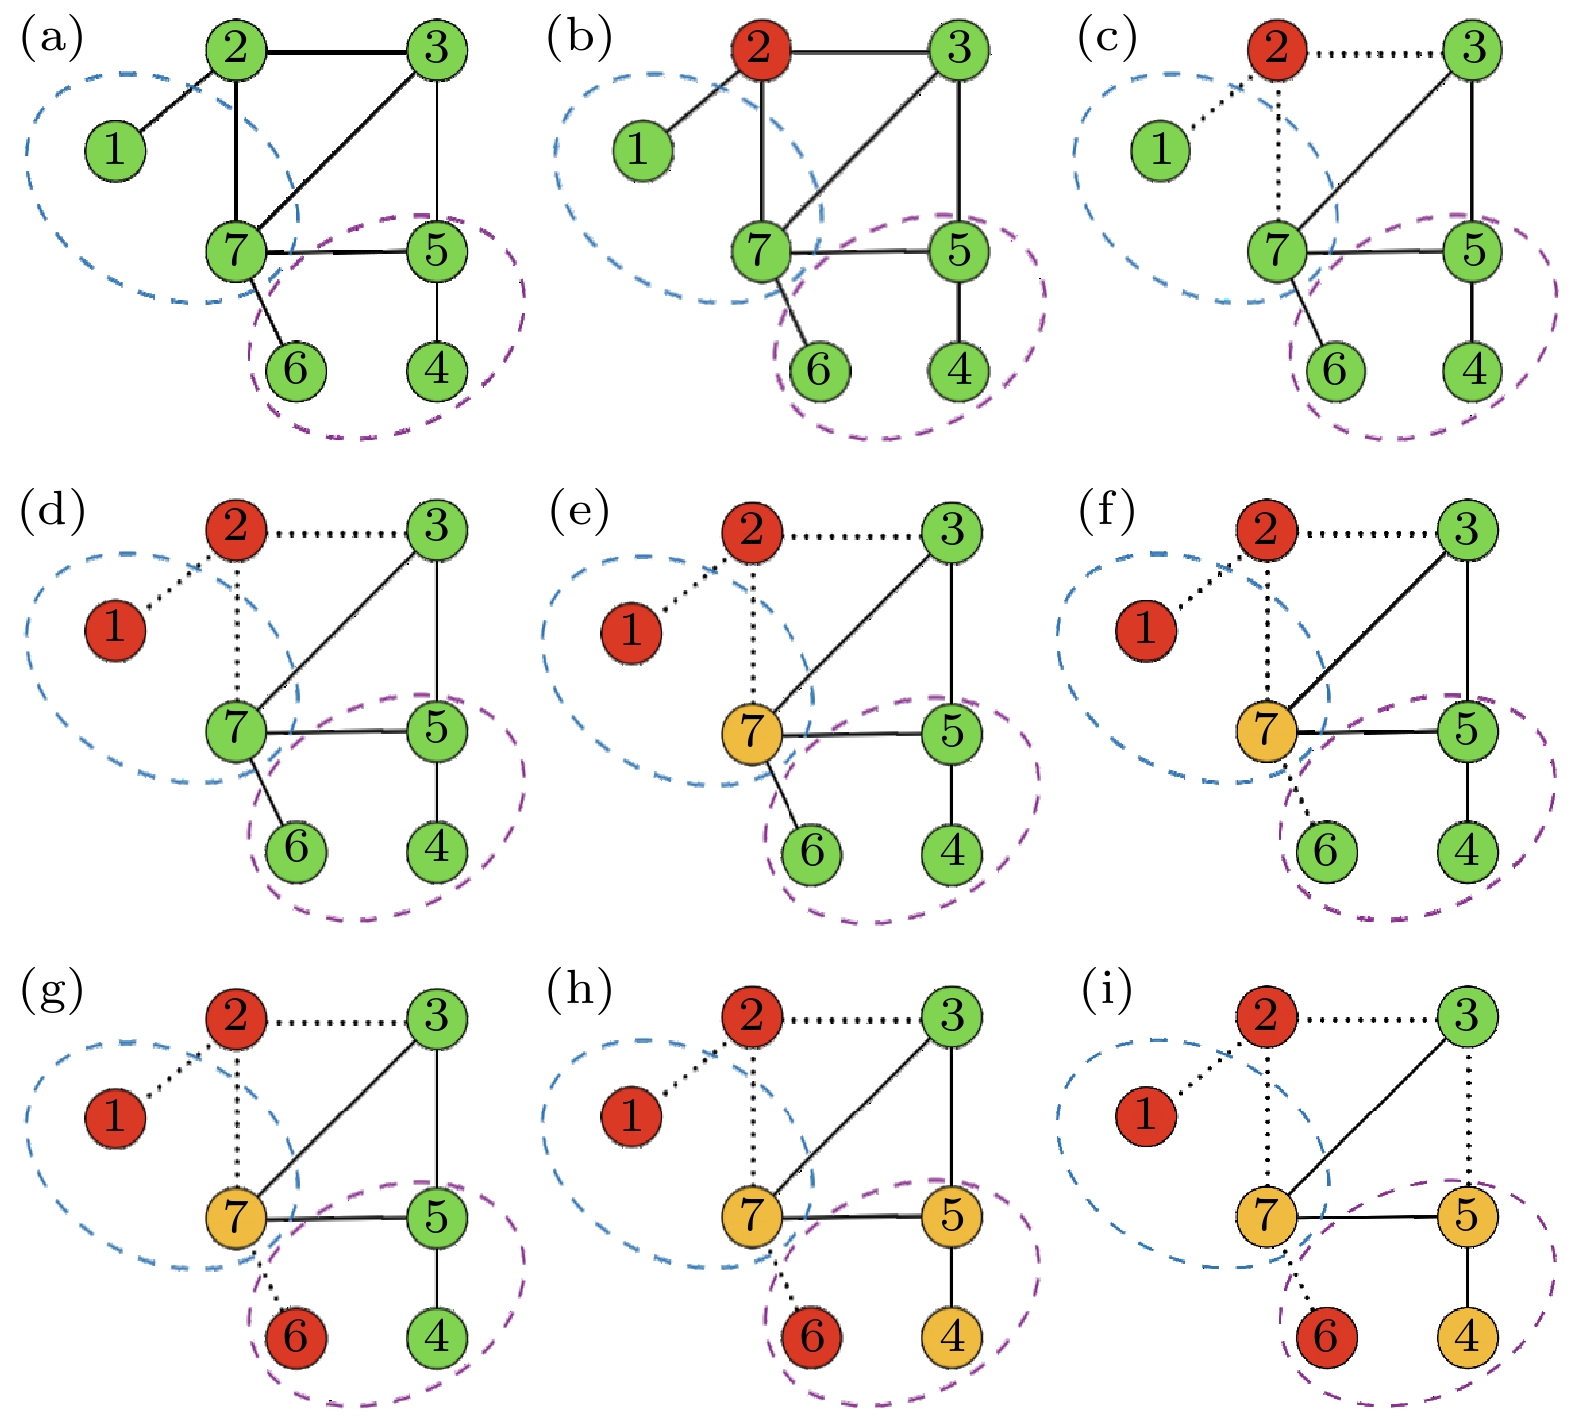
In real complex systems, the overall function is maintained through the connections among nodes. Failures of some nodes may destroy the connectivity of the system and thus damage the function of the system. In some complex systems, some nodes can form “interdependency groups” through hidden interdependency. The failure of one node may damage the rest of the nodes in the interdependency group. In this paper, we investigate the effects of the interdependency strength of the nodes, the size distribution, and the size of the interdependency groups on the cascading dynamics and the robustness of complex networks. Through numerical simulation and theoretical analysis, it is found that the cascading failures of the networks can be divided into two processes at a scale level: “intra-group cascading” and “inter-group cascading”. In the intra-group cascading process, the failure of one node will result in damage to the other nodes in the group through the interdependence among nodes, thus inducing more nodes to be unworkable and resulting in greater destructive force. In the inter-group cascading process, the failed nodes will cause the networks to be fragmented, which leads some nodes outside the interdependency group to isolate from the giant component and go to failure. Under the synergistic effects of these two processes, it is found that there are continuous and discontinuous phase transition phenomena in the cascade dynamics of the network. The occurrence of these two kinds of phase transition phenomena is related to the interdependency strength of nodes, the network degree distribution and the size distribution of the interdependency group. This means that by controlling the characteristics of interdependency groups, such as the interdependence strength of the nodes in the interdependency group or the size distribution of interdependency groups, the system can avoid collapsing suddenly and thus the robustness of the network can be improved.
-
Keywords:
- interdependency group /
- weak interdependence /
- cascading failure /
- giant component /
- robustness
[1] Du W B, Zhou X L, Lordan O, Wang Z, Zhao C, Zhu Y B 2016 Transp. Res. Pt. e-Logist. Transp. Rev. 89 108
 Google Scholar
[2] Tan F, Wu J, Xia Y, Chi K T 2014 Phys. Rev. E 89 062813
 Google Scholar
[3] Liu R R, Jia C X, Lai Y C 2019 New J. Phys. 21 045002
 Google Scholar
[4] Zhang L, Zeng G, Li D, Huang H-J, Stanley H E, Havlin S 2019 Proc. Natl. Acad. Sci. U.S.A. 116 8673
 Google Scholar
[5] Ouyang M 2014 Reliab. Eng. Syst. Saf. 121 43
 Google Scholar
[6] Newman M E, Watts D J, Strogatz S H 2002 Proc. Natl. Acad. Sci. U.S.A. 99 2566
 Google Scholar
[7] Pastor-Satorras R, Castellano C, Van Mieghem P, Vespignani A 2015 Rev. Mod. Phys. 87 925
 Google Scholar
[8] Zhao D, Wang L, Li S, Wang Z, Wang L, Gao B 2014 PLoS One 9 e112018
 Google Scholar
[9] Zhao H 2004 Neural Networks 17 47
 Google Scholar
[10] Liu X, Maiorino E, Halu A, Glass K, Prasad R B, Loscalzo J, Gao J, Sharma A 2020 Nat. Commun. 11 1
 Google Scholar
[11] Shim P-S, Lee H K, Noh J D 2012 Phys. Rev. E 86 031113
 Google Scholar
[12] Cho Y, Lee J, Herrmann H, Kahng B 2016 Phys. Rev. Lett. 116 025701
 Google Scholar
[13] Hoppe K, Rodgers G J 2014 Phys. Rev. E 90 012815
 Google Scholar
[14] Hackett A, Gleeson J P 2013 Phys. Rev. E 87 062801
 Google Scholar
[15] Callaway D S, Newman M E, Strogatz S H, Watts D J 2000 Phys. Rev. Lett. 85 5468
 Google Scholar
[16] Albert R, Jeong H, Barabási A L 2000 Nature 406 378
 Google Scholar
[17] Cohen R, Erez K, Ben-Avraham D, Havlin S 2000 Phys. Rev. Lett. 85 4626
[18] Liu J G, Wang Z T, Dang Y Z 2005 Mod. Phys. Lett. B 19 785
 Google Scholar
[19] Watts D J, Strogatz S H 1998 Nature 393 440
 Google Scholar
[20] Albert R, Barabási A L 2002 Rev. Mod. Phys. 74 47
 Google Scholar
[21] Crucitti P, Latora V, Marchiori M 2004 Phys. Rev. E 69 045104
[22] Moreno Y, Pastor-Satorras R, Vázquez A, Vespignani A 2003 EPL 62 292
 Google Scholar
[23] Zhao L, Park K, Lai Y C, Ye N 2005 Phys. Rev. E 72 025104
 Google Scholar
[24] Wang W X, Lai Y C 2009 Phys. Rev. E 80 036109
 Google Scholar
[25] Wang J, Rong L, Zhang L 2009 Mod. Phys. Lett. B 23 1323
 Google Scholar
[26] Wu X, Gu R, Ji Y, Stanley H E 2019 Phys. Rev. E 100 022309
[27] Motter A E, Lai Y C 2002 Phys. Rev. E 66 065102
 Google Scholar
[28] Lehmann J, Bernasconi J 2010 Phys. Rev. E 81 031129
 Google Scholar
[29] Wang W X, Chen G 2008 Phys. Rev. E 77 026101
[30] Yang R, Wang W X, Lai Y C, Chen G 2009 Phys. Rev. E 79 026112
 Google Scholar
[31] Zhang S P, Huang Z G, Dong J Q, Eisenberg D, Seager T P, Lai Y C 2015 New J. Phys. 17 063029
 Google Scholar
[32] Wang, J W 2012 Nonlinear Dyn. 70 1959
 Google Scholar
[33] Motter A E 2004 Phys. Rev. Lett. 93 098701
 Google Scholar
[34] Simonsen I, Buzna L, Peters K, Bornholdt S, Helbing D 2008 Phys. Rev. Lett. 100 218701
 Google Scholar
[35] Xia Y, Fan J, Hill D 2010 Physica A 389 1281
 Google Scholar
[36] Watts D J 2002 Proc. Natl. Acad. Sci. U.S.A. 99 5766
 Google Scholar
[37] Gleeson J P, Cahalane D J 2007 Phys. Rev. E 75 056103
 Google Scholar
[38] Dorogovtsev S N, Goltsev A V, Mendes J F F 2006 Phys. Rev. Lett. 96 040601
 Google Scholar
[39] Baxter G J, Dorogovtsev S N, Goltsev A V, Mendes J F 2010 Phys. Rev. E 82 011103
 Google Scholar
[40] Parshani R, Buldyrev S V, Havlin S 2011 Proc. Natl. Acad. Sci. U.S.A. 108 1007
 Google Scholar
[41] Bashan A, Parshani R, Havlin S 2011 Phys. Rev. E 83 051127
 Google Scholar
[42] Wang Z, Zhou D, Hu Y 2018 Phys. Rev. E 97 032306
[43] Niu D, Yuan X, Du M, Stanley H Eugene, Hu Y 2016 Phys. Rev. E 93 042312
[44] Wang H, Li M, Deng L, Wang B H 2018 Physica A 502 195
 Google Scholar
[45] Wang H, Li M, Deng L, Wang B H 2015 PLoS One 10 e0126674
 Google Scholar
[46] Li M, Wang B H 2014 Chin. Phys. B 23 076402
 Google Scholar
[47] Chen M, Song M, Zhang M, Jin L, Gong X 2019 Int. J. Mod. Phys. C 30 1950043
 Google Scholar
[48] Li M, Liu R R, Lyu L, Hu M B, Xu S, Zhang Y C 2021 Phys. Rep. 907 1
 Google Scholar
[49] Cao Y Y, Liu R R, Jia C X, Wang B H 2021 Commun. Nonlinear Sci. Numer. Simul. 92 105492
 Google Scholar
[50] Liu R R, Eisenberg D A, Seager T P, Lai Y C 2018 Sci. Rep. 8 2111
 Google Scholar
[51] Kong L W, Li M, Liu R-R, Wang B H 2017 Phys. Rev. E 95 032301
[52] Wu J, Deng H Z, Tan Y J, Zhu D Z 2007 J. Phys. A-Math. Theor. 40 2665
 Google Scholar
[53] Cohen R, Havlin S 2010 Complex Networks: Dtructure, Tobustness and Function (Cambridge: Cambridge University Press) p31
[54] Son S W, Bizhani G, Christensen C, Grassberger P, Paczuski M 2012 EPL 97 16006
 Google Scholar
[55] Feng L, Monterola C P, Hu Y 2015 New J. Phys. 17 063025
 Google Scholar
[56] Jiang W J, Liu R R, Jia C X 2020 Complexity 2020 3578736
-
图 2 在不同初始保留节点比例p和解耦系数α时(1)式的图解 (a)
$ \alpha=0.5 $ 的结果; (b)$\alpha=0.63$ 的结果; (c)$ \alpha=0.8 $ 的结果. 本图中所用网络的度分布服从幂率分布$P(k)\sim k^{-\gamma} (k_{{\rm{min}}}\leqslant k \leqslant k_{{\rm{max}}})$ , 其中$ k_{{\rm{min}}}=2 $ ,$ k_{{\rm{max}}}=141 $ ,$ \gamma=2.3 $ Figure 2. The graphical solutions of Eq. (1) for different values of p and α: (a) Result for
$ \alpha=0.5 $ ; (b) result for$ \alpha= 0.63 $ ; (c) result for$ \alpha= 0.8 $ . For each panel, the degree distribution of networks follows a truncated power-law distribution$P(k)\sim k^{-\gamma} $ $ (k_{{\rm{min}}}\leqslant k \leqslant k_{{\rm{max}}})$ with$ k_{{\rm{min}}}=2 $ ,$ k_{{\rm{max}}}=141 $ , and$ \gamma=2.3 $ 图 3 依赖组规模
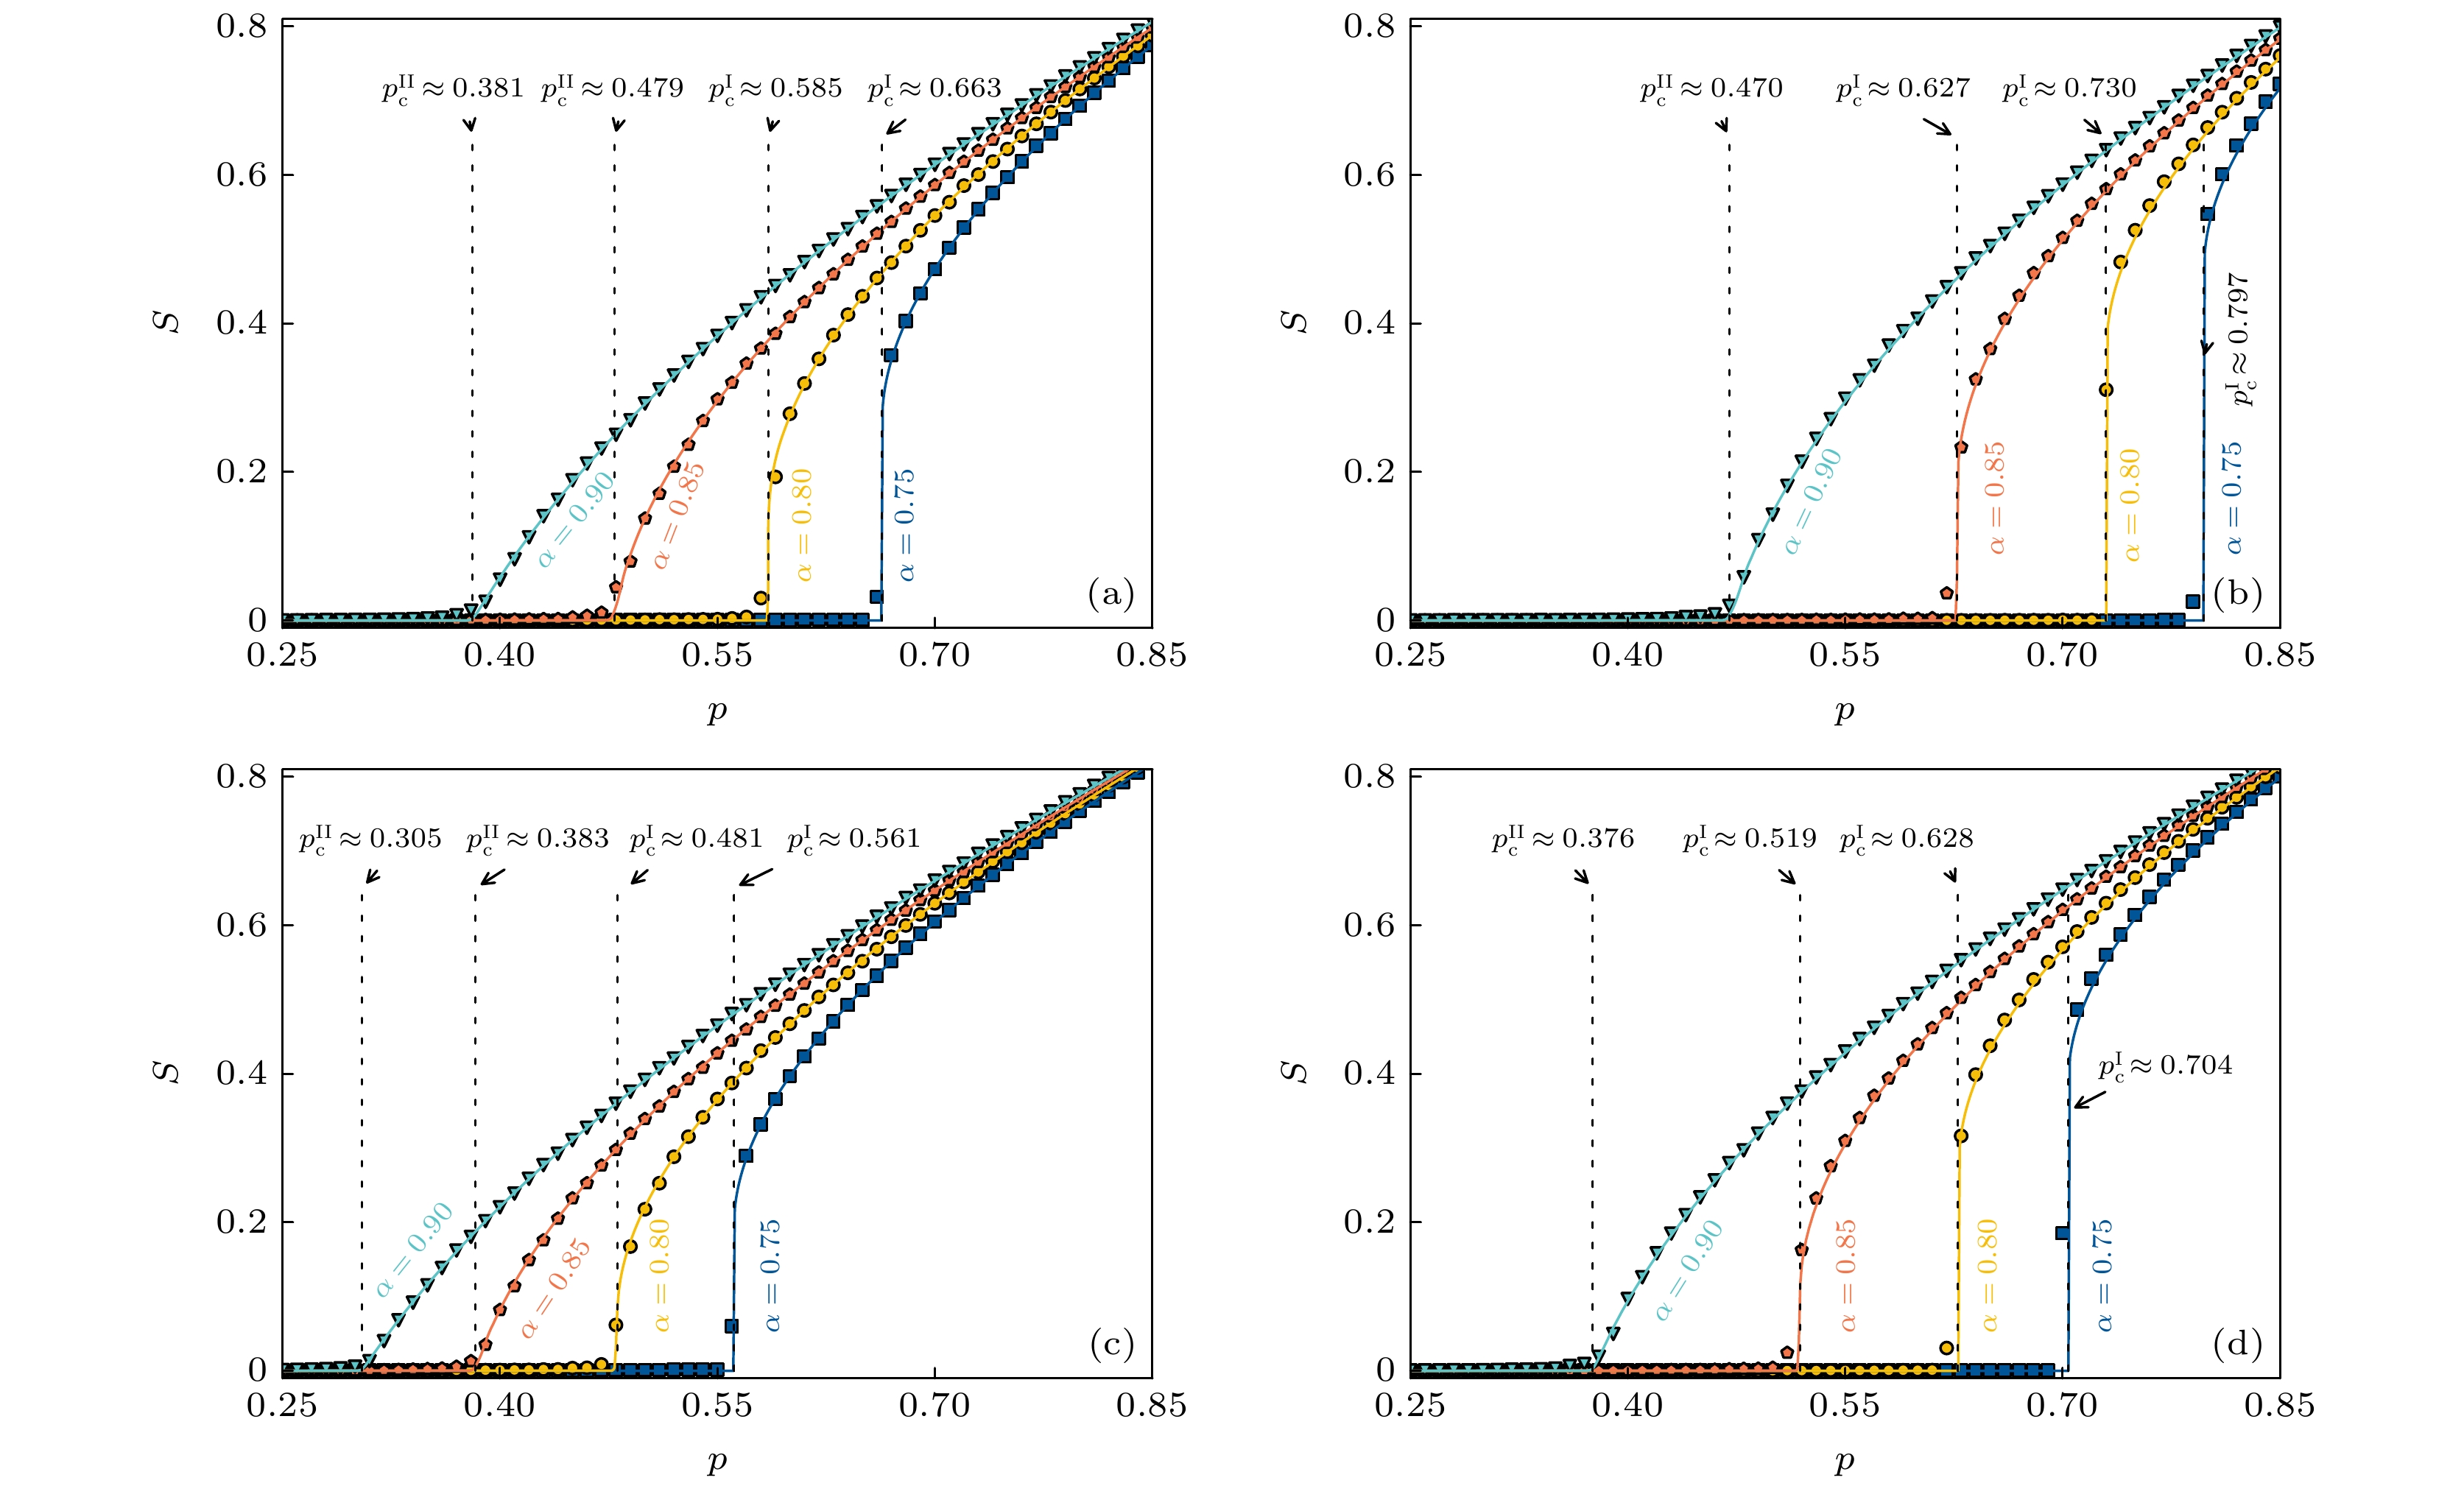
$ M=3 $ 和$ M=4 $ 的随机网络上的渗流相变 (a), (b)平均度为$ \langle k\rangle=4 $ 的随机网络, 弱依赖组大小分别为$ M=3 $ 和$ M=4 $ 的结果; (c), (d)在$ \langle k\rangle=5 $ 时, 弱依赖组平均大小分别为$ M=3 $ 和$ M=4 $ 的随机网络的结果. 图中网络规模$ N=10^5 $ , 实线表示由(1)式和(2)式得到的理论预测, 而垂直虚线分别表示由(5)式和(7)式所预测的一阶和二阶渗流相变点. 模拟结果来自于100次不同初始条件下的平均Figure 3. Simulation results for the percolation transitions on random networks with group sizes
$ M=3 $ and$ M=4 $ : (a), (b) Results for random networks with the interdependency group sizes$ M=3 $ and$ M=4 $ respectively, where the average degree$ \langle k\rangle $ is set to 4 for both panels; (c), (d) results for random networks with the interdependency group sizes$ M=3 $ and$ M=4 $ respectively, where average degree$ \langle k\rangle $ is set to 5 for both panels. The network size is$ N=10^5 $ . The solid lines behind the symbols denote the theoretical predictions that were obtained by Eqs.(1) and (2). The vertical dashed lines denote the first-order and second-order percolation transition points predicted by Eqs.(7) and (5), respectively. The simulation results were averaged from$ 100 $ realizations of different initial conditions.图 4 依赖组规模
$ M=3 $ 和$ M=4 $ 的无标度网络渗流相变 (a), (b)在$ \langle k\rangle=4 $ ($ k_{{\rm{min}}}=2 $ ,$ k_{{\rm{max}}}=63 $ ,$ \gamma=2.5 $ )时, 弱依赖组平均大小分别为$ M=3 $ 和$ M=4 $ 时的结果; (c), (d)在$ \langle k\rangle=5 $ ($ k_{{\rm{min}}}=2 $ ,$ k_{{\rm{max}}}=141 $ ,$ \gamma=2.3 $ )时, 弱依赖组规模分别为$ M=3 $ 和$ M=4 $ 时的结果. 网络规模$ N=10^5 $ . 图中实线表示由(1)式和(2)式得到的理论预测. 垂直虚线分别表示(7)式和(5)式预测的一阶和二阶渗流相变点. 模拟结果来自于100次不同初始条件下的平均Figure 4. Simulation results for the percolation transitions on scale-free networks with the interdependency group sizes
$ M=3 $ and$ M=4 $ : (a), (b) Results for scale-free networks with the interdependency group sizes$ M=3 $ and$ M=4 $ respectively, where the average degree$ \langle k\rangle $ is$ 4 $ with$ k_{{\rm{min}}}=2 $ ,$ k_{{\rm{max}}}=63 $ and$ \gamma=2.5 $ ; (c), (d) results for scale-free networks with the interdependency group sizes$ M=3 $ and$ M=4 $ respectively, where the average degree$ \langle k\rangle $ is$ 5 $ with$ k_{{\rm{min}}}=2 $ ,$ k_{{\rm{max}}}=141 $ and$ \gamma=2.3 $ . The network size is$ N=10^5 $ . The solid lines behind the symbols denote the theoretical predictions by Eqs.(1) and (2), and the vertical dashed lines denote the first-order or second-order percolation transition points predicted by Eqs.(7) and (5), respectively. The simulation results are averaged from$ 100 $ realizations of different initial conditions图 5 随机网络和无标度网络在弱依赖组规模服从平均分布时渗流相变点
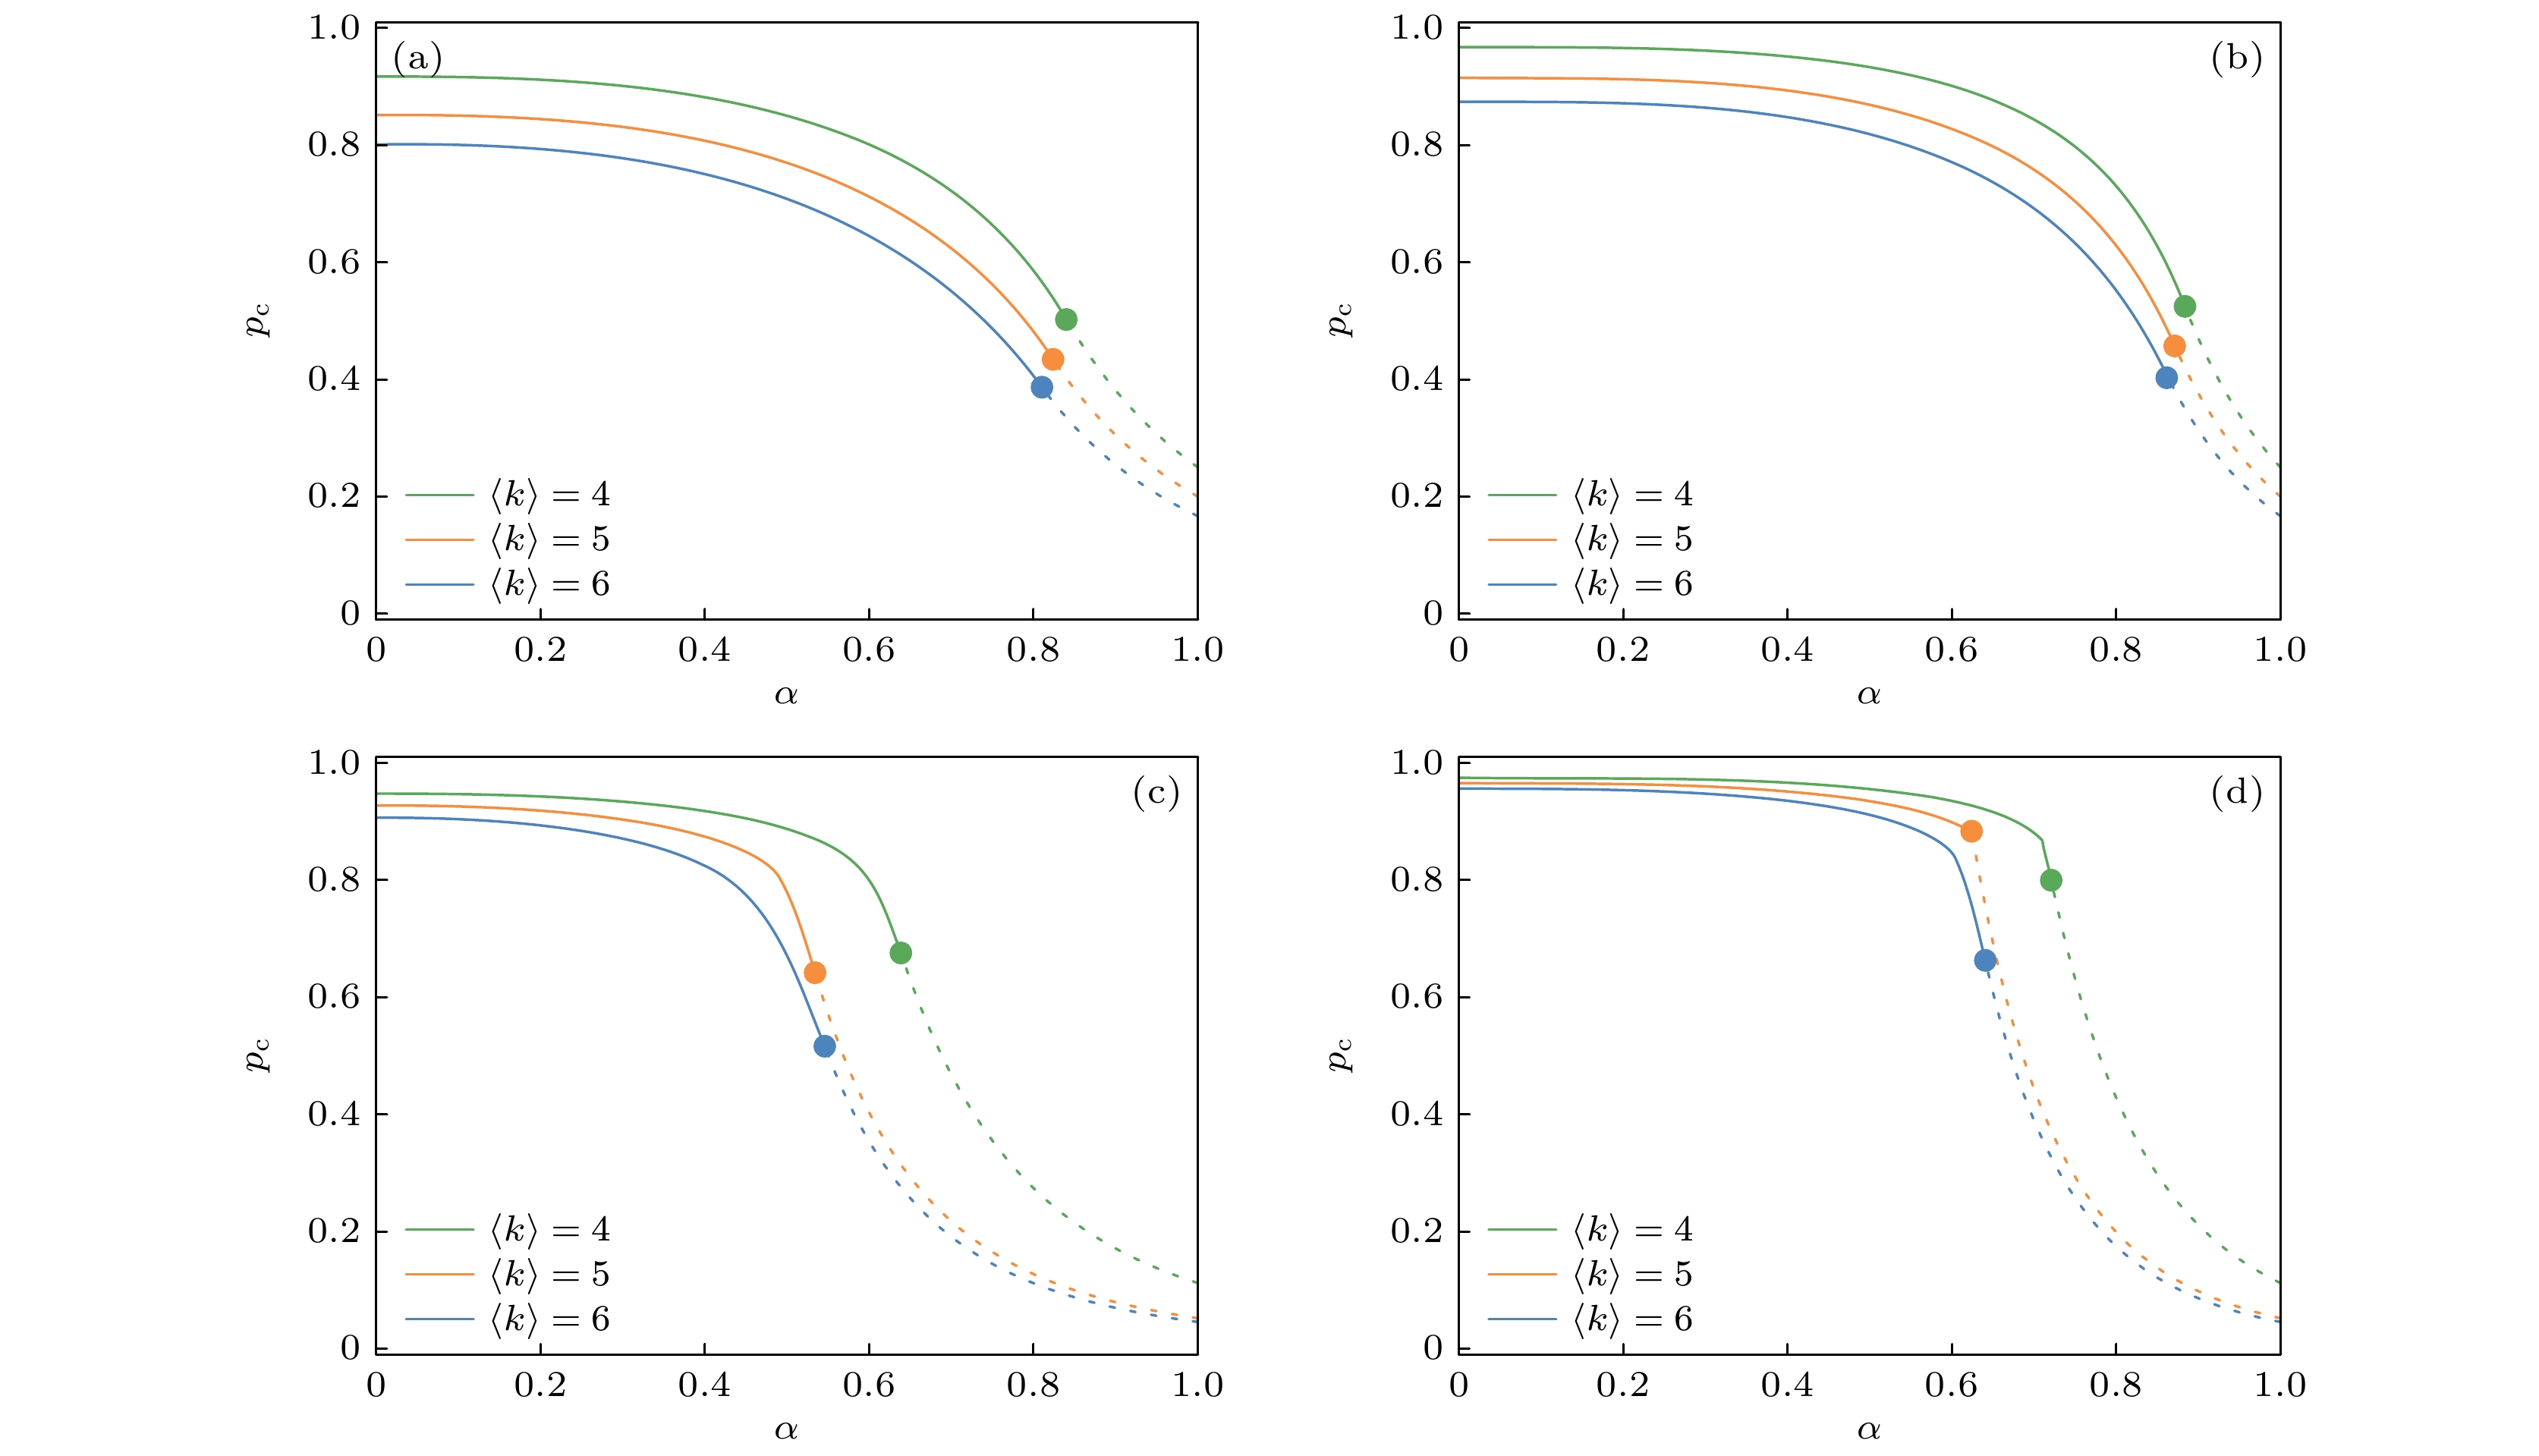
$ p_c $ 与α的关系 (a)依赖组规模$ M=3 $ 的随机网络的渗流相变点$ p_{\rm{c}}^{\rm{I}} $ 或$ p_{\rm{c}}^{{\rm{II}}} $ 与α的关系, 其中平均度$ \langle k\rangle $ 为4, 5和6; (b)依赖组规模$ M=4 $ 的随机网络的结果; (c)平均度$ \langle k\rangle $ 为4, 5和6 (分别对应度分布的幂律指数$ \gamma $ 为2.5, 2.3和2.1)且依赖组规模$ M=3 $ 的无标度网络的结果; (d)依赖组规模$ M=4 $ 的无标度网络的结果. 图中实线为一阶渗流相变点$ p_{\rm{c}}^{\rm{I}} $ , 虚线为二阶渗流相变点$ p_{\rm{c}}^{{\rm{II}}} $ . 模拟结果来自于100次不同初始条件下的平均Figure 5. The percolation transition point
$ p_c $ as functions of α on random networks and scale-free networks with uniform interdependency group size: (a) Results for random networks with the interdependency group size$ M=3 $ , where the average degree$ \langle k\rangle $ is 4, 5 and 6 from high to low; (b) results for random networks with the group size$ M=4 $ , where the average degree$ \langle k\rangle $ is 4, 5 and 6 from high to low; (c) results for scale-free networks with the group size$ M=3 $ , where the average degree$ \langle k\rangle $ is 4, 5 and 6 (corresponding to a power-law exponent of degree distribution$ \gamma $ is 2.5, 2.3 and 2.1, respectively); (d) results for scale-free networks with the interdependency group size$ M=4 $ , where the average degree$ \langle k\rangle $ is 4, 5 and 6. The solid line is the first-order percolation transition point$ p_{\rm{c}}^{\rm{I}} $ , and the dashed line is the second-order percolation transition point$ p_{\rm{c}}^{{\rm{II}}} $ . The simulation results were averaged from 100 realizations of different initial conditions图 6 弱依赖组平均规模
$ \langle M \rangle=3 $ 和$ \langle M \rangle=4 $ 的随机网络渗流相变的模拟结果 (a), (b) 平均度$ \langle k\rangle=4 $ 的ER随机网络在依赖组平均规模分别为$ \langle M \rangle=3 $ 和$ \langle M \rangle=4 $ 时的结果; (c), (d)平均度$ \langle k\rangle=5 $ 的ER 随机网络在依赖组平均规模分别为$ \langle M \rangle=3 $ 和$ \langle M \rangle=4 $ 时的结果. 网络规模设为$ N=10^5 $ . 图中实线表示由(12)式和(13)式得到的理论预测. 垂直虚线分别表示理论预测的一阶和二阶渗流相变点. 模拟结果来自于100次不同初始条件下的平均Figure 6. Simulation results for percolation transitions on random networks with average group sizes
$ \langle M\rangle=3 $ and$ \langle M\rangle=4 $ : (a), (b) Results for random networks with the average group sizes$ \langle M\rangle=3 $ and$ \langle M\rangle=4 $ , respectively, where the average degree$ \langle k\rangle $ is$ 4 $ ; (c), (d) results for random networks with the average group sizes$ \langle M\rangle=3 $ and$ \langle M\rangle=4 $ respectively, where$ \langle k\rangle $ is 5. The network size is$ N=10^5 $ . The solid lines behind the symbols denote the theoretical predictions that were obtained by Eqs. (12) and (13), and the vertical dashed lines denote the first-order and second-order percolation transition points predicted by theory. The simulation results were averaged from$ 100 $ realizations of different initial conditions图 7 弱依赖组平均规模
$ \langle M\rangle=5 $ 和$ \langle M\rangle=6 $ 的无标度网络渗流相变的模拟结果 (a), (b)在$ \langle k\rangle=4 $ , 即$ k_{{\rm{min}}}=2 $ ,$ k_{{\rm{max}}}=63 $ ,$ \gamma=2.5 $ 时, 弱依赖组平均规模分别为$ \langle M\rangle=5 $ 和$ \langle M\rangle=6 $ 的结果; (c), (d) 在$ \langle k\rangle=5 $ , 即$ k_{{\rm{min}}}=2 $ ,$ k_{{\rm{max}}}=141 $ ,$ \gamma=2.3 $ 时, 弱依赖组平均规模分别为$ \langle M\rangle=5 $ 和$ \langle M\rangle=6 $ 的结果. 网络规模为$ N=10^5 $ . 图中实线表示由(12)式和(13)式得到的理论预测. 垂直虚线分别表示预测的一阶和二阶渗流相变点Figure 7. Simulation results for percolation transitions on scale-free network with average group sizes
$ \langle M\rangle=5 $ and$ \langle M\rangle=6 $ : (a), (b) Results for scale-free networks with average group sizes$ \langle M\rangle=5 $ and$ \langle M\rangle=6 $ respectively, where the average degree$ \langle k\rangle $ is 4 with$ k_{{\rm{min}}}=2 $ ,$ k_{{\rm{max}}}=63 $ and$ \gamma=2.5 $ ; (c), (d) results for scale-free networks with$ \langle M\rangle=5 $ and$ \langle M\rangle=6 $ respectively, where$ \langle k\rangle $ is 5 with$k_{{\rm{min}}}=2$ ,$k_{{\rm{max}}}=141$ and$ \gamma=2.3 $ . The network size is$ N=10^5 $ . The solid lines behind the symbols denote the theoretical predictions by Eqs.(12) and (13), and the vertical dashed lines denote the first-order and second-order percolation transition points predicted by theory. The simulation results were averaged from$ 100 $ realizations of different initial conditions.图 8 随机网络和无标度网络在弱依赖组规模服从泊松分布时渗流相变点
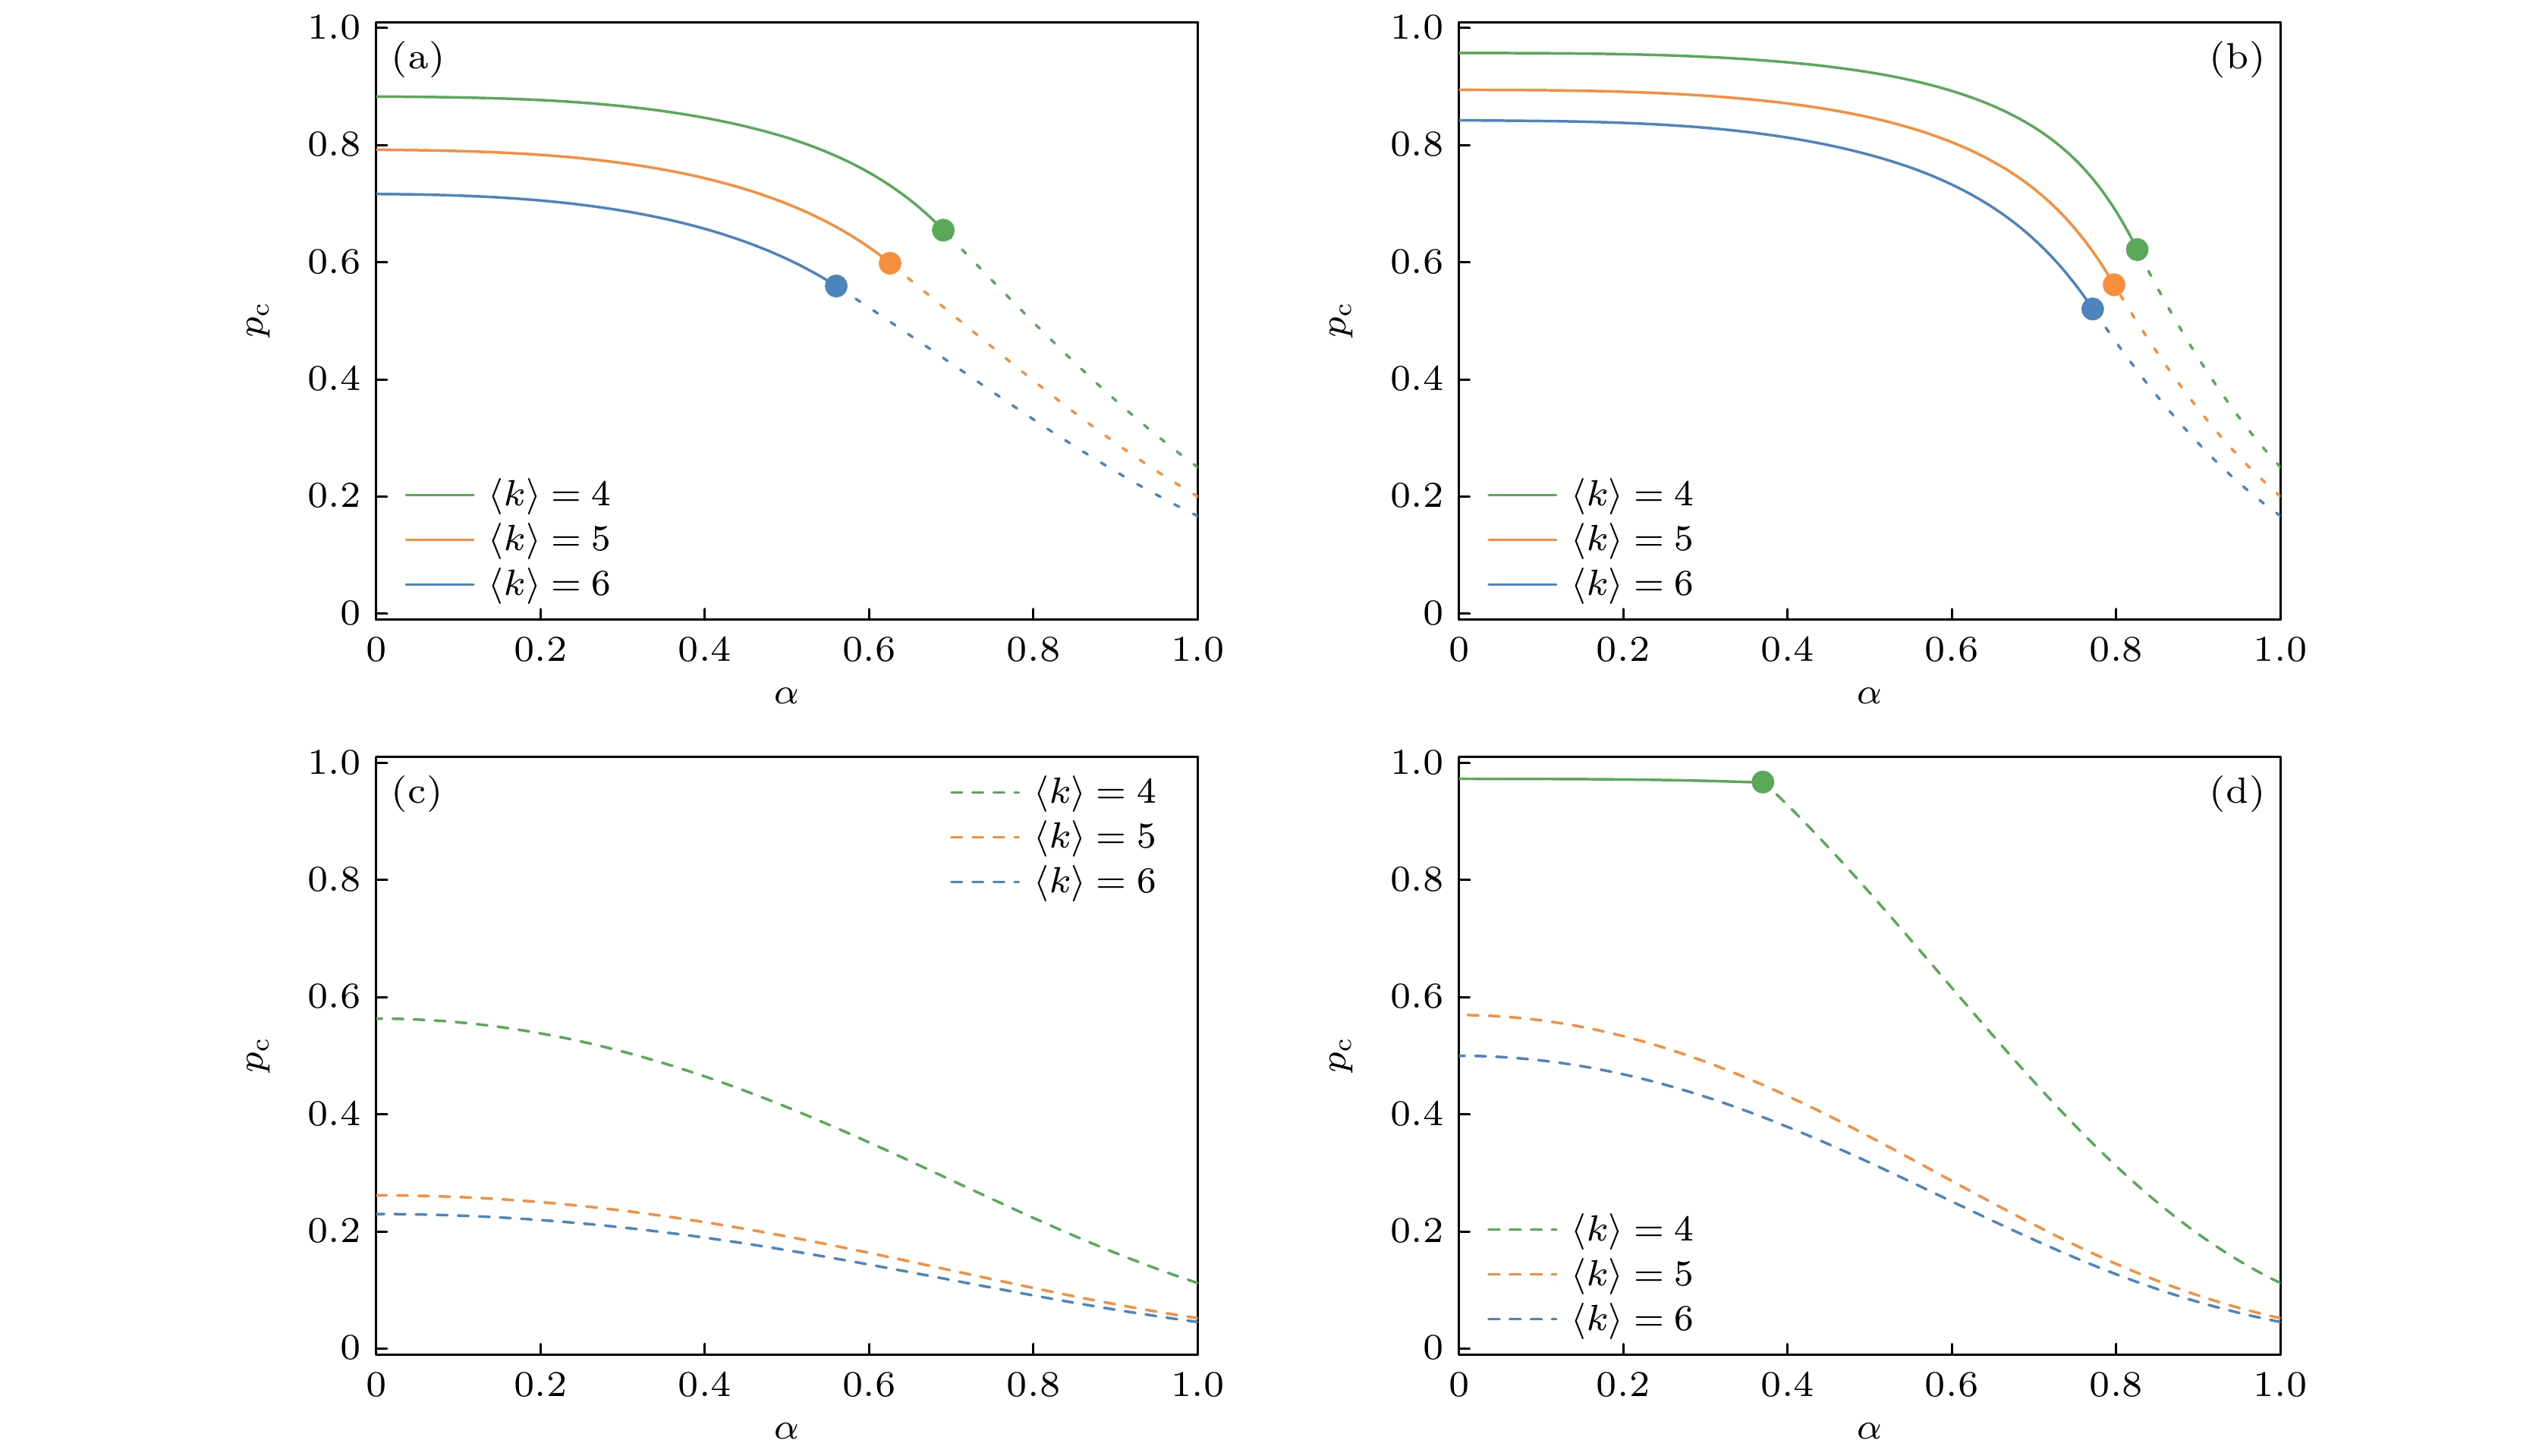
$p_{\rm{c}}$ 与α的关系 (a)$ \langle M\rangle=3 $ 的随机网络的渗流相变点$p_{\rm{c}}$ ($p_c^{\rm{I}}$ 或$ p_{\rm{c}}^{{\rm{II}}} $ )与α的关系, 其中平均度$ \langle k\rangle $ 分别为4, 5和6; (b)$ \langle M\rangle=4 $ 的随机网络的结果; (c)平均度$ \langle k\rangle $ 分别为4, 5和6 (度分布的幂指数$ \gamma $ 分别为2.5, 2.3和2.1)且$ \langle M\rangle=3 $ 的无标度网络的结果; (d)$ \langle M\rangle=4 $ 的无标度网络的结果.图中实线为一阶渗流相变点$ p_c^{\rm{I}} $ , 虚线为二阶渗流相变点$ p_c^{{\rm{II}}} $ Figure 8. The percolation transition point
$ p_{\rm{c}} $ as functions of α on random networks and scale-free networks when the interdependency groups size follows poisson distribution: (a) Results for random networks with the average interdependency group size$ \langle M\rangle=3 $ , where the average degree$ \langle k\rangle $ is$ 4 $ ,$ 5 $ and$ 6 $ from high to low; (b) the same results to panel (a) but for$ \langle M\rangle=4 $ ; (c) results for scale-free networks with the average interdependency group size$ \langle M\rangle=3 $ , where the average degree$ \langle k\rangle $ is 4, 5 and 6 from high to low (corresponding to a power-law exponent of degree distribution 2.5, 2.3 and 2.1, respectively);(d) the same results to panel (c) but for$ \langle M\rangle=4 $ . The solid line is the first-order percolation transition point$ p_{\rm{c}}^{\rm{I}} $ , and the dashed line is the second-order percolation transition point$ p_{\rm{c}}^{{\rm{II}}} $ -
[1] Du W B, Zhou X L, Lordan O, Wang Z, Zhao C, Zhu Y B 2016 Transp. Res. Pt. e-Logist. Transp. Rev. 89 108
 Google Scholar
[2] Tan F, Wu J, Xia Y, Chi K T 2014 Phys. Rev. E 89 062813
 Google Scholar
[3] Liu R R, Jia C X, Lai Y C 2019 New J. Phys. 21 045002
 Google Scholar
[4] Zhang L, Zeng G, Li D, Huang H-J, Stanley H E, Havlin S 2019 Proc. Natl. Acad. Sci. U.S.A. 116 8673
 Google Scholar
[5] Ouyang M 2014 Reliab. Eng. Syst. Saf. 121 43
 Google Scholar
[6] Newman M E, Watts D J, Strogatz S H 2002 Proc. Natl. Acad. Sci. U.S.A. 99 2566
 Google Scholar
[7] Pastor-Satorras R, Castellano C, Van Mieghem P, Vespignani A 2015 Rev. Mod. Phys. 87 925
 Google Scholar
[8] Zhao D, Wang L, Li S, Wang Z, Wang L, Gao B 2014 PLoS One 9 e112018
 Google Scholar
[9] Zhao H 2004 Neural Networks 17 47
 Google Scholar
[10] Liu X, Maiorino E, Halu A, Glass K, Prasad R B, Loscalzo J, Gao J, Sharma A 2020 Nat. Commun. 11 1
 Google Scholar
[11] Shim P-S, Lee H K, Noh J D 2012 Phys. Rev. E 86 031113
 Google Scholar
[12] Cho Y, Lee J, Herrmann H, Kahng B 2016 Phys. Rev. Lett. 116 025701
 Google Scholar
[13] Hoppe K, Rodgers G J 2014 Phys. Rev. E 90 012815
 Google Scholar
[14] Hackett A, Gleeson J P 2013 Phys. Rev. E 87 062801
 Google Scholar
[15] Callaway D S, Newman M E, Strogatz S H, Watts D J 2000 Phys. Rev. Lett. 85 5468
 Google Scholar
[16] Albert R, Jeong H, Barabási A L 2000 Nature 406 378
 Google Scholar
[17] Cohen R, Erez K, Ben-Avraham D, Havlin S 2000 Phys. Rev. Lett. 85 4626
[18] Liu J G, Wang Z T, Dang Y Z 2005 Mod. Phys. Lett. B 19 785
 Google Scholar
[19] Watts D J, Strogatz S H 1998 Nature 393 440
 Google Scholar
[20] Albert R, Barabási A L 2002 Rev. Mod. Phys. 74 47
 Google Scholar
[21] Crucitti P, Latora V, Marchiori M 2004 Phys. Rev. E 69 045104
[22] Moreno Y, Pastor-Satorras R, Vázquez A, Vespignani A 2003 EPL 62 292
 Google Scholar
[23] Zhao L, Park K, Lai Y C, Ye N 2005 Phys. Rev. E 72 025104
 Google Scholar
[24] Wang W X, Lai Y C 2009 Phys. Rev. E 80 036109
 Google Scholar
[25] Wang J, Rong L, Zhang L 2009 Mod. Phys. Lett. B 23 1323
 Google Scholar
[26] Wu X, Gu R, Ji Y, Stanley H E 2019 Phys. Rev. E 100 022309
[27] Motter A E, Lai Y C 2002 Phys. Rev. E 66 065102
 Google Scholar
[28] Lehmann J, Bernasconi J 2010 Phys. Rev. E 81 031129
 Google Scholar
[29] Wang W X, Chen G 2008 Phys. Rev. E 77 026101
[30] Yang R, Wang W X, Lai Y C, Chen G 2009 Phys. Rev. E 79 026112
 Google Scholar
[31] Zhang S P, Huang Z G, Dong J Q, Eisenberg D, Seager T P, Lai Y C 2015 New J. Phys. 17 063029
 Google Scholar
[32] Wang, J W 2012 Nonlinear Dyn. 70 1959
 Google Scholar
[33] Motter A E 2004 Phys. Rev. Lett. 93 098701
 Google Scholar
[34] Simonsen I, Buzna L, Peters K, Bornholdt S, Helbing D 2008 Phys. Rev. Lett. 100 218701
 Google Scholar
[35] Xia Y, Fan J, Hill D 2010 Physica A 389 1281
 Google Scholar
[36] Watts D J 2002 Proc. Natl. Acad. Sci. U.S.A. 99 5766
 Google Scholar
[37] Gleeson J P, Cahalane D J 2007 Phys. Rev. E 75 056103
 Google Scholar
[38] Dorogovtsev S N, Goltsev A V, Mendes J F F 2006 Phys. Rev. Lett. 96 040601
 Google Scholar
[39] Baxter G J, Dorogovtsev S N, Goltsev A V, Mendes J F 2010 Phys. Rev. E 82 011103
 Google Scholar
[40] Parshani R, Buldyrev S V, Havlin S 2011 Proc. Natl. Acad. Sci. U.S.A. 108 1007
 Google Scholar
[41] Bashan A, Parshani R, Havlin S 2011 Phys. Rev. E 83 051127
 Google Scholar
[42] Wang Z, Zhou D, Hu Y 2018 Phys. Rev. E 97 032306
[43] Niu D, Yuan X, Du M, Stanley H Eugene, Hu Y 2016 Phys. Rev. E 93 042312
[44] Wang H, Li M, Deng L, Wang B H 2018 Physica A 502 195
 Google Scholar
[45] Wang H, Li M, Deng L, Wang B H 2015 PLoS One 10 e0126674
 Google Scholar
[46] Li M, Wang B H 2014 Chin. Phys. B 23 076402
 Google Scholar
[47] Chen M, Song M, Zhang M, Jin L, Gong X 2019 Int. J. Mod. Phys. C 30 1950043
 Google Scholar
[48] Li M, Liu R R, Lyu L, Hu M B, Xu S, Zhang Y C 2021 Phys. Rep. 907 1
 Google Scholar
[49] Cao Y Y, Liu R R, Jia C X, Wang B H 2021 Commun. Nonlinear Sci. Numer. Simul. 92 105492
 Google Scholar
[50] Liu R R, Eisenberg D A, Seager T P, Lai Y C 2018 Sci. Rep. 8 2111
 Google Scholar
[51] Kong L W, Li M, Liu R-R, Wang B H 2017 Phys. Rev. E 95 032301
[52] Wu J, Deng H Z, Tan Y J, Zhu D Z 2007 J. Phys. A-Math. Theor. 40 2665
 Google Scholar
[53] Cohen R, Havlin S 2010 Complex Networks: Dtructure, Tobustness and Function (Cambridge: Cambridge University Press) p31
[54] Son S W, Bizhani G, Christensen C, Grassberger P, Paczuski M 2012 EPL 97 16006
 Google Scholar
[55] Feng L, Monterola C P, Hu Y 2015 New J. Phys. 17 063025
 Google Scholar
[56] Jiang W J, Liu R R, Jia C X 2020 Complexity 2020 3578736
Catalog
Metrics
- Abstract views: 6655
- PDF Downloads: 126
- Cited By: 0


 DownLoad:


