-
The robustness of complex networks plays an important role in human society. By further observing the networks on our planet, researchers find that many real systems are interdependent. For example, power networks rely on the Internet to transfer operation information, predators have to hunt for herbivores to refuel themselves, etc. Previous theoretical studies indicate that removing a small fraction of nodes in interdependent networks leads to a thorough disruption of the interdependent networks. However, due to the heterogeneous weak inter-layer links, interdependent networks in real world are not so fragile as the theoretical predictions. For example, an electronic components factory needs raw materials which are produced by a chemical factory. When the chemical factory collapses, the electronic components factory will suffer substantial drop in the production, however, it can still survive because it can produce some other raw materials by itself to sustain its production of some products. What is more, because of the heterogeneity on real industry chains, different electronic components factories produce different kinds of products, which still guarantees the diversity of electronic goods on the whole. In this paper, we develop a framework to help understand the robustness of interdependent networks with heterogeneous weak inter-layer links. More specifically, in the beginning, a fraction of 1–p nodes are removed from network A and their dependency nodes in network B are removed simultaneously, then the percolation process begins. Each connectivity link of a node with weak inter-layer dependency is removed with a probability γ after the failure of its counterpart node. The γ values for different nodes are various because of heterogeneity. At the end, the nodes can survive as long as one of the remaining connectivity links reaches the giant component. We present an analytical solution for solving the giant component size and analyzing the crossing point of the phase transition of arbitrary interdependent random networks. For homogeneous symmetric Erdös-Rényi networks, we solve the continuous transition point and the critical point of γ. The simulation results are in good agreement with our exact solutions. Furthermore, we introduce two kinds of γ distributions to analyze the influence of heterogeneous weak inter-layer links on the robustness of interdependent networks. The results of both distributions show that with the increase of heterogeneity, the transition point pc decreases and the networks become more robust. For the first simple γ distribution, we also find the percolation transition changes from discontinuous one to continuous one by improving the heterogeneity. For the second Gaussian γ distribution, a higher variance makes the interdependent networks more difficult to collapse. Our work explains the robustness of real world interdependent networks from a new perspective, and offers a useful strategy to enhance the robustness by increasing the heterogeneity of weak inter-layer links of interdependent networks.
-
Keywords:
- interdependent networks /
- cascading failures /
- percolation /
- phase transition
[1] Albert R, Barabási A 2002 Rev. Mod. Phys. 74 47
 Google Scholar
[2] Dorogovtsev S N, Goltsev A V, Mendes J F 2008 Rev. Mod. Phys. 80 1275
 Google Scholar
[3] Boccaletti S, Bianconi G, Criado R, Del Genio C I, Gómez-Gardenes J, Romance M, Sendina-Nadal I, Wang Z, Zanin M 2014 Phys. Rep. 544 1
 Google Scholar
[4] Buldyrev S V, Parshani R, Paul G, Stanley H E, Havlin S 2010 Nature 464 1025
 Google Scholar
[5] Shao J, Buldyrev S V, Havlin S, Stanley H E 2011 Phys. Rev. E 83 36116
 Google Scholar
[6] Gao J X, Buldyrev S V, Havlin S, Stanley H E 2011 Phys. Rev. Lett. 107 195701
 Google Scholar
[7] Albert R, Jeong H, Barabási A 2000 Nature 406 378
 Google Scholar
[8] Cohen R, Erez K, Ben-Avraham D, Havlin S 2000 Phys. Rev. Lett. 85 4626
 Google Scholar
[9] Callaway D S, Newman M E, Strogatz S H, Watts D J 2000 Phys. Rev. Lett. 85 5468
 Google Scholar
[10] Li M, Wang B H 2014 Chin. Phys. B 23 076402
[11] Shang Y, Luo W, Xu S 2011 Phys. Rev. E 84 31113
 Google Scholar
[12] Baxter G J, Dorogovtsev S N, Goltsev A V, Mendes J F 2011 Phys. Rev. E 83 51134
 Google Scholar
[13] Gao J, Zhou T, Hu Y 2015 Sci. Rep. 5 14662
 Google Scholar
[14] Azimi-Tafreshi N, Gómez-Gardenes J, Dorogovtsev S N 2014 Phys. Rev. E 90 32816
 Google Scholar
[15] Yuan X, Dai Y, Stanley H E, Havlin S 2016 Phys. Rev. E 93 062302
[16] Parshani R, Buldyrev S V, Havlin S 2011 Proc. Natl. Acad. Sci. U.S.A. 108 1007
 Google Scholar
[17] Wang Z, Zhou D, Hu Y 2018 Phys. Rev. E 97 032306
[18] Wang H, Li M, Deng L, Wang B H 2018 Physica A 502 195
 Google Scholar
[19] Parshani R, Buldyrev S V, Havlin S 2010 Phys. Rev. Lett. 105 48701
 Google Scholar
[20] Zhou D, Gao J X, Stanley H E, Havlin S 2013 Phys. Rev. E 87 52812
 Google Scholar
[21] Dong G, Gao J X, Tian L, Du R, He Y 2012 Phys. Rev. E 85 16112
 Google Scholar
[22] Liu R R, Li M, Jia C X 2016 Sci. Rep. 6 35352
 Google Scholar
[23] Kong L, Li M, Liu R R, Wang B H 2017 Phys. Rev. E 95 032301
[24] Newman M E, Strogatz S H, Watts D J 2001 Phys. Rev. E 64 26118
 Google Scholar
[25] Erdős P, Rényi A 1959 Publ. Math. 62 90
[26] Barabási A, Albert R 1999 Science 286 509
 Google Scholar
-
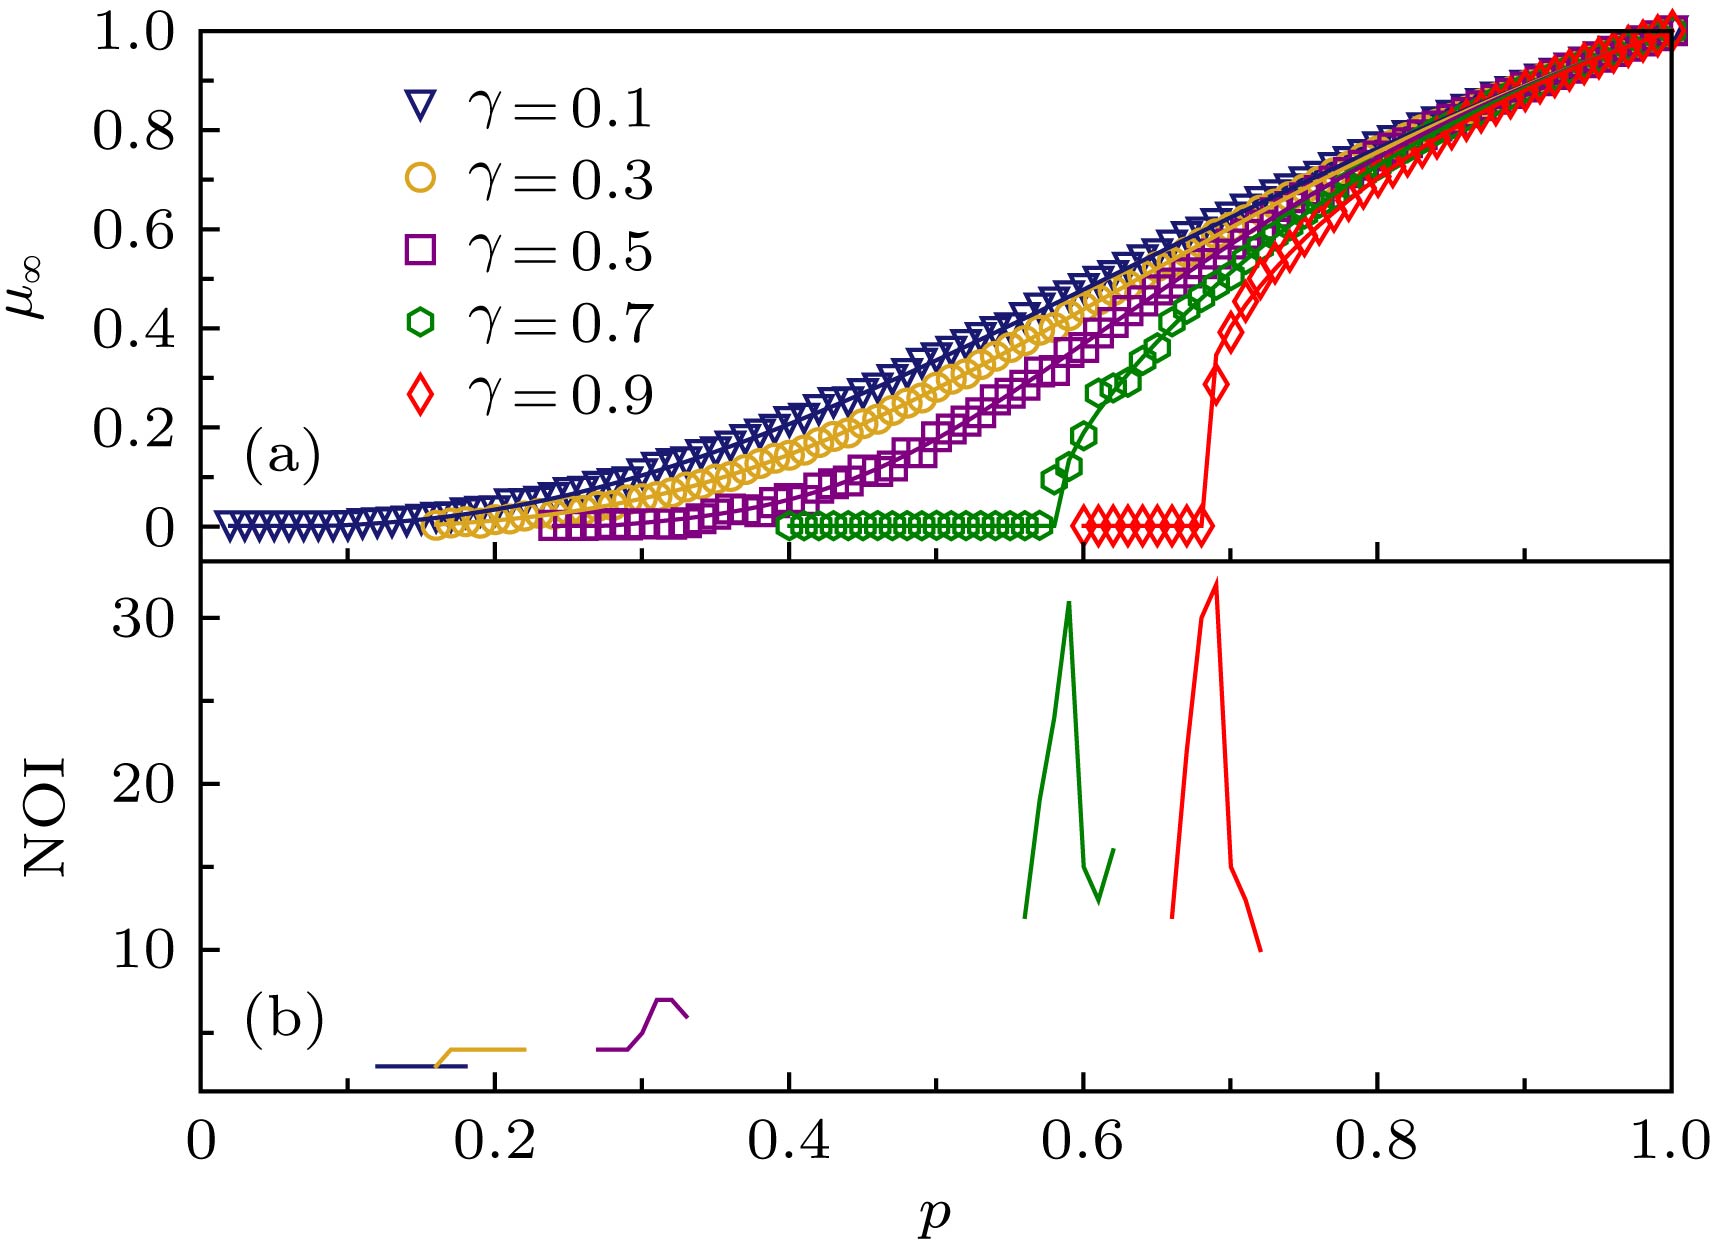
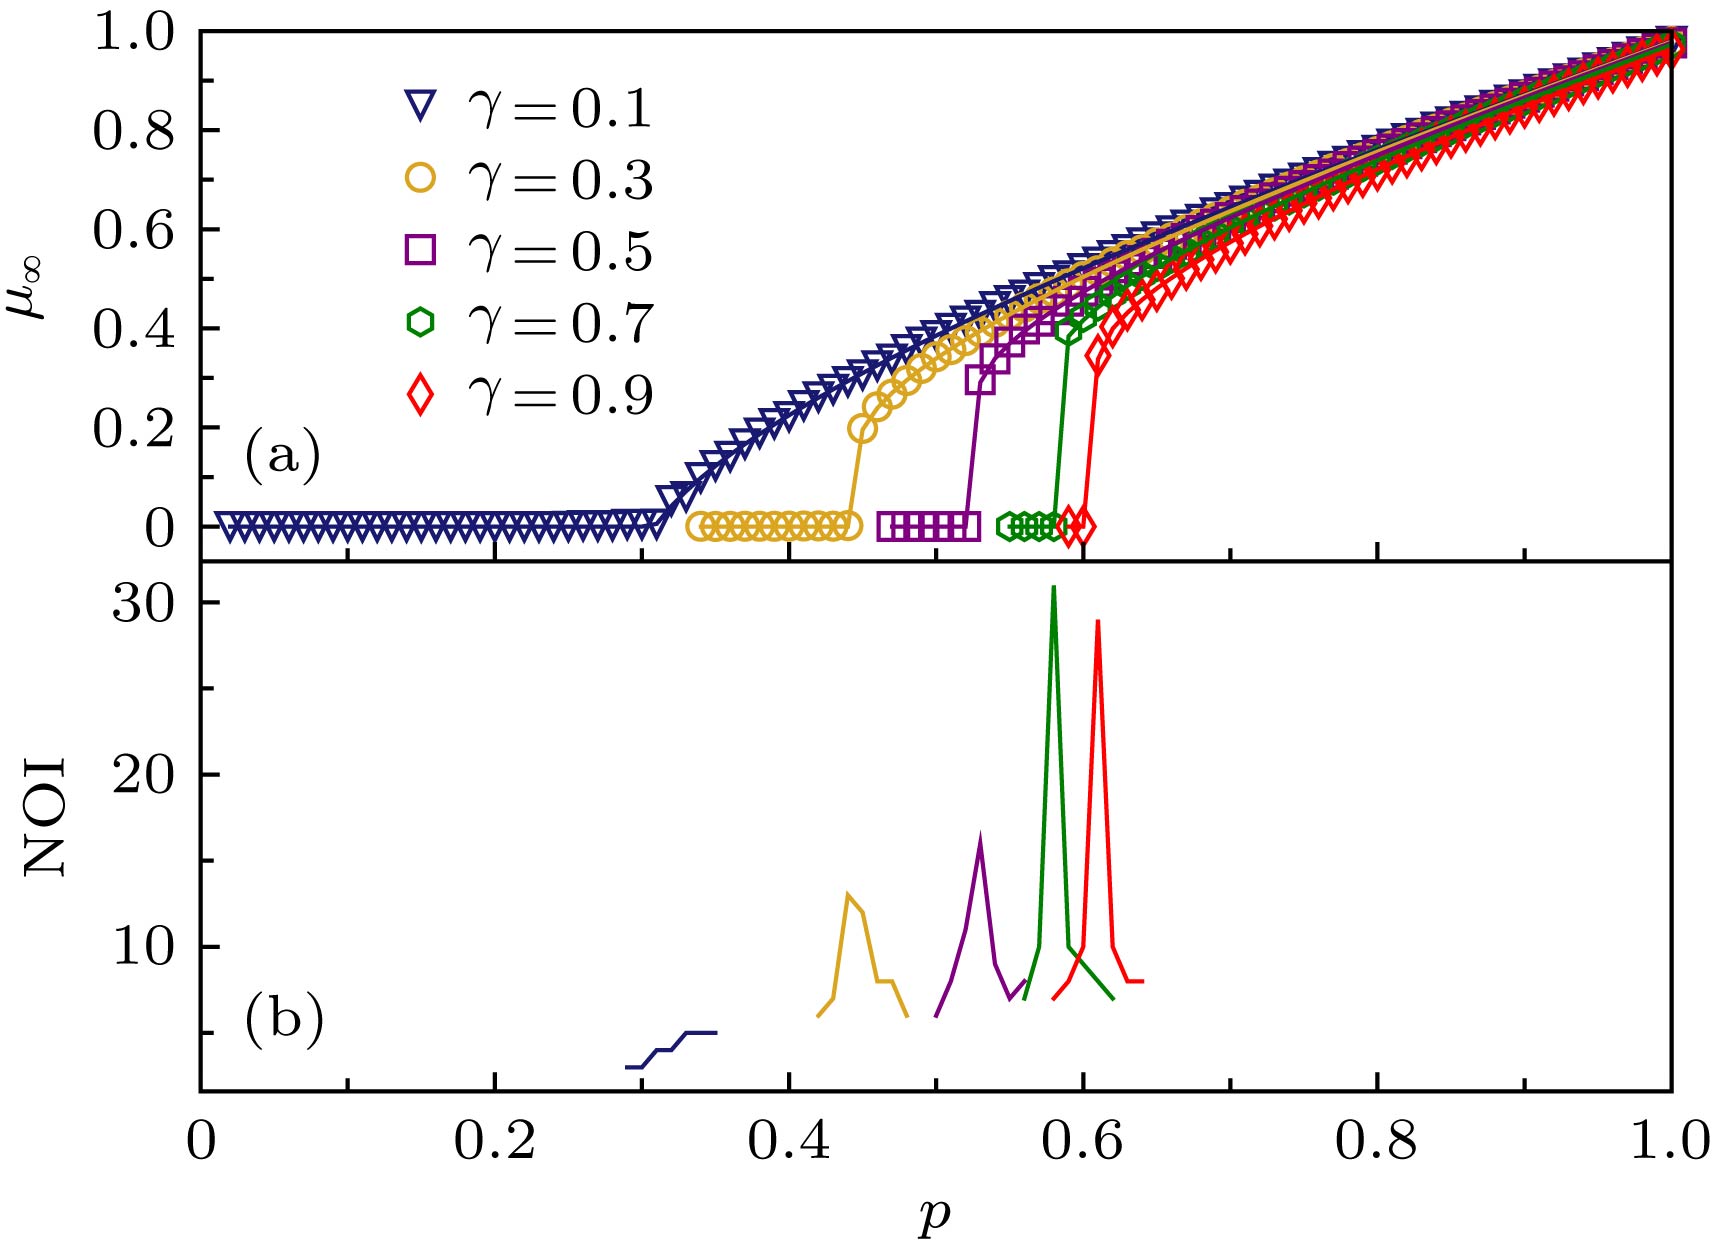
图 1 同质对称ER弱相依网络对于不同γ值的巨分量
${\mu _\infty }$ 与p对应关系(网络节点数为200000, 平均度为4) (a) 巨分量大小${\mu _\infty }$ 与p对应关系, 空心标记表示仿真结果, 实线是根据(17)和(18)式得到的理论值; (b) 级联失效迭代次数Figure 1. Simulation results of
${\mu _\infty }$ versus p for homogeneous symmetric interdependent ER networks for different γ (each network has 200000 nodes, average degree is 4). (a) The size of the giant component${\mu _\infty }$ versus p. The symbols represent the simulation results, and the solid lines show the corresponding analytical predictions of Eqs. (17) and (18). (b) Number of iterative failures.图 2 同质对称SF弱相依网络对于不同
$\gamma $ 的巨分量${\mu _\infty }$ 与p对应关系(网络节点数为20000, 平均度为4,$\lambda = 2.6$ ) (a) 巨分量大小${\mu _\infty }$ 与p对应关系, 空心标记表示仿真结果, 实线是根据(17)式和(18)式得到的理论值; (b) 级联失效迭代次数Figure 2. Simulation results of
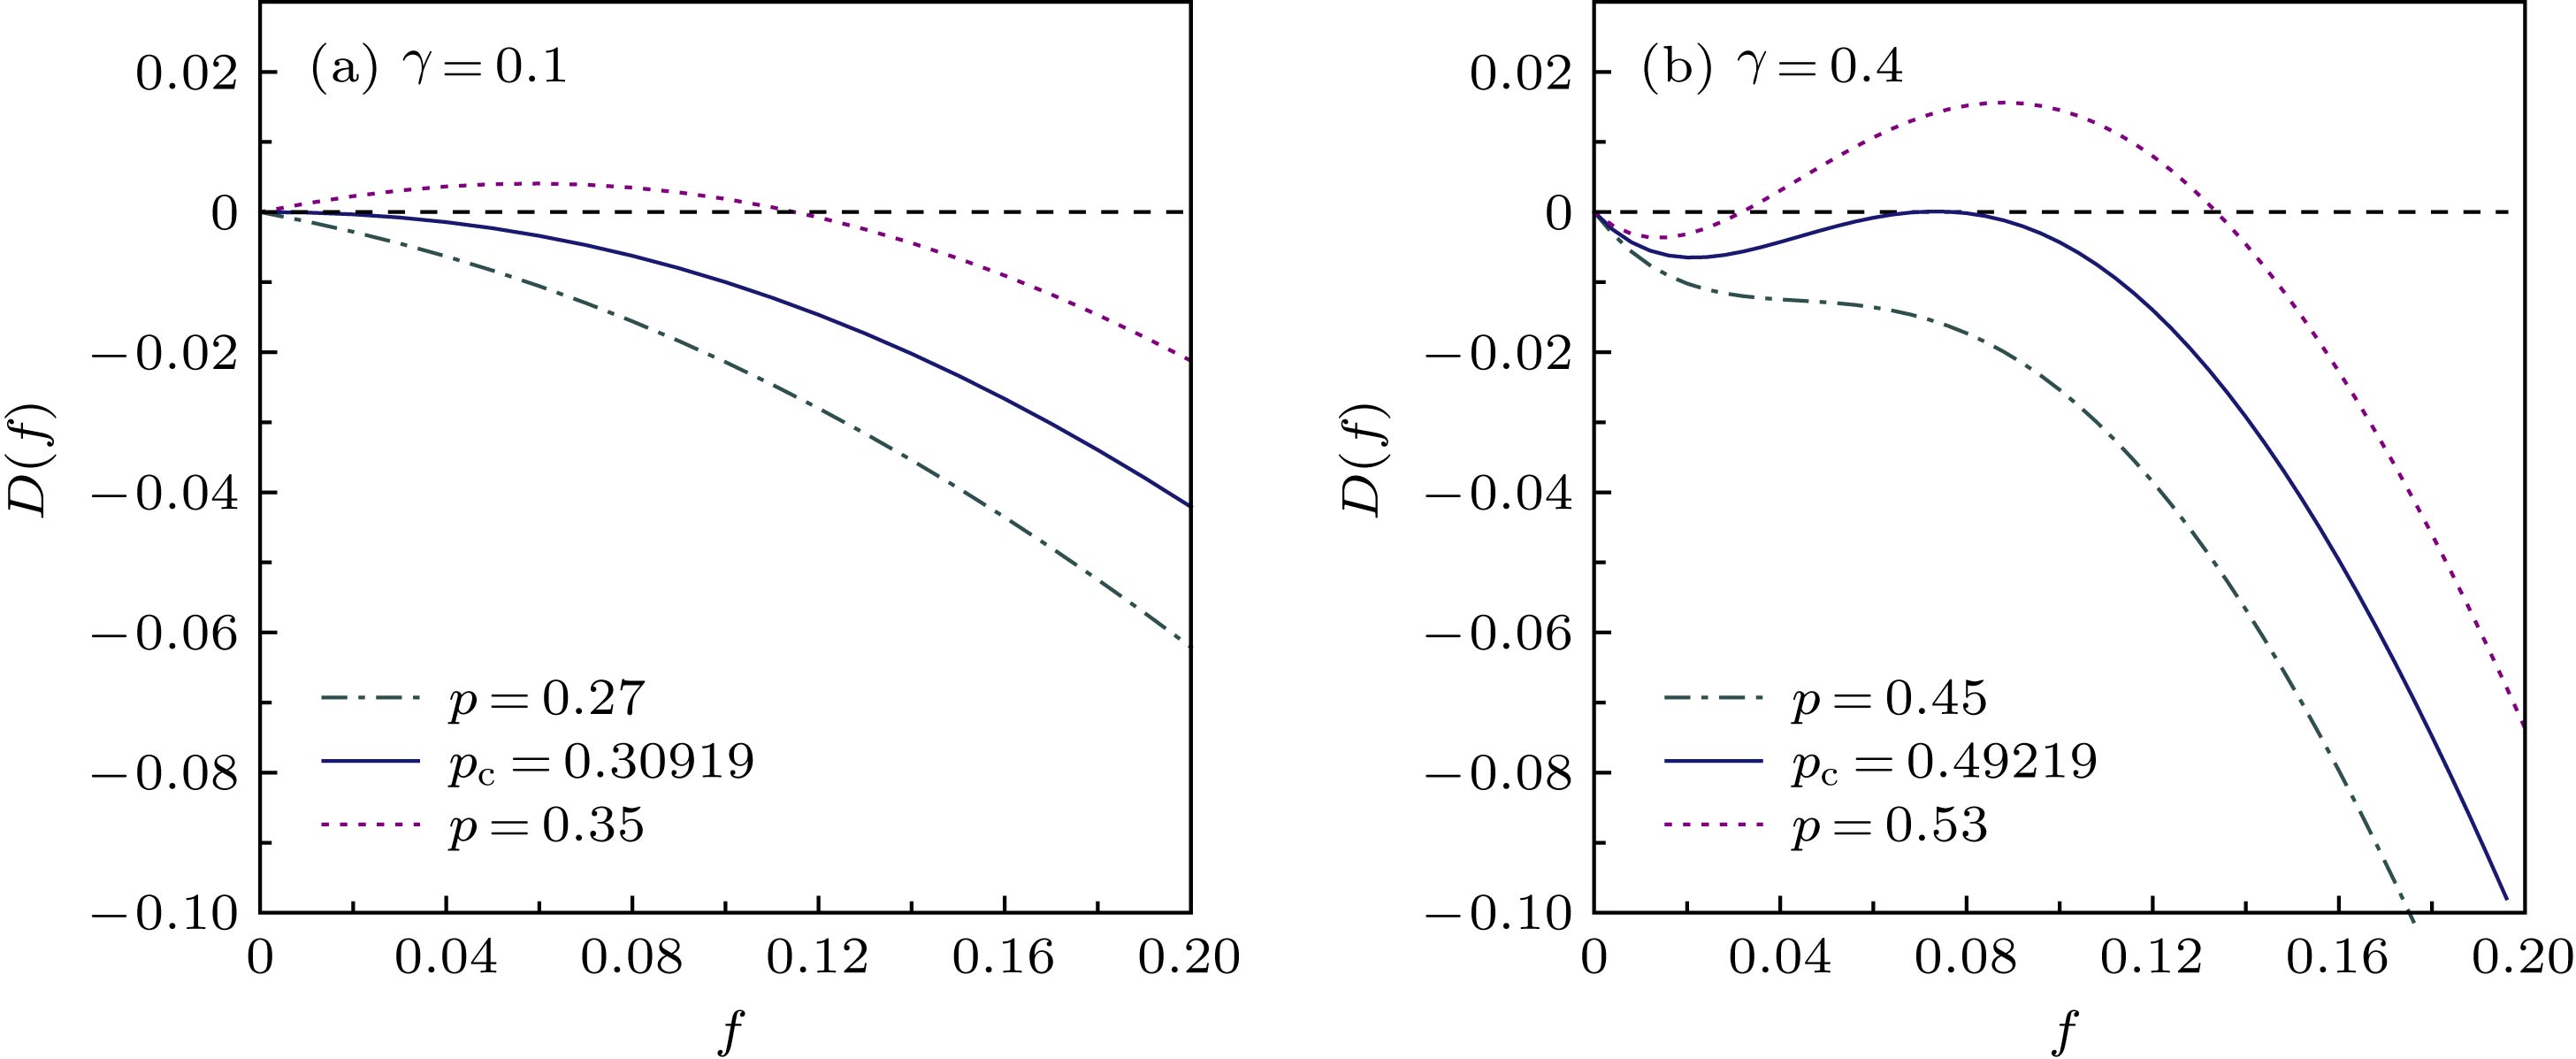
${\mu _\infty }$ versus p for homogeneous symmetric interdependent SF networks for different γ (each network has 200000 nodes, average degree is 4,$\lambda = 2.6$ ). (a) The size of the giant component${\mu _\infty }$ versus p. The symbols represent the simulation results, and the solid lines show the corresponding analytical predictions of Eqs. (17) and (18). (b) Number of iterative failures.图 3 同质对称ER弱相依网络对于不同γ值的数值解示意图(网络平均度为4; 在相变点pc处,
$D(f)$ 曲线与f轴相切) (a) γ = 0.1; (b) γ = 0.4Figure 3. Graphical solutions of homogeneous symmetric interdependent ER networks percolation transition for different γ: (a) γ = 0.1; (b) γ = 0.4. The average degree is 4. At the transition point pc, the curve of D(f) tangents to f axis.
图 4 同质对称SF弱相依网络对于不同γ值的数值解示意图(网络平均度为4,
$\lambda = 2.6$ ; 在相变点pc处,$D(f)$ 曲线与f轴相切) (a) γ = 0.5; (b) γ = 0.9Figure 4. Graphical solutions of homogeneous symmetric interdependent SF networks percolation transition for different γ: (a) γ = 0.5; (b) γ = 0.9. The average degree is 4,
$\lambda = 2.6$ . At the transition point pc, the curve of D(f) tangents to f axis.图 5 不同平均度同质对称ER弱相依网络相变点pc与γ对应关系, 其中网络的节点数为200000; 空心标记为仿真结果; 理论值分别通过实线和短划线表示, 其中实线为连续相变, 短划线为非连续相变; 垂直的点状线为连续相变和非连续相变的边界
Figure 5. Simulation results of pc versus γ for homogeneous symmetric interdependent ER networks with different
$\left\langle k \right\rangle $ , each network has 200000 nodes. The symbols represent the simulation results. The corresponding analytical predictions are shown by lines, solid lines and dashed lines represent continuous and discontinuous phase transitions, respectively. The vertical dotted line is the boundary of continuous and discontinuous regions.图 6 不同简单γ分布的同质和异质ER弱相依网络的仿真结果, 其中网络节点数为200000, 平均度是4,
$q = 0.5$ ; 空心标记表示仿真结果, 实线是理论分析值Figure 6. Simulation results of heterogeneous and homogeneous symmetric ER interdependent networks with different γ distributions, each network has 200000 nodes, average degree is 4,
$q = 0.5$ . The symbols represent the simulation results, and the solid lines show the corresponding analytical predictions.图 7 简单γ分布异质对称ER弱相依网络相变点
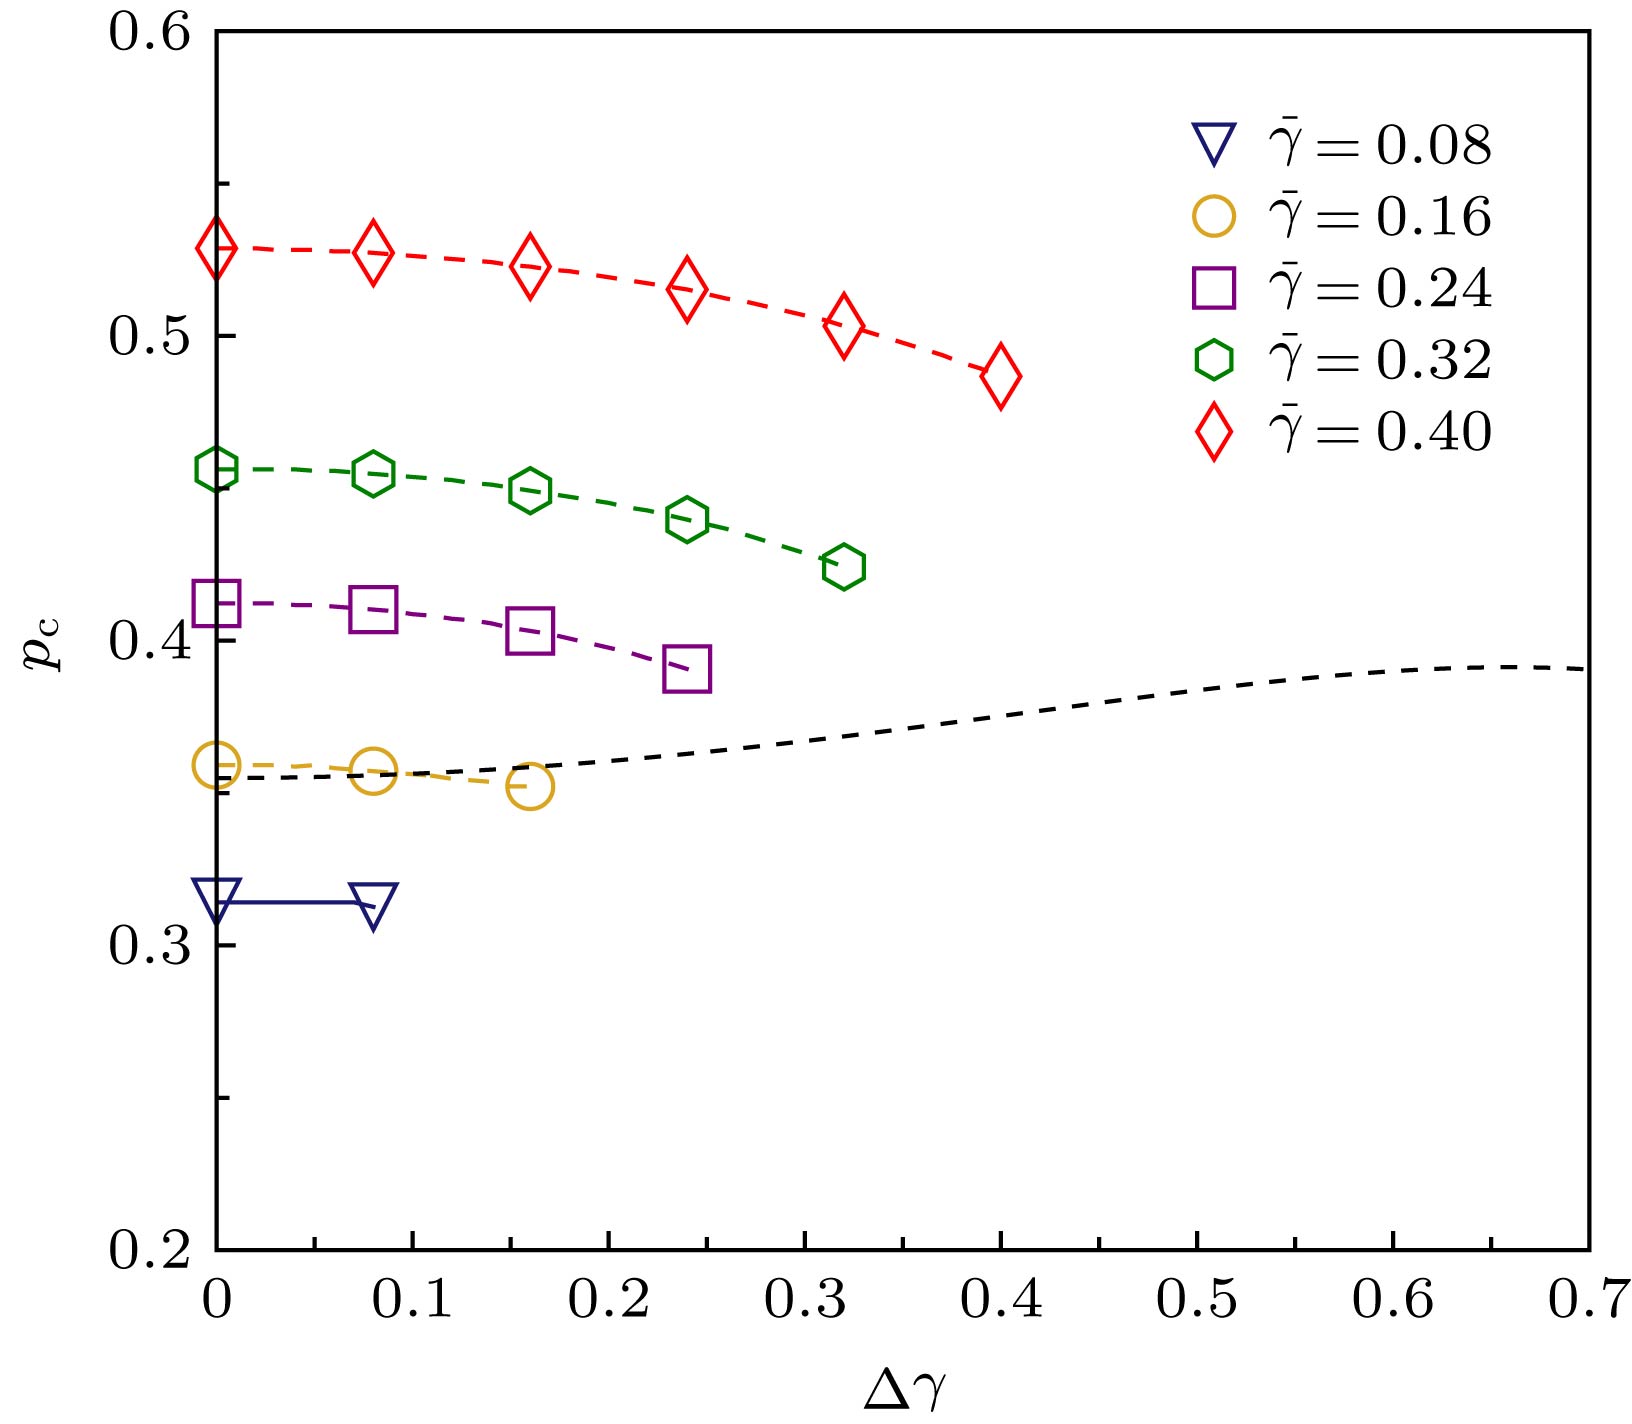
${p_{\rm{c}}}$ 与$\Delta \gamma $ 值的仿真结果, 其中网络节点数为200000, 平均度是4,$q = 0.5$ ; 空心标记表示仿真值, 短划线和实线分别表示非连续相变与连续相变的理论值, 点状线是连续相变和非连续相变的分界线Figure 7. Simulation results of critical point
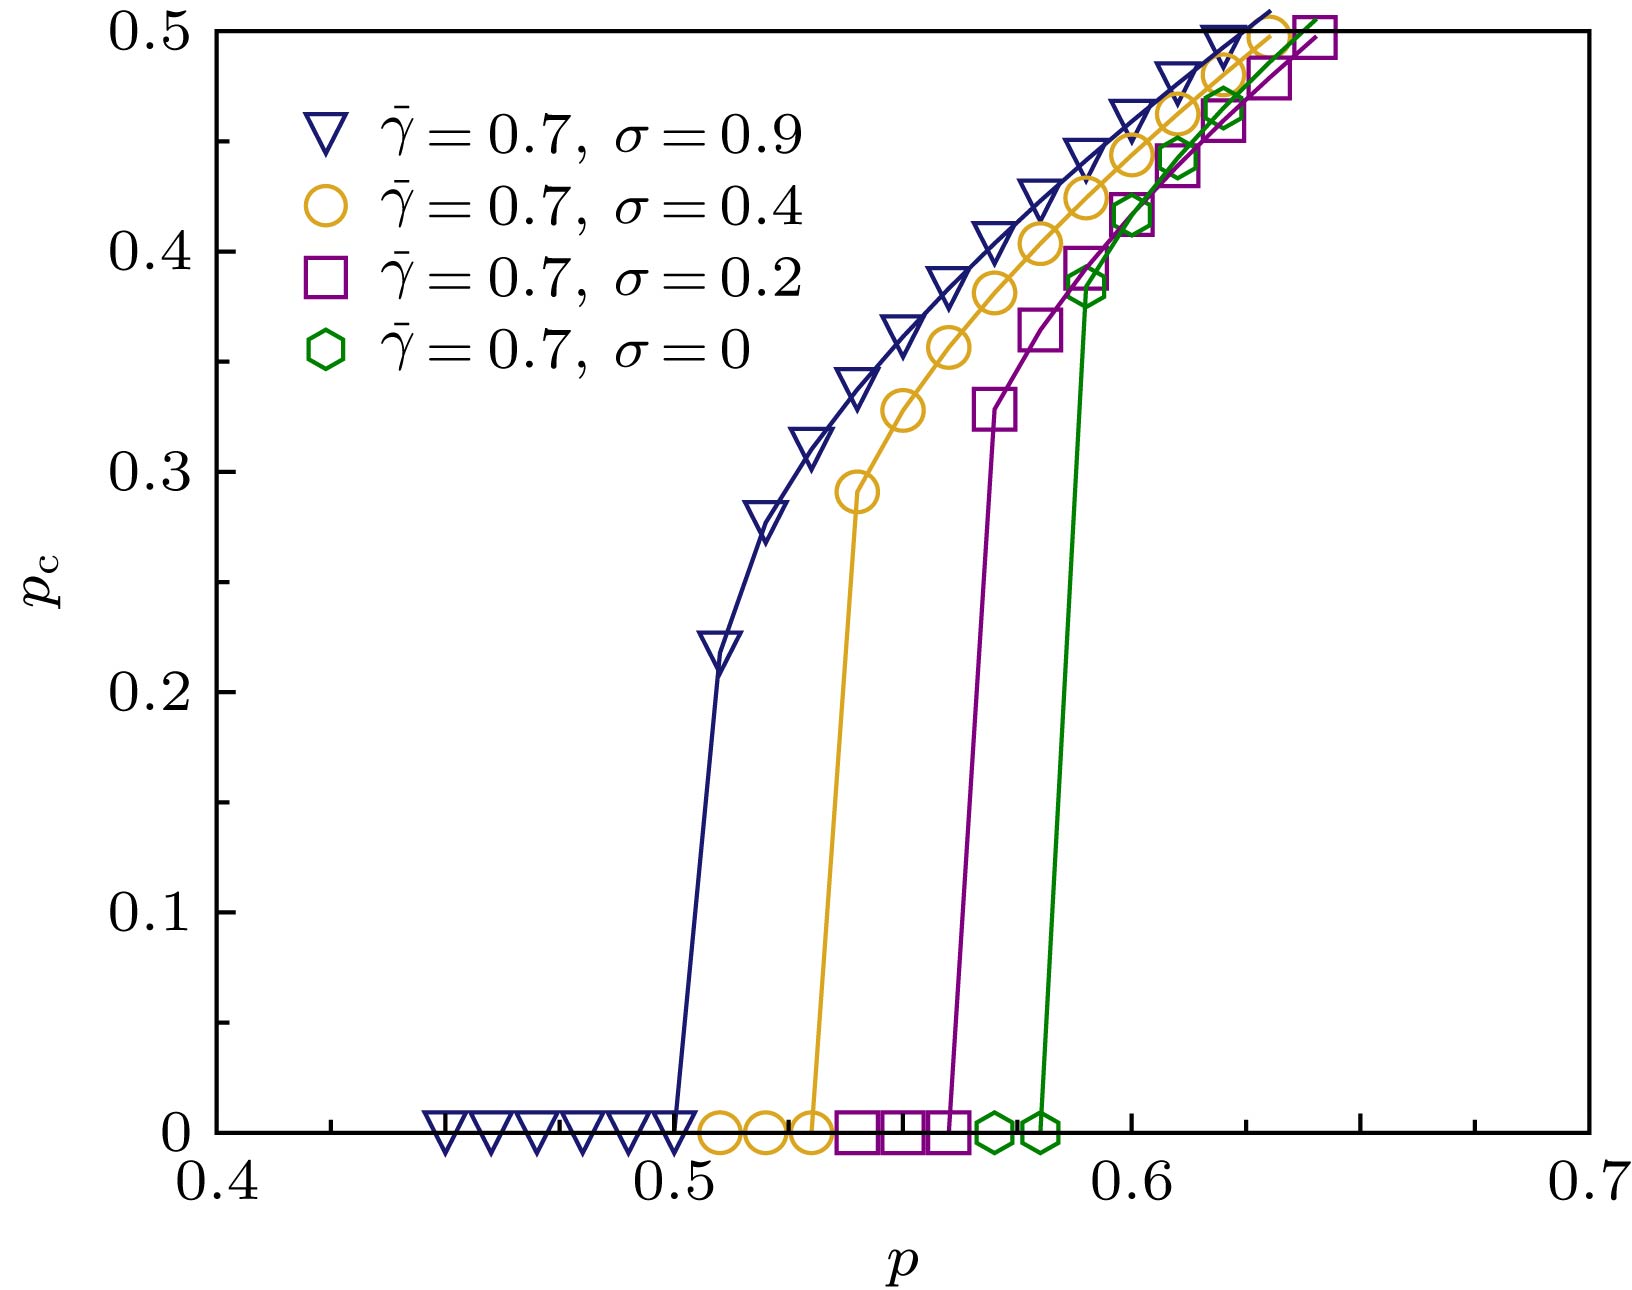
${p_{\rm{c}}}$ of simple heterogeneous symmetric ER interdependent networks versus$\Delta \gamma $ , each network has 200000 nodes, average degree is 4,$q = 0.5$ . The symbols represent the simulation results. The corresponding analytical predictions are shown by lines, solid lines and dashed lines represent continuous and discontinuous phase transitions, respectively. The dotted line is the boundary of continuous and discontinuous regions.图 8 连接边失效概率服从高斯分布的异质对称ER弱相依网络巨分量
${\mu _\infty }$ 与p的对应关系, 其中高斯分布的均值$\bar \gamma $ 为0.7,$\sigma $ 分别为0.9, 0.4, 0.2; 根据(25)式,$\sigma = 0$ 时$p(\gamma ) = \delta (\gamma - \bar \gamma )$ ; 空心标记为仿真结果, 实线为理论分析值Figure 8. Simulation results of
${\mu _\infty }$ versus p for heterogeneous symmetric ER interdependent networks with Gaussian distributions of connectivity link failure probability. The average value$\bar \gamma $ are set as 0.7,$\sigma $ are set as 0.9, 0.4, 0.2, respectively. According to Eq. (25),$p(\gamma ) = \delta (\gamma - \bar \gamma )$ when$\sigma = 0$ . The symbols represent the simulation results, and the solid lines show the corresponding analytical predictions. -
[1] Albert R, Barabási A 2002 Rev. Mod. Phys. 74 47
 Google Scholar
[2] Dorogovtsev S N, Goltsev A V, Mendes J F 2008 Rev. Mod. Phys. 80 1275
 Google Scholar
[3] Boccaletti S, Bianconi G, Criado R, Del Genio C I, Gómez-Gardenes J, Romance M, Sendina-Nadal I, Wang Z, Zanin M 2014 Phys. Rep. 544 1
 Google Scholar
[4] Buldyrev S V, Parshani R, Paul G, Stanley H E, Havlin S 2010 Nature 464 1025
 Google Scholar
[5] Shao J, Buldyrev S V, Havlin S, Stanley H E 2011 Phys. Rev. E 83 36116
 Google Scholar
[6] Gao J X, Buldyrev S V, Havlin S, Stanley H E 2011 Phys. Rev. Lett. 107 195701
 Google Scholar
[7] Albert R, Jeong H, Barabási A 2000 Nature 406 378
 Google Scholar
[8] Cohen R, Erez K, Ben-Avraham D, Havlin S 2000 Phys. Rev. Lett. 85 4626
 Google Scholar
[9] Callaway D S, Newman M E, Strogatz S H, Watts D J 2000 Phys. Rev. Lett. 85 5468
 Google Scholar
[10] Li M, Wang B H 2014 Chin. Phys. B 23 076402
[11] Shang Y, Luo W, Xu S 2011 Phys. Rev. E 84 31113
 Google Scholar
[12] Baxter G J, Dorogovtsev S N, Goltsev A V, Mendes J F 2011 Phys. Rev. E 83 51134
 Google Scholar
[13] Gao J, Zhou T, Hu Y 2015 Sci. Rep. 5 14662
 Google Scholar
[14] Azimi-Tafreshi N, Gómez-Gardenes J, Dorogovtsev S N 2014 Phys. Rev. E 90 32816
 Google Scholar
[15] Yuan X, Dai Y, Stanley H E, Havlin S 2016 Phys. Rev. E 93 062302
[16] Parshani R, Buldyrev S V, Havlin S 2011 Proc. Natl. Acad. Sci. U.S.A. 108 1007
 Google Scholar
[17] Wang Z, Zhou D, Hu Y 2018 Phys. Rev. E 97 032306
[18] Wang H, Li M, Deng L, Wang B H 2018 Physica A 502 195
 Google Scholar
[19] Parshani R, Buldyrev S V, Havlin S 2010 Phys. Rev. Lett. 105 48701
 Google Scholar
[20] Zhou D, Gao J X, Stanley H E, Havlin S 2013 Phys. Rev. E 87 52812
 Google Scholar
[21] Dong G, Gao J X, Tian L, Du R, He Y 2012 Phys. Rev. E 85 16112
 Google Scholar
[22] Liu R R, Li M, Jia C X 2016 Sci. Rep. 6 35352
 Google Scholar
[23] Kong L, Li M, Liu R R, Wang B H 2017 Phys. Rev. E 95 032301
[24] Newman M E, Strogatz S H, Watts D J 2001 Phys. Rev. E 64 26118
 Google Scholar
[25] Erdős P, Rényi A 1959 Publ. Math. 62 90
[26] Barabási A, Albert R 1999 Science 286 509
 Google Scholar
Catalog
Metrics
- Abstract views: 10919
- PDF Downloads: 106
- Cited By: 0




 DownLoad:
