-
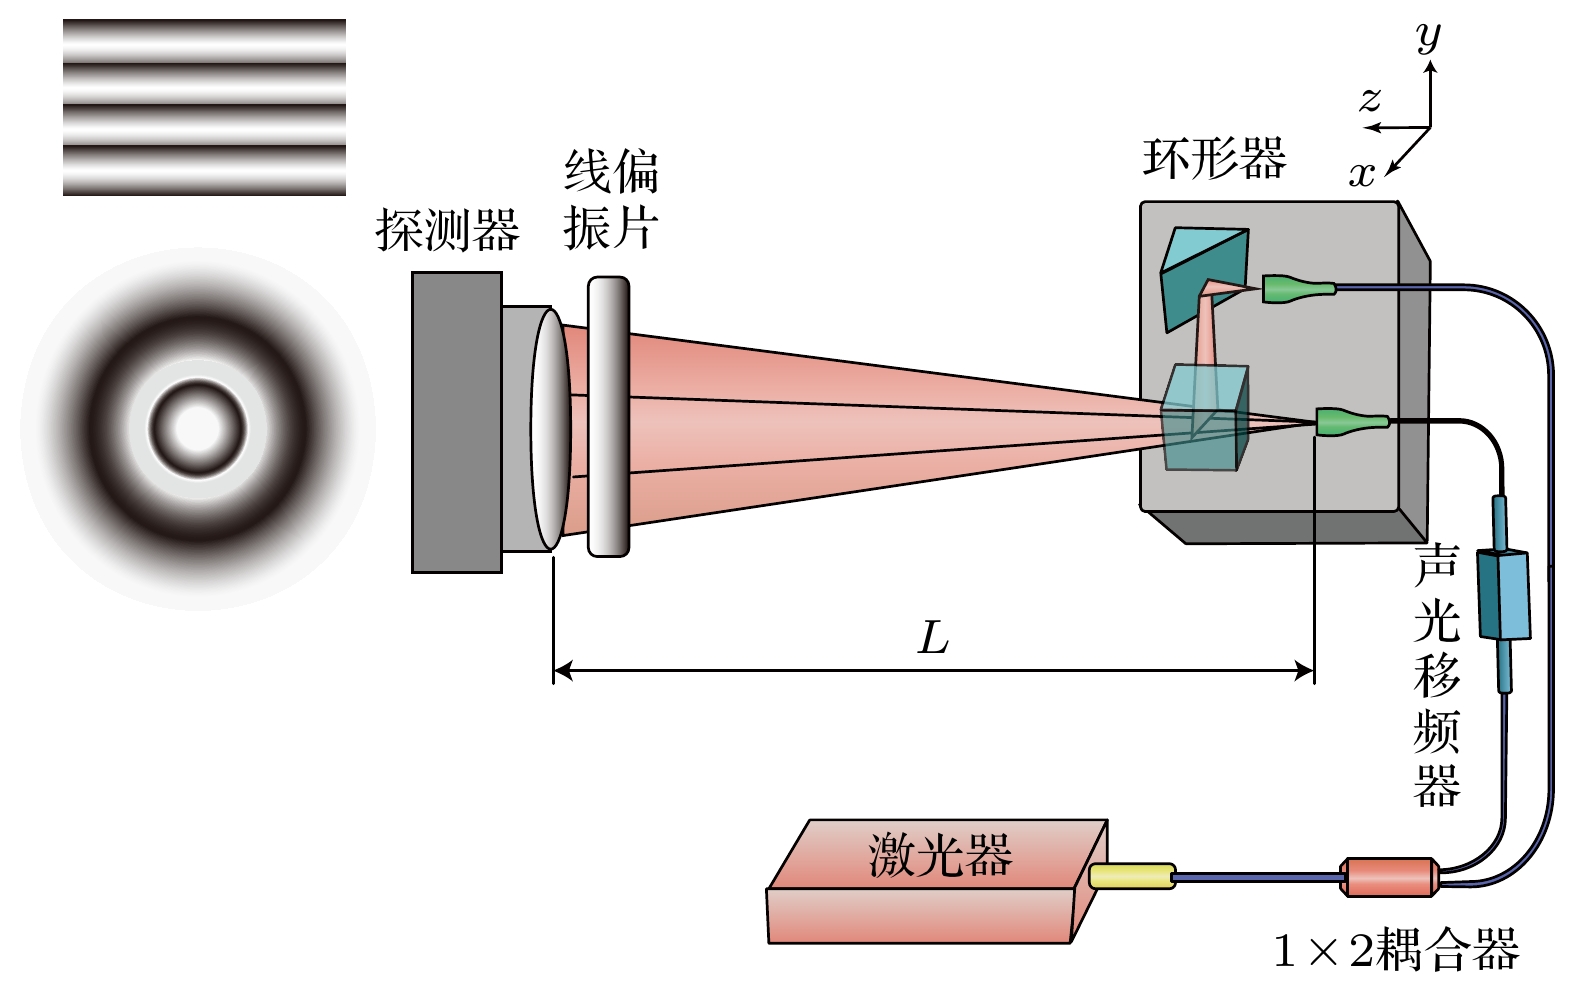
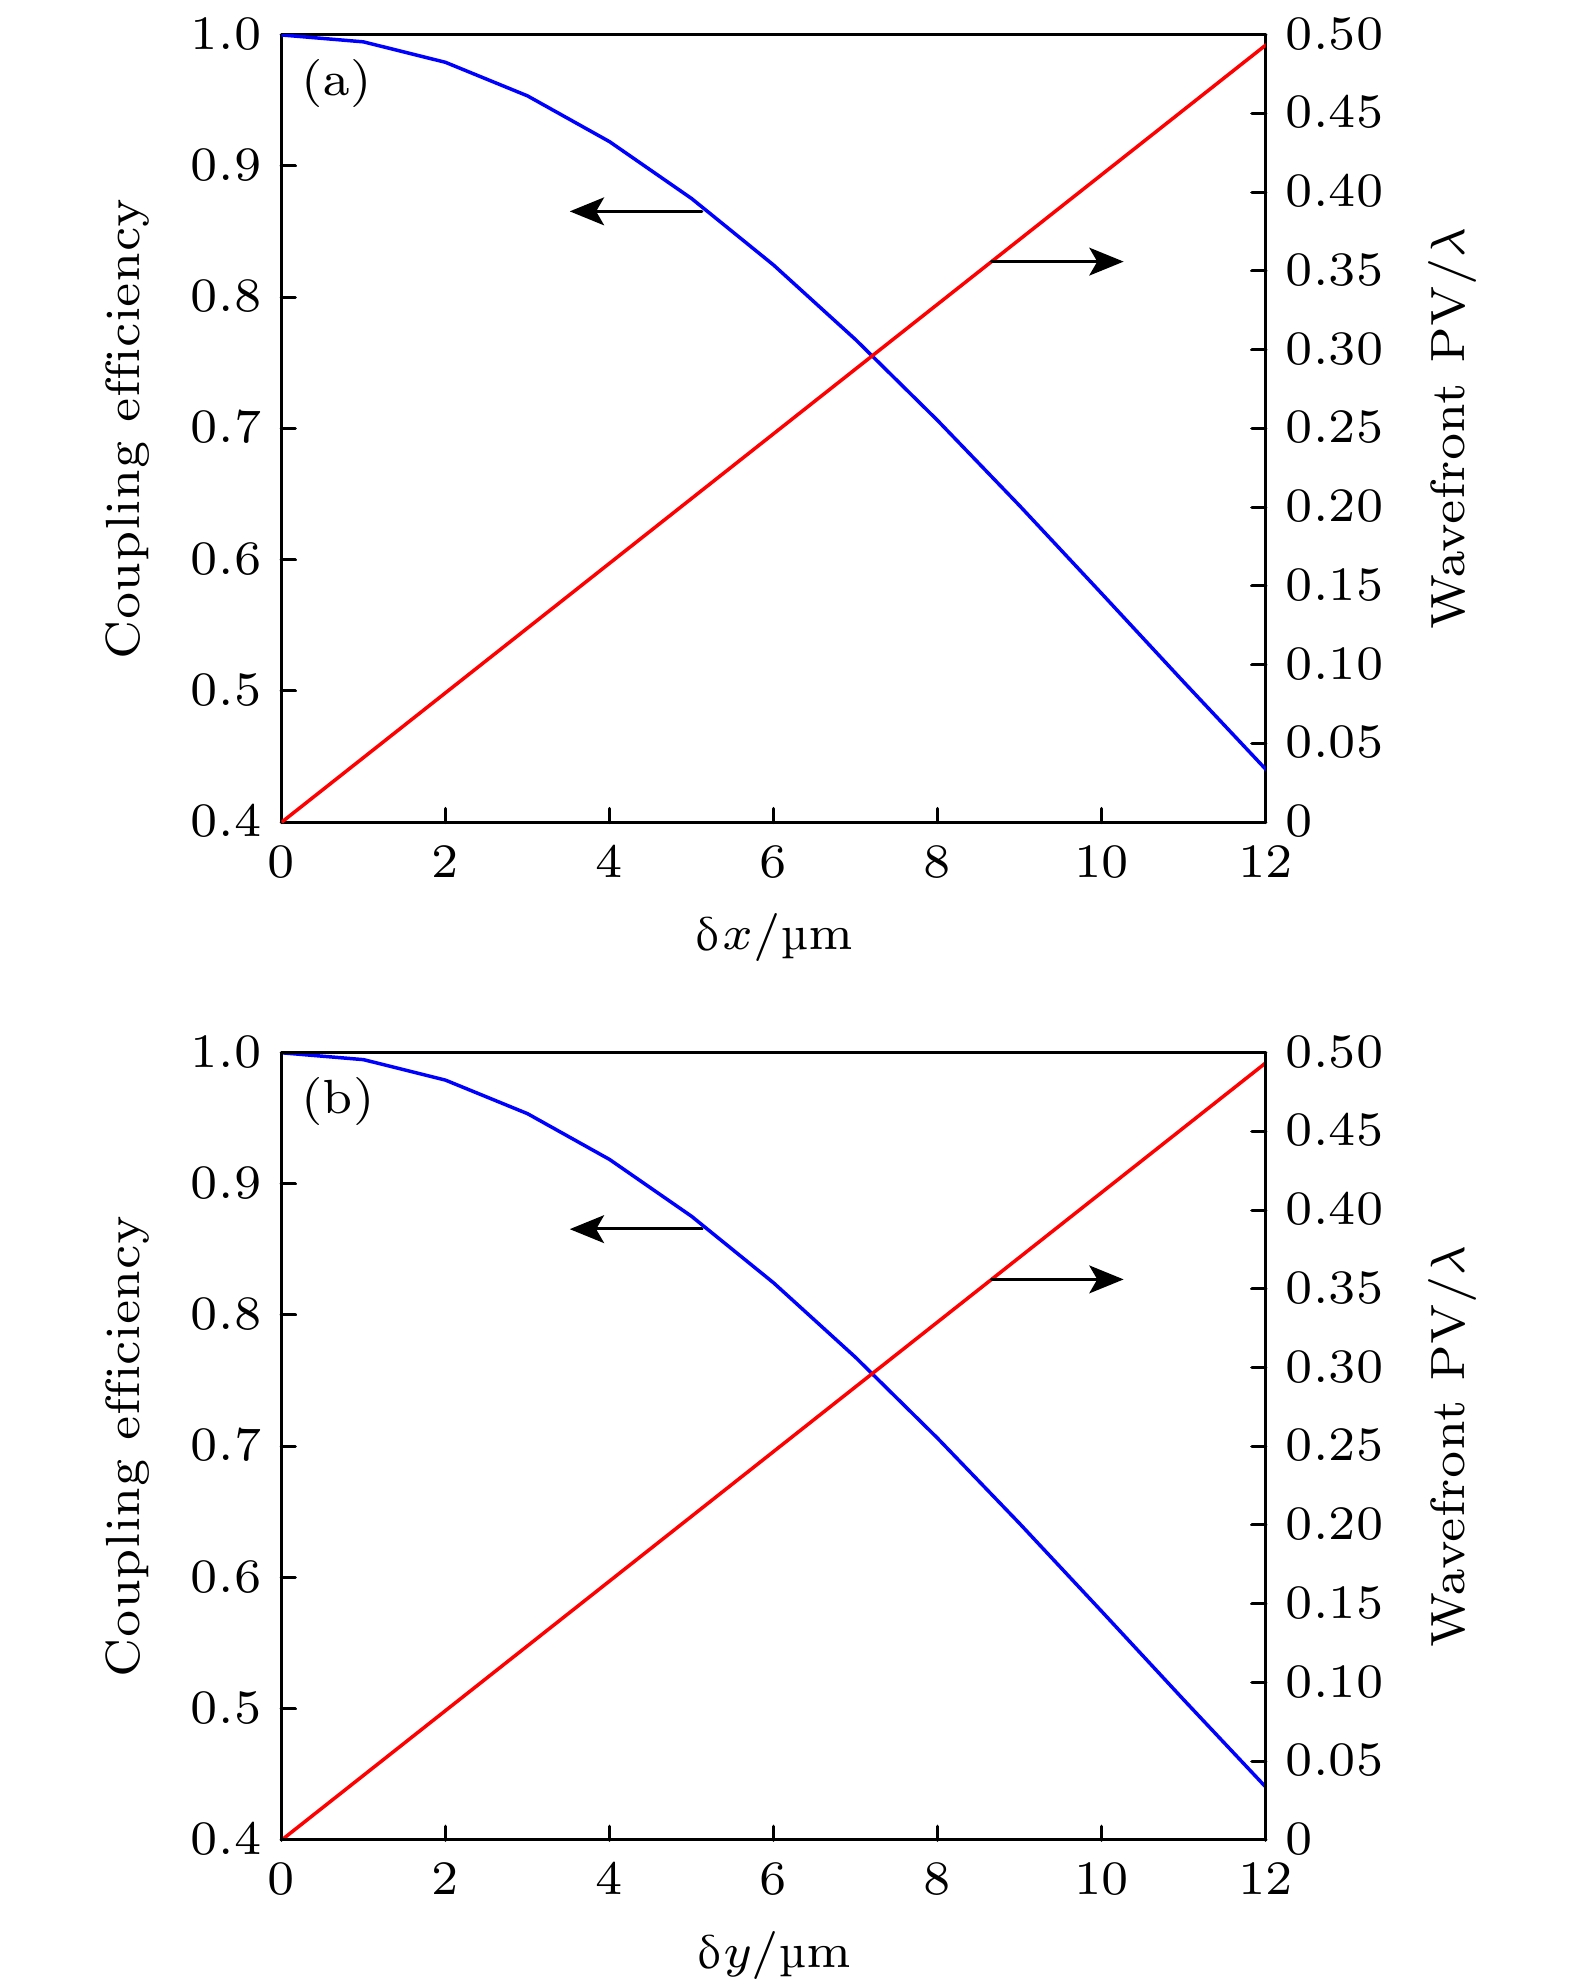
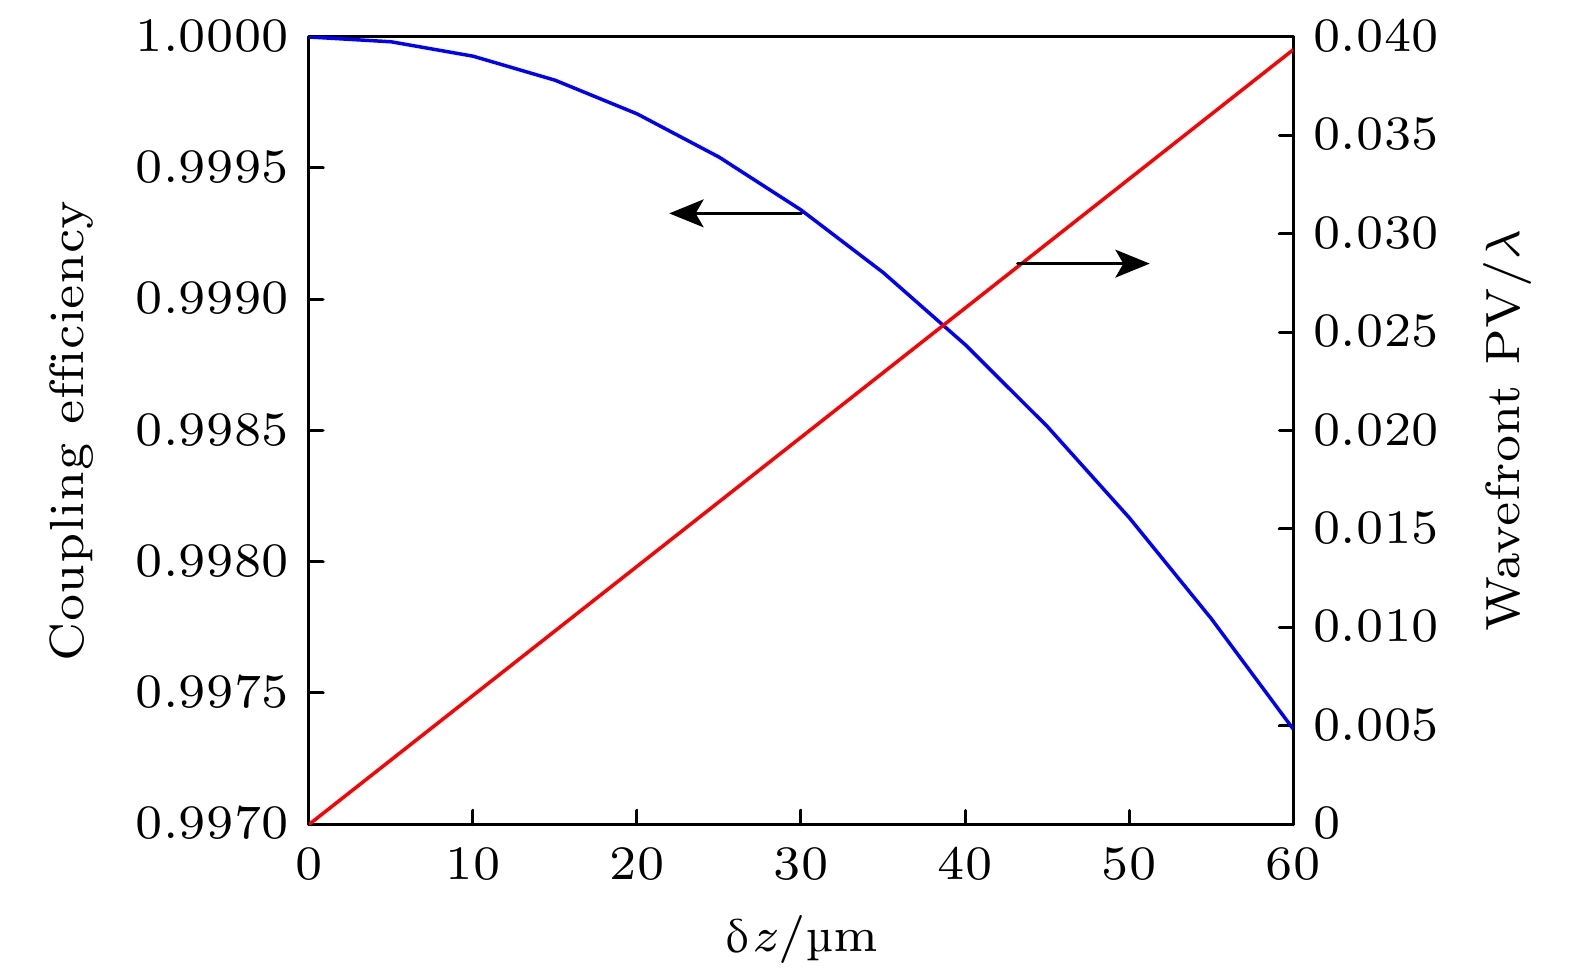
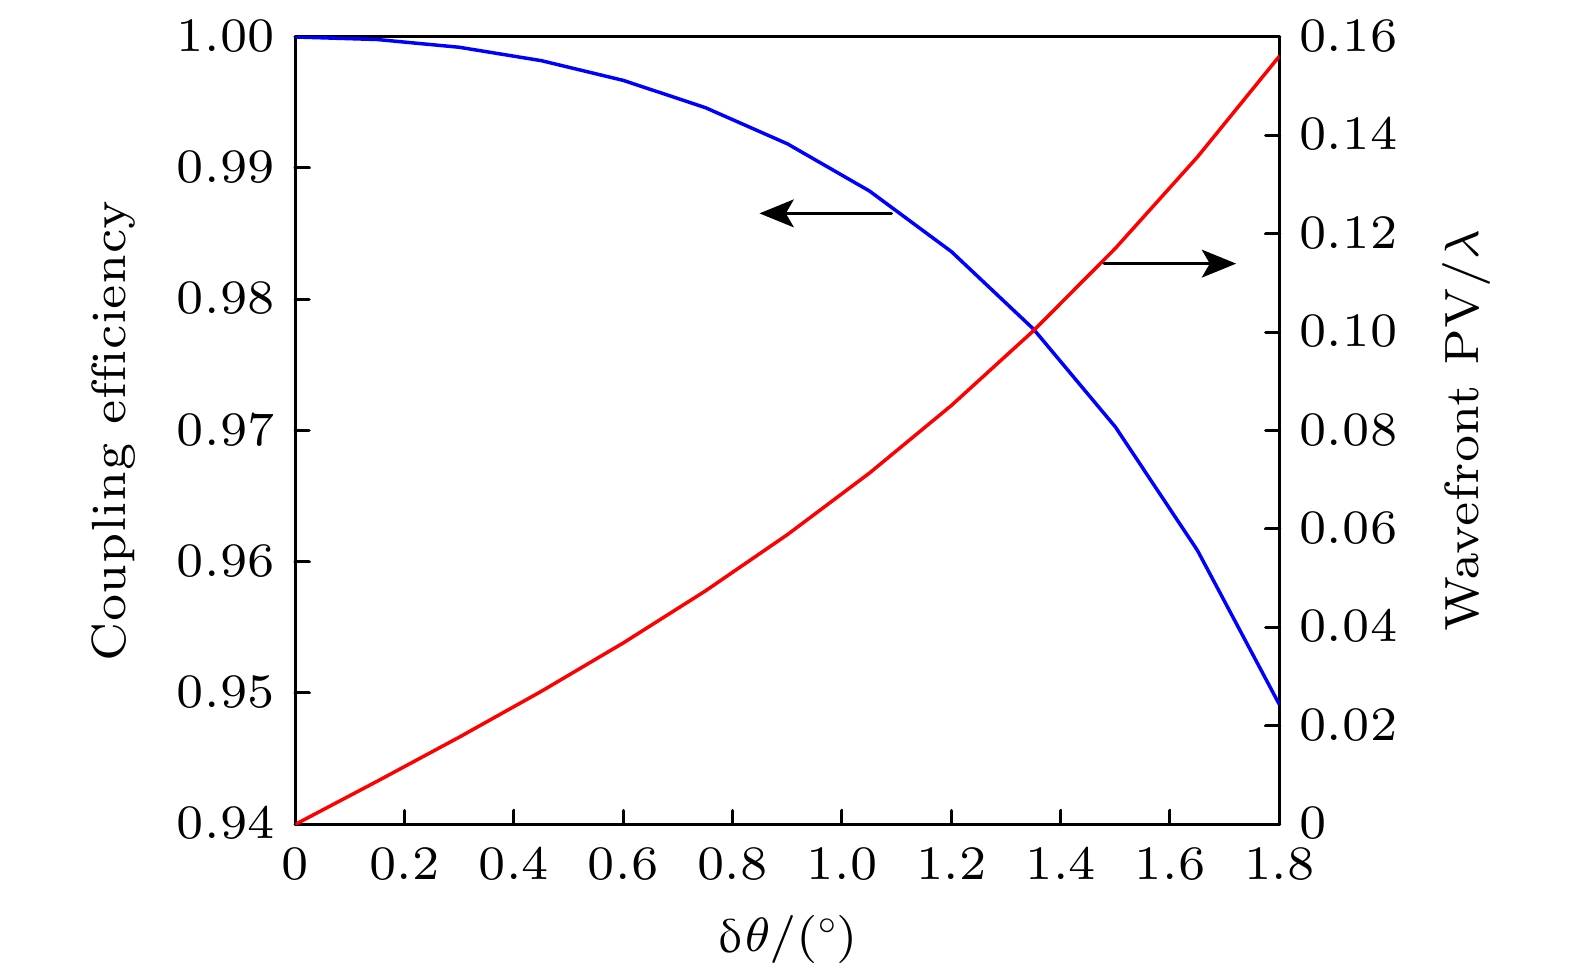
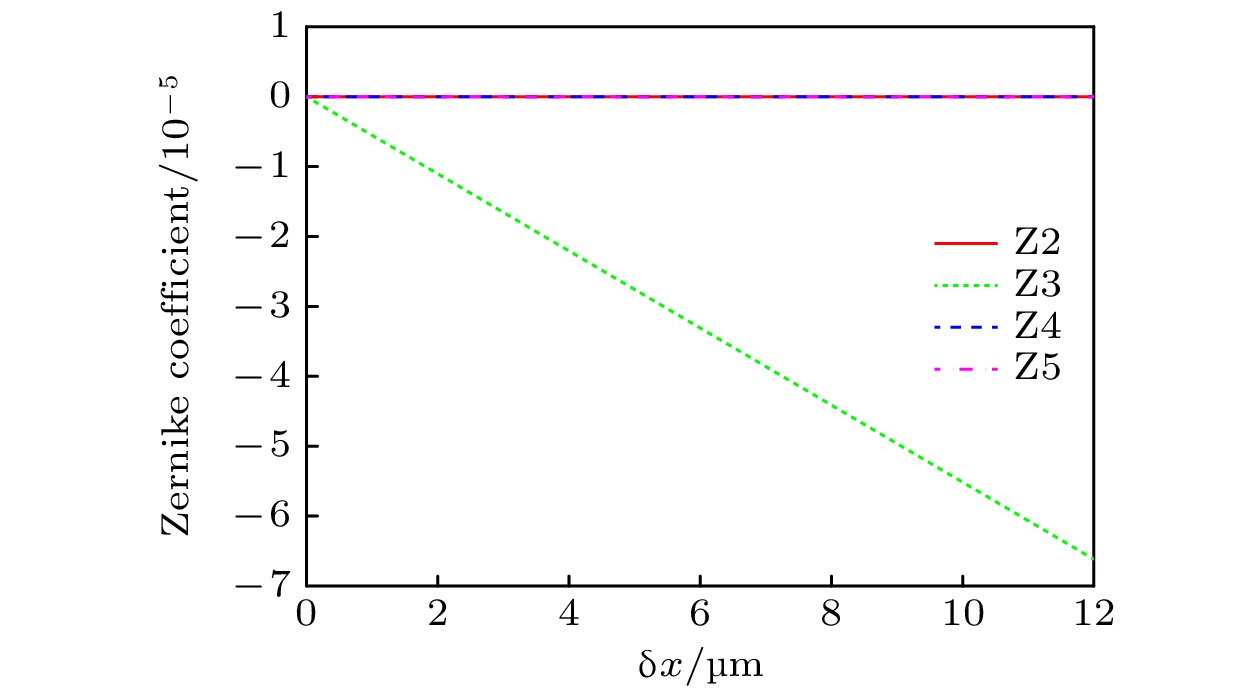
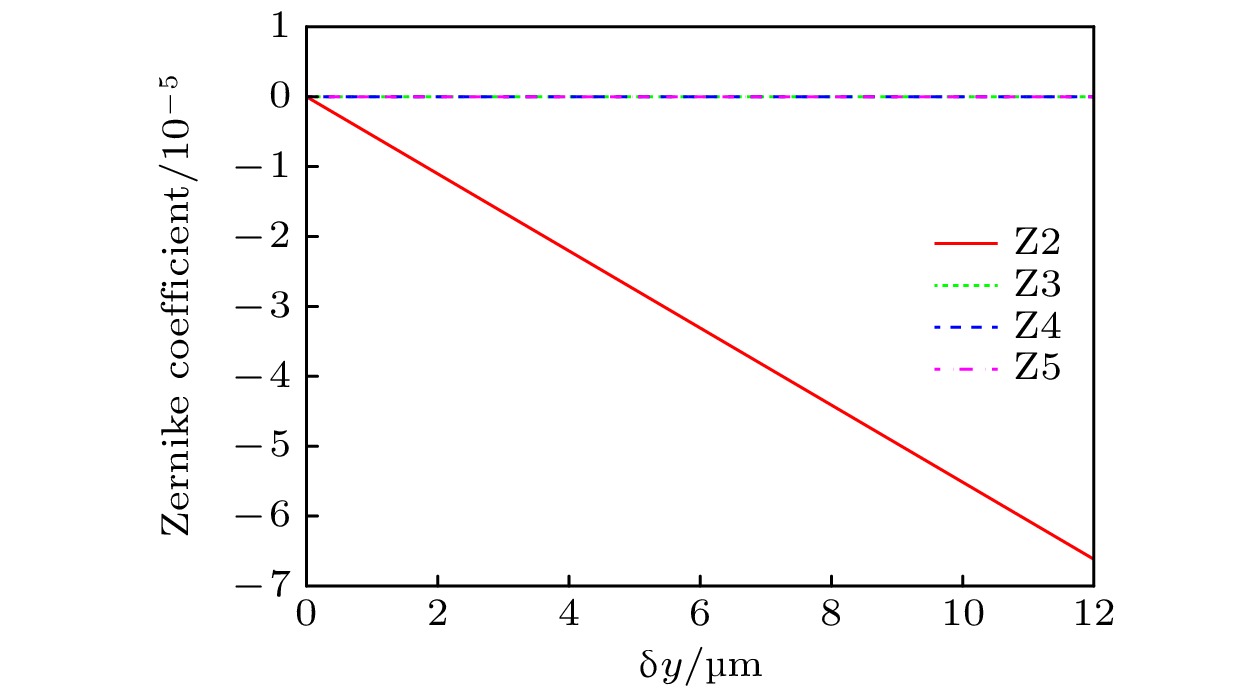
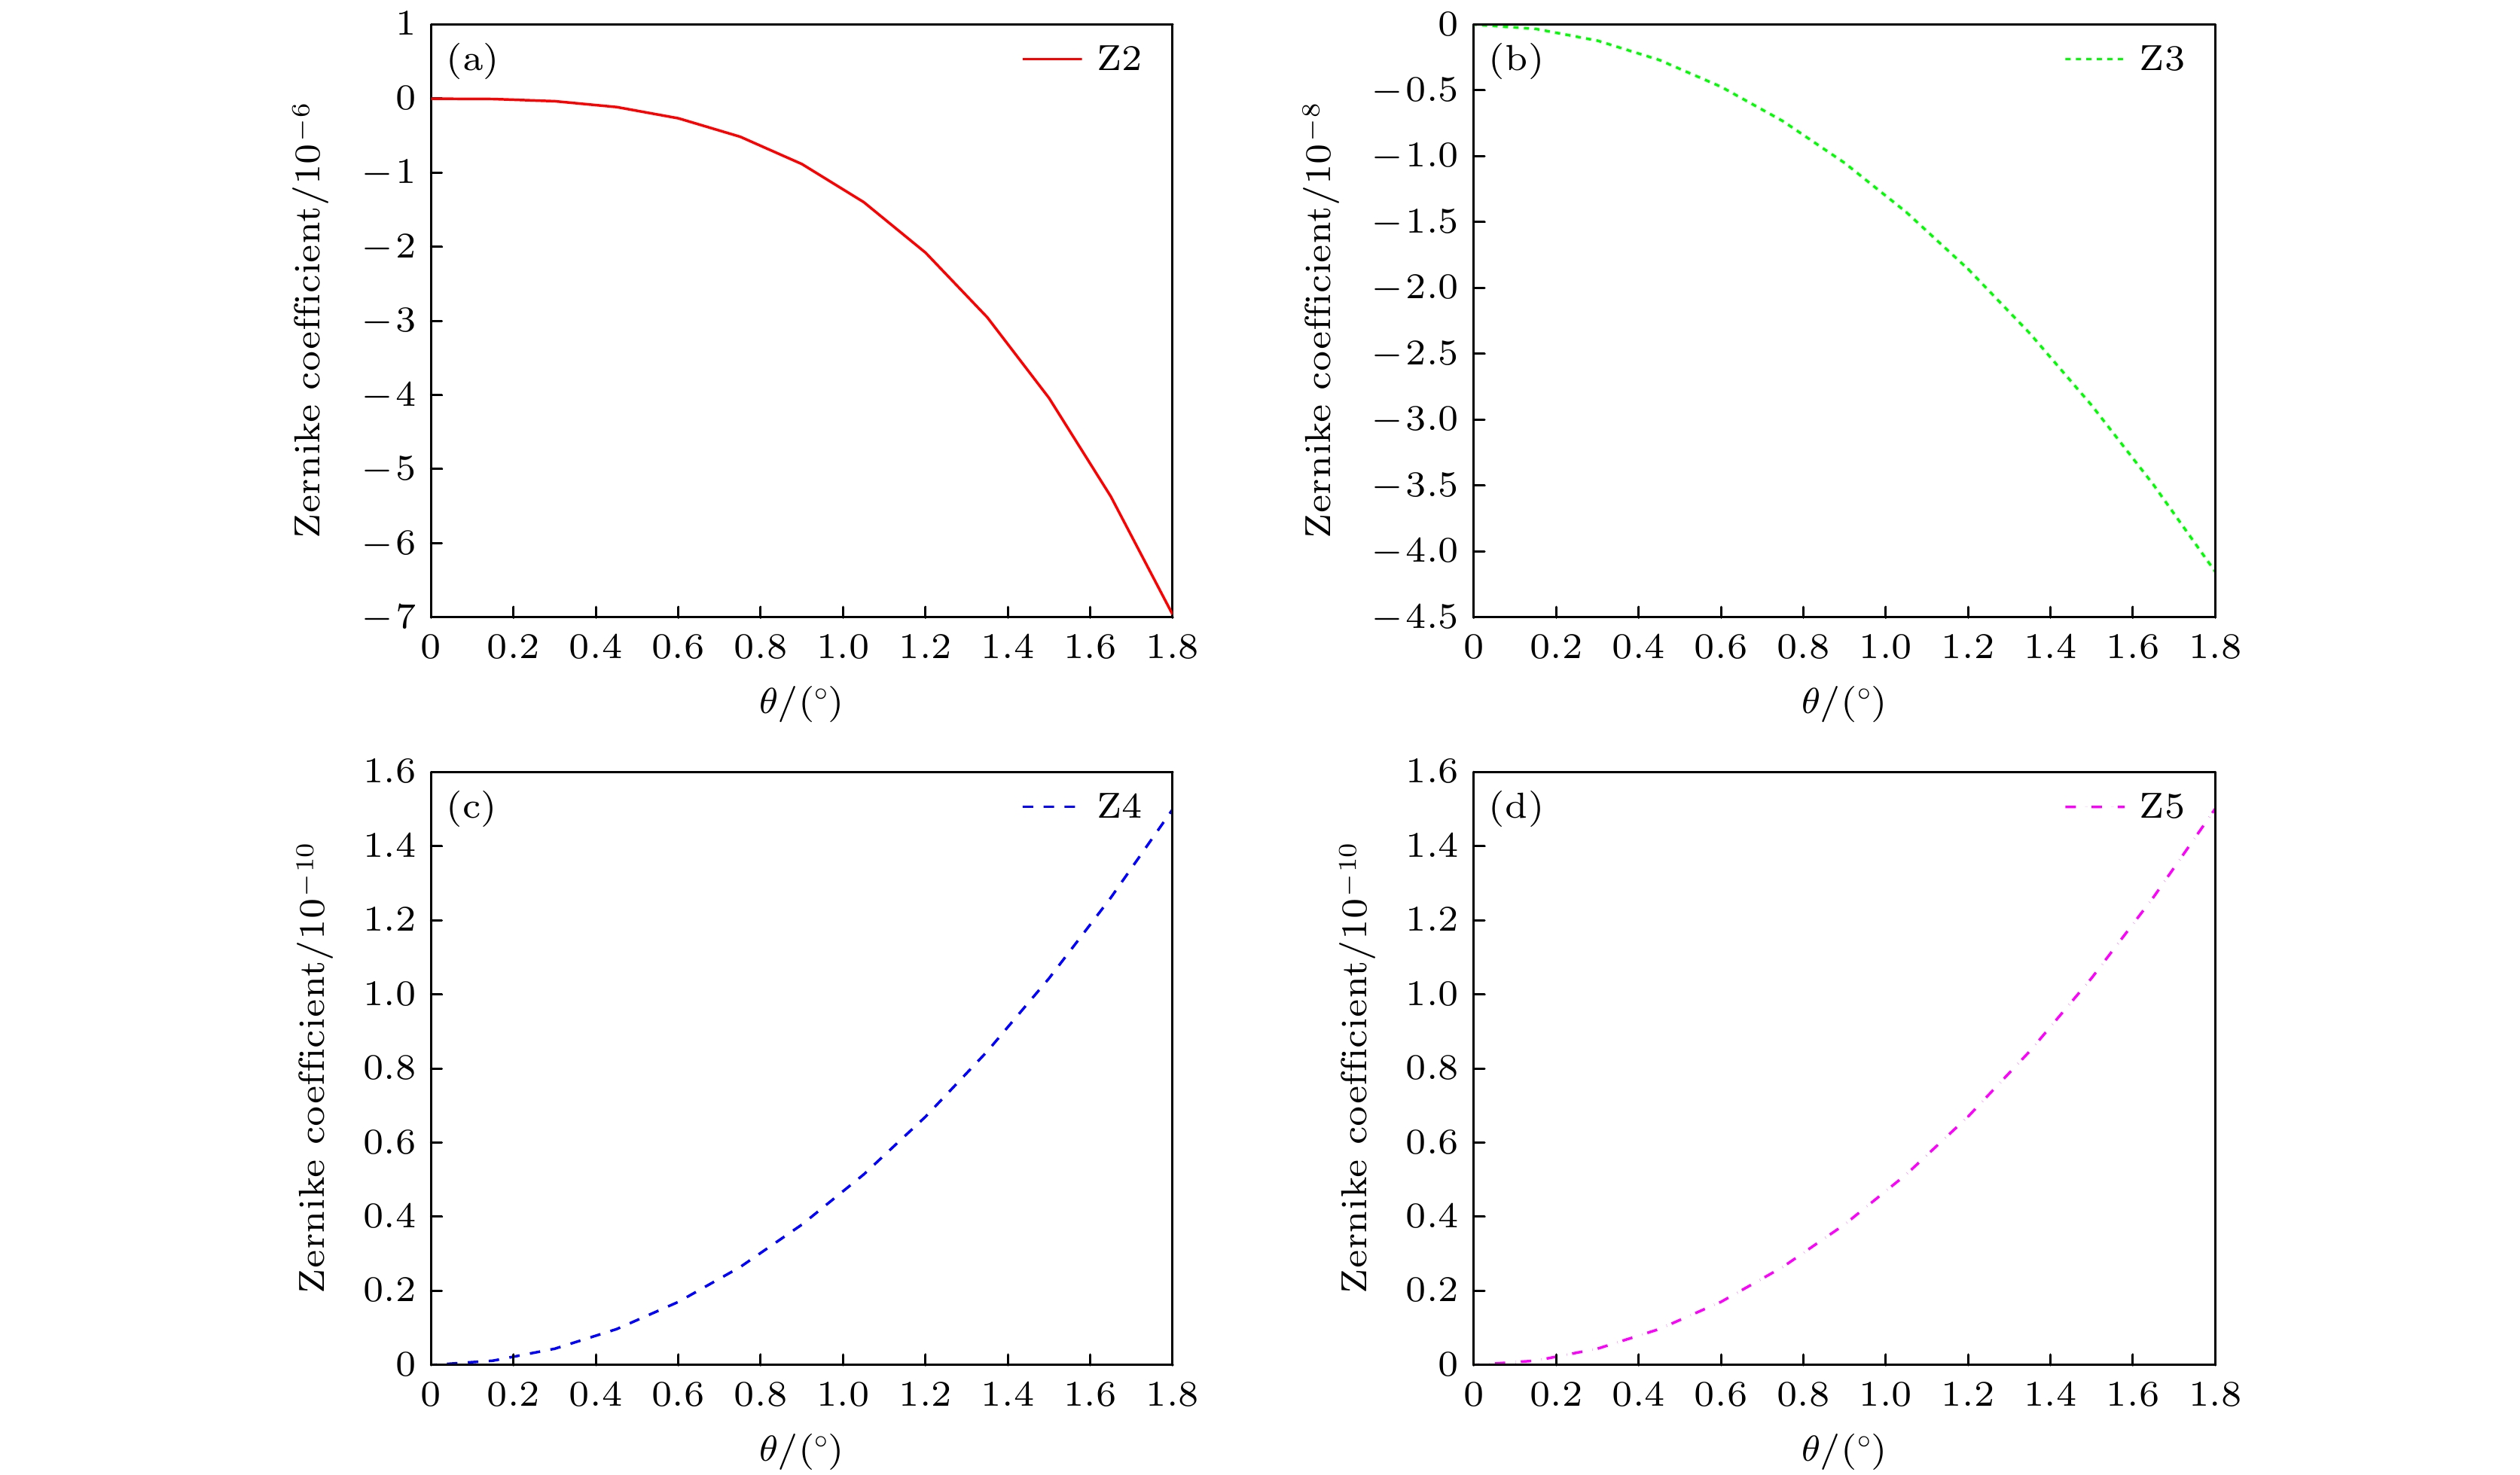
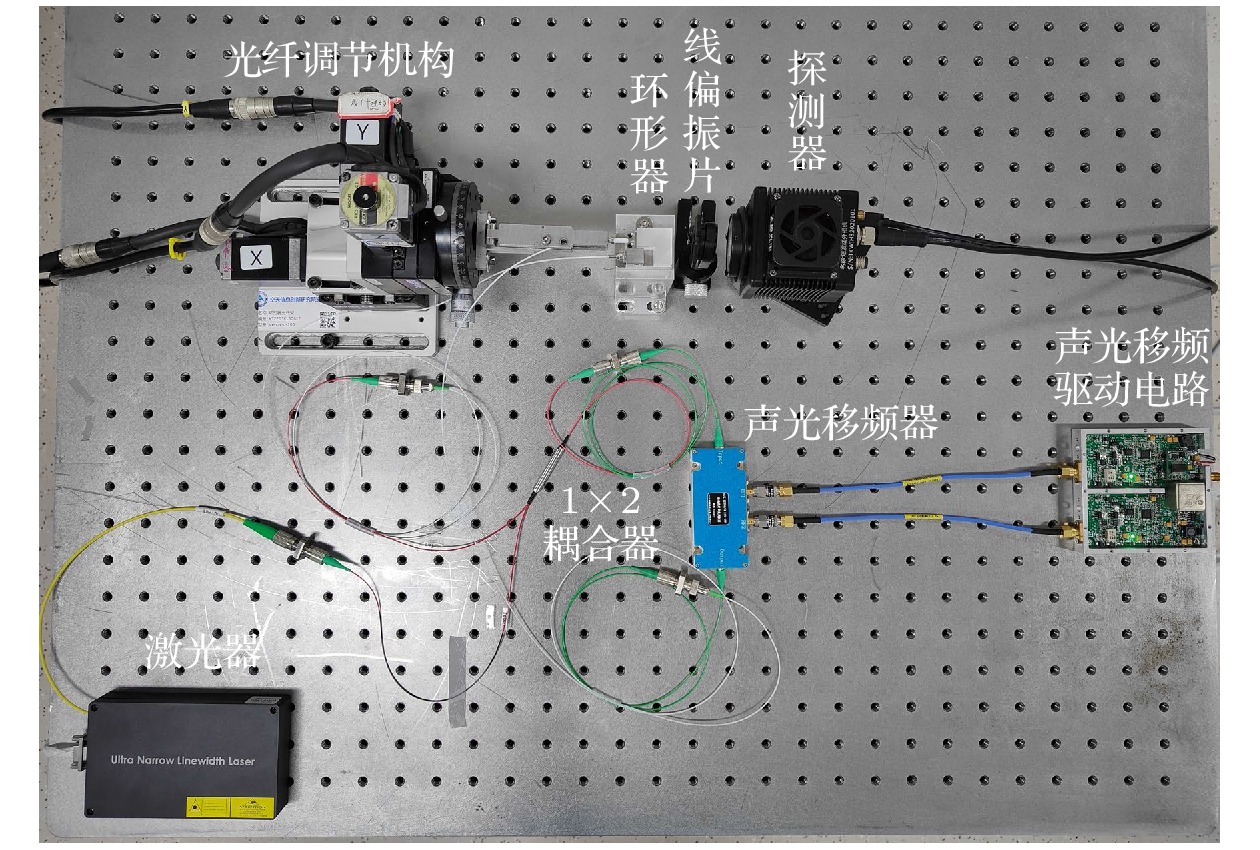
The fiber optic circulator in the form of point diffraction is a key component for coupling fiber optical path and spatial optical path in a laser Doppler vibration measurement system. The coupling efficiency and other performance parameters of fiber optic circulator are great significant for improving measurement accuracy and working distance of vibration measurement system. The conventional circulator coincidence detection methods include energy monitoring method and far-field coincidence monitoring method, which cannot be used to quantitatively analyze the fiber mismatch factors. Therefore, the consistency of the circulator coupling efficiency cannot be guaranteed. To solve these problems, a phase detection technology based on Hertz-level frequency-shifting heterodyne interferometry is proposed. The interferometry phase information is used to calculate the relative spatial positions of optical fibers, and this technology performs quantitative detection in the fiber alignment process. The interference wavefront formed by relative spatial positions of optical fibers is simulated and validated experimentally. The curves of coupling efficiency and wavefront PV value versus different kinds of alignment errors are simulated and analyzed. By fitting the interference wavefront with the Zernike polynomials, the correspondence between different kinds of alignment errors and Zernike coefficients is obtained. The value of Z2 (Zernike coefficient) can be used as the basis for judging whether there is transverse displacement in the Y direction. Similarly, Z3 corresponds to the transverse displacement in the X direction, Z4 corresponds to the longitudinal displacement in the Z direction and Z5 corresponds to the optical axis angle. Through this correspondence relationship, the quantitative separation and analysis of fiber mismatch factors are realized. The experimental results show that the accuracy of this method for measuring lateral displacement is better than 1μm. According to the phase diagram obtained from the experiment, Zernike coefficient fitting is performed. The lateral displacement deviation, longitudinal displacement deviation, and angular deviation are calculated by the coefficients of Z2 to Z5. The fiber adjustment mechanism corrects the transverse displacement deviation. It provides a new detection method for realizing fiber alignment and mismatch correction. Compared with the existing detection methods, the phase detection method based on Hertz-level frequency-shifting heterodyne interferometry solves the quantification problem of fiber coincidence adjustment. This method has the advantages of high measurement accuracy, compact detection structure and composition, and low detection cost. This method has great potential applications in the fields of optical fiber and spatial optical device alignment, optical system aberration detection, and planar wavefront detection.
-
Keywords:
- fiber mismatch /
- alignment error /
- heterodyne interferometry /
- coupling efficiency
[1] 张琦, 王洪斌, 姜睿, 杜传宇 2022 航空发动机 48 76
Zhang Q, Wang H B, Jiang R, Du C Y 2022 Aeroengine 48 76
[2] Fu X, Liu Y Q, Hu X D, Li D C, Hu X T 2004 J. Optoelectron. Laser 11 1357
[3] Ebert R, Lutzmann P, Hebel M 2008 IEEE Photonics Global Singapore, 2008, p1
[4] Zhu Z, Li W, Molina E, Wolberg G 2007 IEEE Conference on Computer Vision and Pattern Recognition, Minneapolis, MN, USA, 2007 p1
[5] 张文 2016 博士学位论文(杭州: 浙江大学)
Zhang W 2016 Ph. D. Dissertation (Hangzhou: Zhejiang University
[6] 刘爱东, 于梅 2015 振动与冲击 34 212
Liu A D, Yu M 2015 J. Vib. Shock 34 212
[7] 吕韬 2019 博士学位论文(长春: 中国科学院长春光学精密机械与物理研究所)
Lv T 2019 Ph. D. Dissertation (Changchun: Chinese Academy of Sciences Changchun Institute of Optics Fine Mechanics and Physics
[8] Li R, Poulos N M, Zhu Z G, Xie L P 2012 Appl. Opt. 51 5011
 Google Scholar
[9] Han X Y, Lv T, Wu S S, Li Y Y, He B 2019 Opt. Laser Technol. 111 575
 Google Scholar
[10] He Q, Zhao Z G, Ye X D, Luo C, Zhang D C, Wang S F, Xu X P 2022 Micromachines 13 324
 Google Scholar
[11] Alaruri S D 2015 Optik 126 5923
 Google Scholar
[12] Liu X Y, Guo J, Li G N, Chen N, Shi K 2019 Results Phys. 12 1044
 Google Scholar
[13] Zhang M Q, Zhi D, Chang Q, Ma P F, Ma Y X, Su R T, Wu J, Zhou P, Si L 2019 Laser Phys. 29 115101
 Google Scholar
[14] Yan Y X, Zheng Y, Duan J A, Huang Z L 2020 Opt. Fiber Technol. 58 102301
 Google Scholar
[15] Phattaraworamet T, Saktioto T, Ali J, Fadhali M, Yupapin P P, Zainal J, Mitatha S 2010 Optik 121 2240
 Google Scholar
[16] 丁莉, 刘代中, 高妍琦, 朱宝强, 朱俭, 彭增云, 朱健强, 俞立钧 2008 57 5713
 Google Scholar
Ding L, Liu D Z, Gao Y Q, Zhu B Q, Zhu J, Peng Z Y, Zhu J Q, Yu L J 2008 Acta Phys. Sin. 57 5713
 Google Scholar
[17] 陶嘉庆, 胡越, 项华中, 涂建坤, 郑刚 2021 电子科技 34 37
 Google Scholar
Tao J Q, Hu Y, Xiang Z H, Tu J K, Zheng G 2021 Electron. Sci. Technol. 34 37
 Google Scholar
[18] Zhu M X, Bai F Z, Gan S M, Huang K Z, Huang L H, Wang J X 2013 Optik 124 5624
 Google Scholar
[19] Wallner O, Winzer P J, Leeb W R 2002 Appl. Opt. 41 637
 Google Scholar
[20] Kang J M, Guo P, Zhang Y C, Chen H, Chen S Y, Ge X Y 2013 SPIE Fifth International Symposium on Photoelectronic Detection and Imaging Beijing, China, June 25, 2013 p891417
-
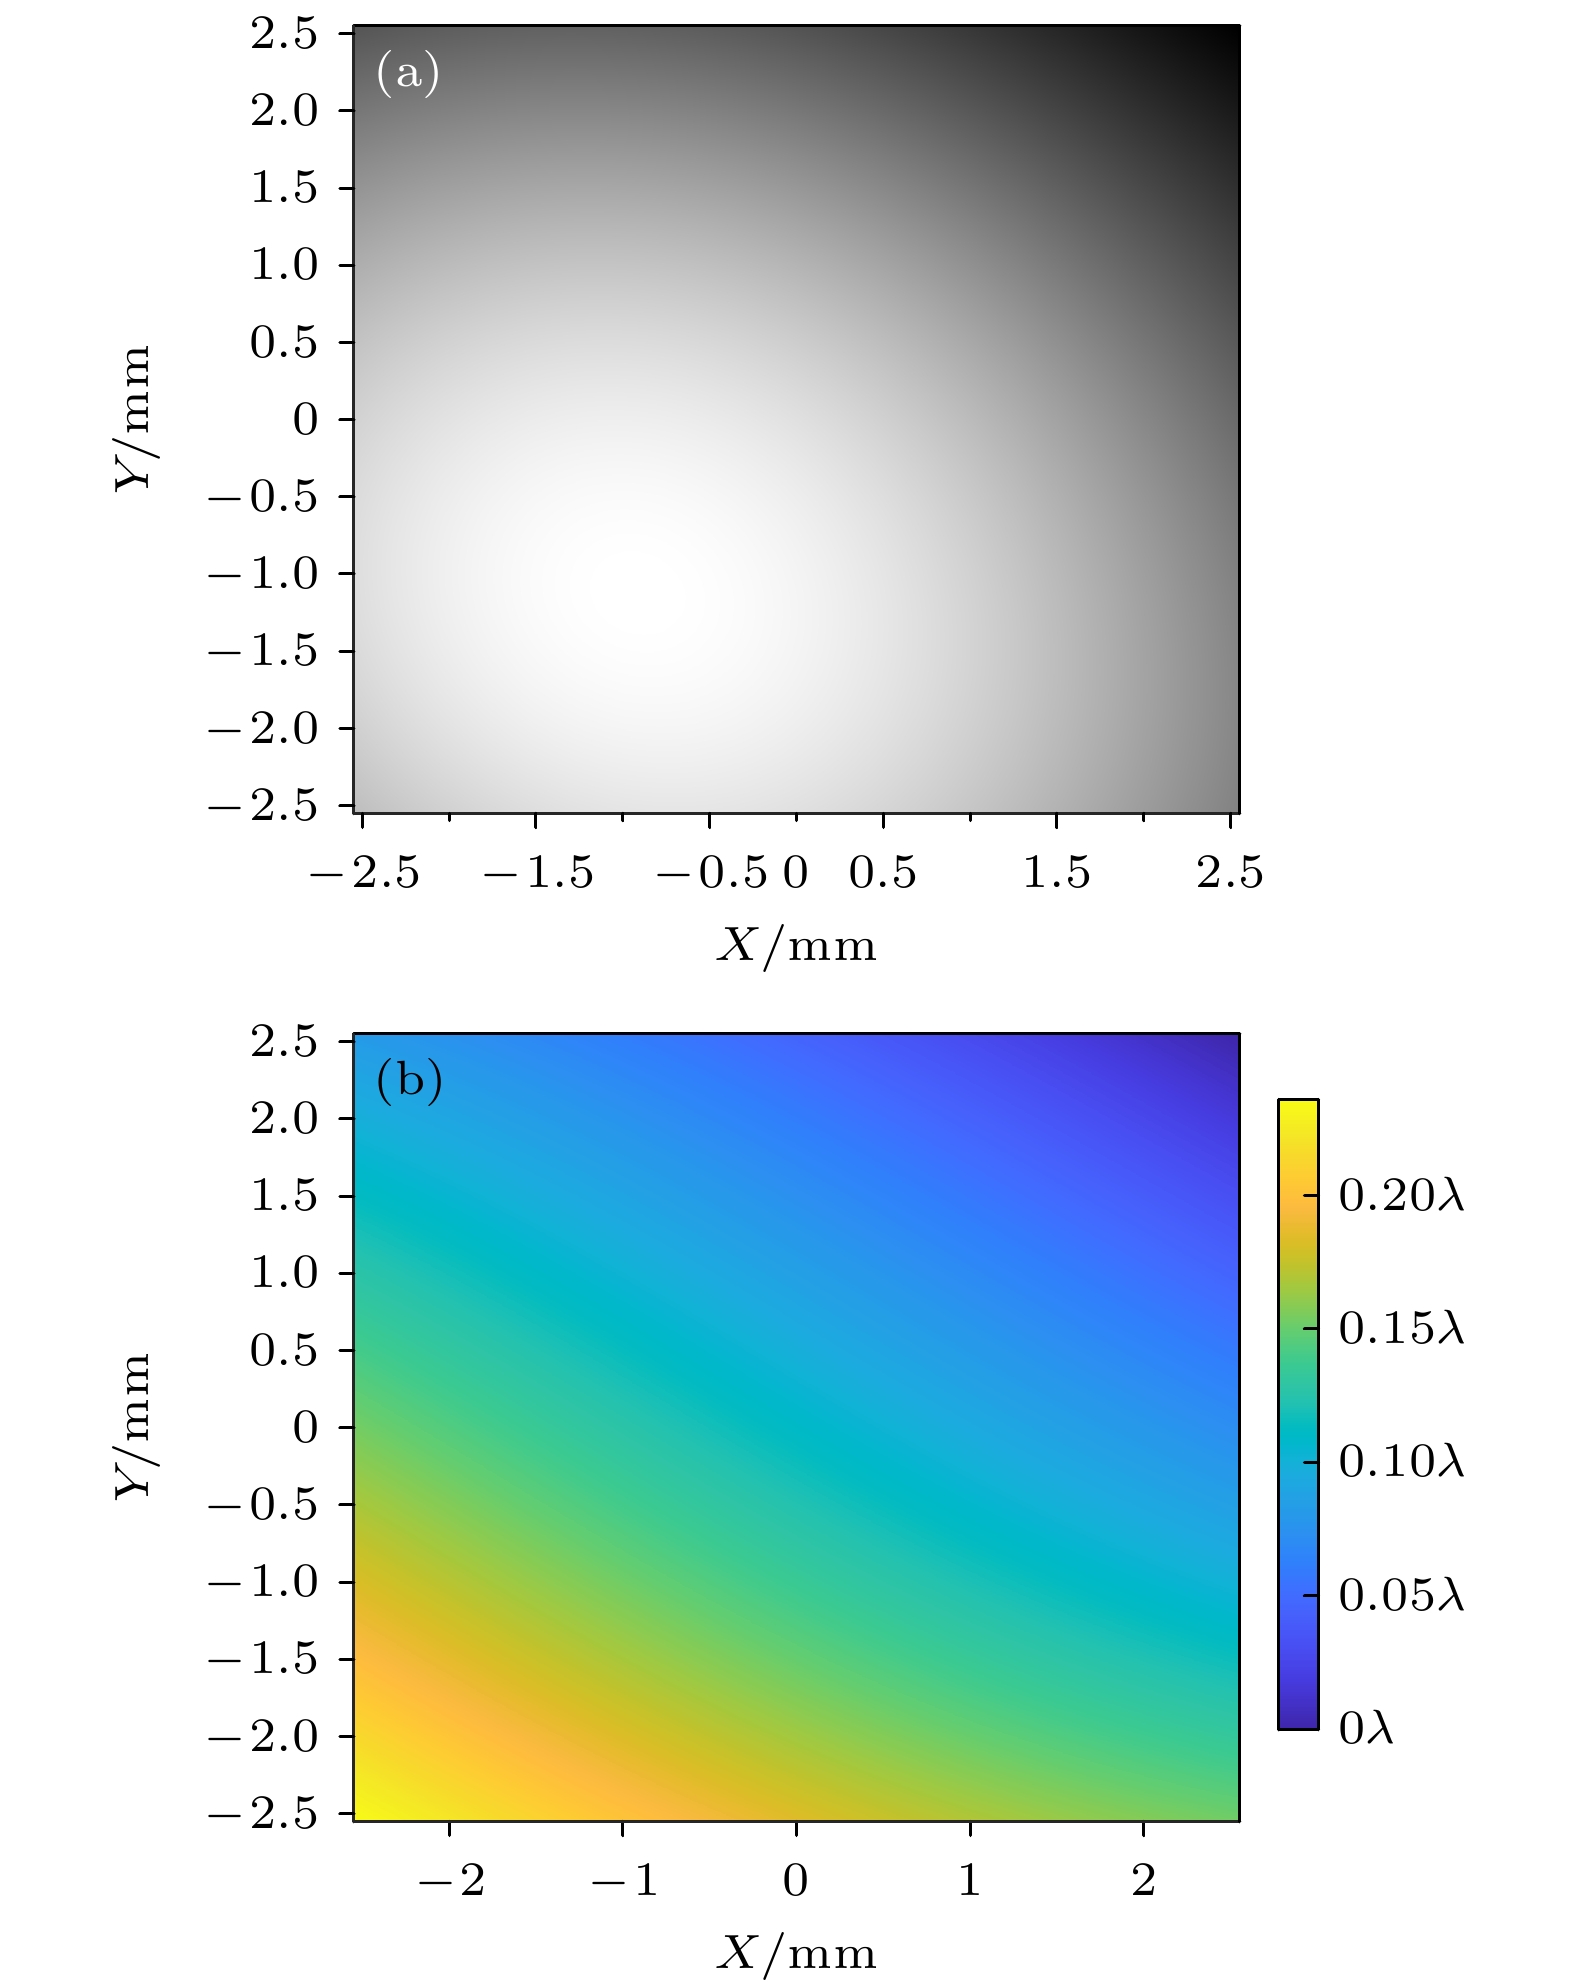
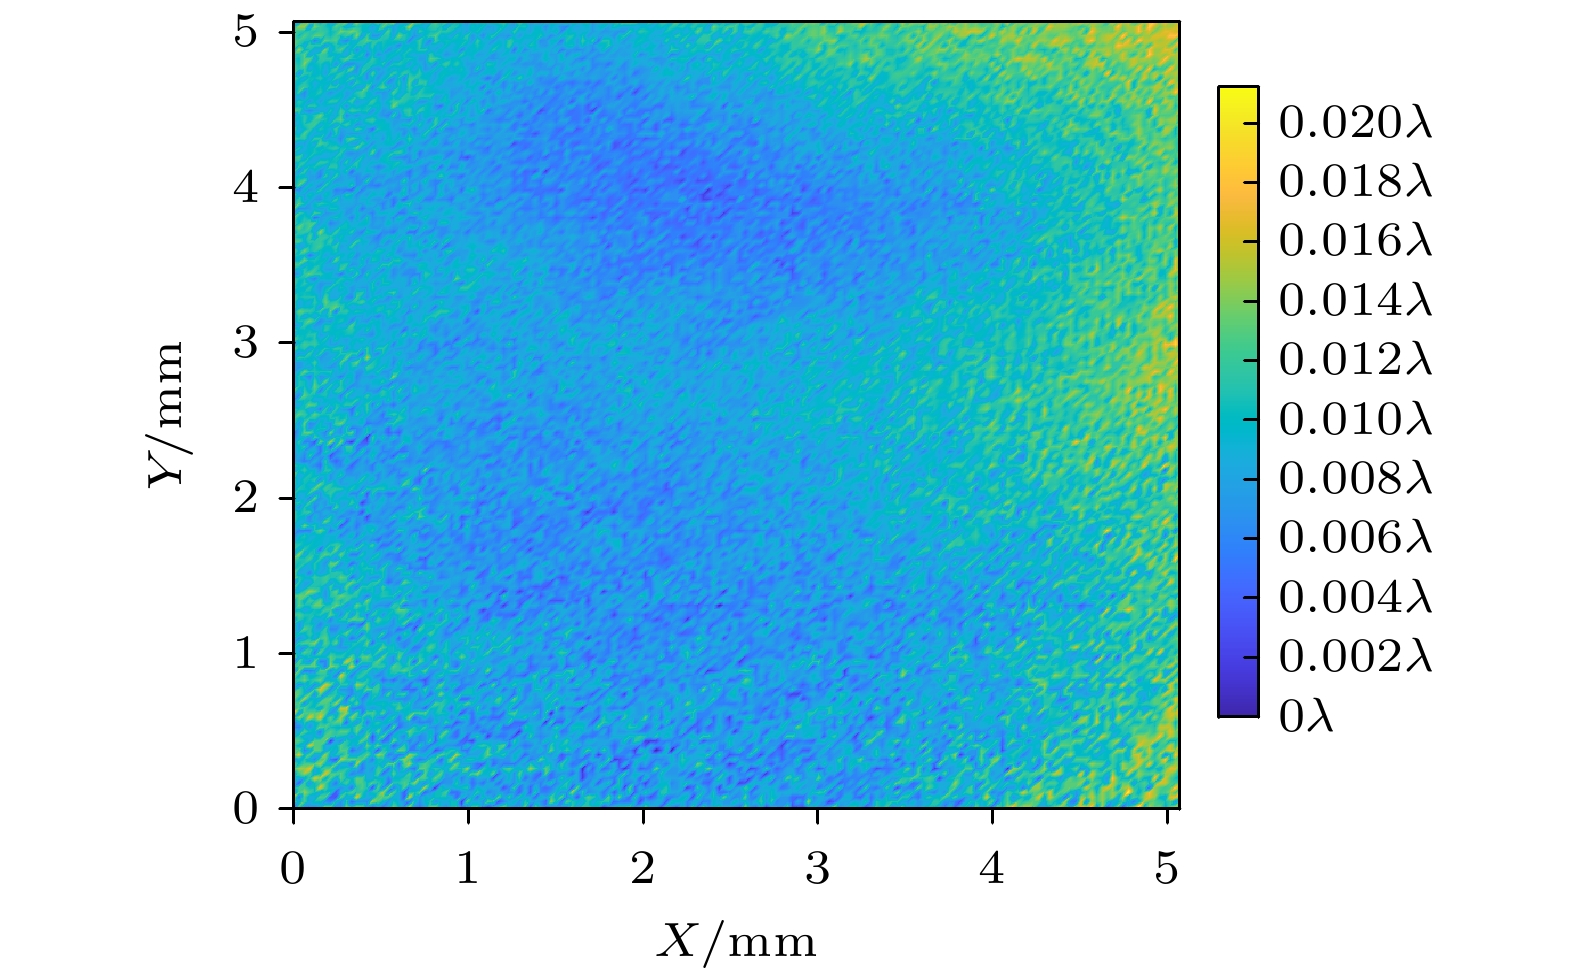
图 13 实验获得的干涉相位图及仿真图对比 (a)实验获得的干涉相位图; (b)根据实验结果拟合Zernike系数解算得到的相对位置信息获得的仿真干涉相位图
Figure 13. The experimental phase diagram compared with the simulation diagram: (a) Phase diagram obtained by experiment; (b) simulated phase diagram obtained from calculated relative position information based on experimental results fitting Zernike coefficients.
表 1 不同光纤相对姿态对应Zernike系数比较
Table 1. Comparison of Zernike coefficients corresponding to different kinds of alignment errors.
光纤相对姿态 Z2 Z3 Z4 Z5 δx/μm δy/μm δz/μm θ/(°) 2 3 5 0.5 –1.67×10⁻⁵ –1.10×10⁻⁵ 2.14×10⁻¹¹ 1.20×10⁻¹¹ 2 0 0 0 –4.02×10⁻¹⁹ –1.10×10⁻⁵ 1.85×10⁻²² 1.08×10⁻²¹ 0 3 0 0 –1.65×10⁻⁵ 1.03×10⁻¹⁸ –1.41×10⁻²¹ 8.87×10⁻²² 0 0 5 0 –5.20×10⁻⁹ –5.20×10⁻⁹ 9.38×10⁻¹² –1.03×10⁻²⁵ 0 0 0 0.5 –1.54×10⁻⁷ –3.30×10⁻⁹ 1.19×10⁻¹¹ 1.19×10⁻¹¹ 表 2 不同光纤相对姿态对应耦合效率和波前PV值比较
Table 2. Comparison of coupling efficiency and wavefront PV value corresponding to different kinds of alignment errors.
光纤相对姿态 耦合效率 波前PV/λ δx/μm δy/μm δz/μm θ/(°) 2 3 5 0.5 0.9215 0.2359 2 0 0 0 0.9792 0.0823 0 3 0 0 0.9536 0.1234 0 0 5 0 0.9999 0.0033 0 0 0 0.5 0.9978 0.0302 表 3 实验结果与对应Zernike系数比较
Table 3. Comparison of experimental results and simulation Zernike coefficients.
光纤相对姿态 Z2 Z3 Z4 Z5 δx/μm δy/μm δz/μm θ/(°) 实验值 — — — — 9.01×10⁻⁶ –2.74×10⁻⁶ 2.28×10⁻¹¹ –5.75×10⁻¹¹ 仿真值 0.5 –1.4 42 –1.1 9.31×10⁻⁶ –2.75×10⁻⁶ 2.24×10⁻¹¹ –5.65×10⁻¹¹ 0.5 0 0 0 2.26×10⁻¹⁹ –2.75×10⁻⁶ –2.28×10⁻²² –3.60×10⁻²² 0 –1.4 0 0 7.71×10⁻⁶ –6.33×10⁻¹⁹ 6.38×10⁻²² –1.01×10⁻²¹ 0 0 42 0 –4.37×10⁻⁸ –4.37×10⁻⁸ 7.88×10⁻¹¹ 1.30×10⁻²⁴ 0 0 0 –1.1 1.60×10⁻⁶ 1.56×10⁻⁸ –5.64×10⁻¹¹ –5.65×10⁻¹¹ 表 4 横向位移纠正后的实验结果与对应Zernike系数比较
Table 4. Comparison of experimental results after transverse displacement correction and simulation Zernike coefficients.
光纤相对姿态 Z2 Z3 Z4 Z5 δx/μm δy/μm δz/μm θ/(°) 实验值 — — — — –9.62×10⁻⁸ 4.96×10⁻⁷ 6.45×10⁻¹² –1.79×10⁻¹¹ 仿真值 –0.09 0.02 — — –1.10×10⁻⁷ 4.96×10⁻⁷ — — –0.09 0 0 0 –4.07×10⁻²⁰ 4.96×10⁻⁷ 4.10×10⁻²³ 6.47×10⁻²³ 0 0.02 0 0 –1.10×10⁻⁷ 9.04×10⁻²¹ –9.11×10⁻²⁴ 1.44×10⁻²³ -
[1] 张琦, 王洪斌, 姜睿, 杜传宇 2022 航空发动机 48 76
Zhang Q, Wang H B, Jiang R, Du C Y 2022 Aeroengine 48 76
[2] Fu X, Liu Y Q, Hu X D, Li D C, Hu X T 2004 J. Optoelectron. Laser 11 1357
[3] Ebert R, Lutzmann P, Hebel M 2008 IEEE Photonics Global Singapore, 2008, p1
[4] Zhu Z, Li W, Molina E, Wolberg G 2007 IEEE Conference on Computer Vision and Pattern Recognition, Minneapolis, MN, USA, 2007 p1
[5] 张文 2016 博士学位论文(杭州: 浙江大学)
Zhang W 2016 Ph. D. Dissertation (Hangzhou: Zhejiang University
[6] 刘爱东, 于梅 2015 振动与冲击 34 212
Liu A D, Yu M 2015 J. Vib. Shock 34 212
[7] 吕韬 2019 博士学位论文(长春: 中国科学院长春光学精密机械与物理研究所)
Lv T 2019 Ph. D. Dissertation (Changchun: Chinese Academy of Sciences Changchun Institute of Optics Fine Mechanics and Physics
[8] Li R, Poulos N M, Zhu Z G, Xie L P 2012 Appl. Opt. 51 5011
 Google Scholar
[9] Han X Y, Lv T, Wu S S, Li Y Y, He B 2019 Opt. Laser Technol. 111 575
 Google Scholar
[10] He Q, Zhao Z G, Ye X D, Luo C, Zhang D C, Wang S F, Xu X P 2022 Micromachines 13 324
 Google Scholar
[11] Alaruri S D 2015 Optik 126 5923
 Google Scholar
[12] Liu X Y, Guo J, Li G N, Chen N, Shi K 2019 Results Phys. 12 1044
 Google Scholar
[13] Zhang M Q, Zhi D, Chang Q, Ma P F, Ma Y X, Su R T, Wu J, Zhou P, Si L 2019 Laser Phys. 29 115101
 Google Scholar
[14] Yan Y X, Zheng Y, Duan J A, Huang Z L 2020 Opt. Fiber Technol. 58 102301
 Google Scholar
[15] Phattaraworamet T, Saktioto T, Ali J, Fadhali M, Yupapin P P, Zainal J, Mitatha S 2010 Optik 121 2240
 Google Scholar
[16] 丁莉, 刘代中, 高妍琦, 朱宝强, 朱俭, 彭增云, 朱健强, 俞立钧 2008 57 5713
 Google Scholar
Ding L, Liu D Z, Gao Y Q, Zhu B Q, Zhu J, Peng Z Y, Zhu J Q, Yu L J 2008 Acta Phys. Sin. 57 5713
 Google Scholar
[17] 陶嘉庆, 胡越, 项华中, 涂建坤, 郑刚 2021 电子科技 34 37
 Google Scholar
Tao J Q, Hu Y, Xiang Z H, Tu J K, Zheng G 2021 Electron. Sci. Technol. 34 37
 Google Scholar
[18] Zhu M X, Bai F Z, Gan S M, Huang K Z, Huang L H, Wang J X 2013 Optik 124 5624
 Google Scholar
[19] Wallner O, Winzer P J, Leeb W R 2002 Appl. Opt. 41 637
 Google Scholar
[20] Kang J M, Guo P, Zhang Y C, Chen H, Chen S Y, Ge X Y 2013 SPIE Fifth International Symposium on Photoelectronic Detection and Imaging Beijing, China, June 25, 2013 p891417
Catalog
Metrics
- Abstract views: 6510
- PDF Downloads: 117
- Cited By: 0


 DownLoad:

