


-
The expression of equilibrium pressure tensor for uniform systems derived from Virial theorem can be divided into two parts: dynamic pressure tensor and configuration pressure tensor. The local mean pressure tensor is obtained by physical analysis of the equilibrium non-uniform system. In this paper, this expression is derived in a more concise way. The theoretical relationship, with undetermined parameters, between the three parts (the volume contribution, the surface contribution and the line contribution) of the average configuration pressure of a homogeneous fluid system and the local average size L* with the atomic diameter as length unit greater than 8 is given. Taking argon as an example, molecular dynamics simulation is carried out by using the Lennard-Jones potential between atoms at temperature 180 K and density 0.8 (atomic diameter)–3. The simulation curves of configuration pressure and its three parts are given, and the undetermined coefficients in the theoretical relationship under the condition of L* > 8 are determined. It is found that for L* > 2, With the increase of L*, the volume contribution decreases monotonously from the positive pressure to the negative total configuration pressure, while the surface contribution and the line contribution both increase monotonously and tend to zero, but the line contribution tends to zero fastest. The complex characteristics of various behaviors are explained physically. It is concluded that the surface contribution and the line contribution can be neglected only if L* are large enough. In nanoscale, the neglect of the surface contribution and the line contribution, i.e., the neglect of the boundary effect, will bring obvious errors to the calculation. Finally, molecular dynamics simulation shows that the configuration pressure increases with the increase of temperature. These conclusions are significant for optimizing the selection of pressure tensor in molecular dynamics simulation.
-
Keywords:
- Virial theorem /
- molecular dynamics simulation /
- surface tension /
- local pressure tensor /
- configuration pressure
[1] Clausius R 1870 Philosoph. Magaz. 40 122
[2] Maxwell J C 1874 Nature 10 477
 Google Scholar
[3] Kirkwood J G, Buff F P T 1949 J. Chem. Phys. 17 338
Google Scholar
[4] Irving J H, Kirkwood J G 1950 J. Chem. Phys. 18 817
Google Scholar
[5] Harasima A 1958 Adv. Chem. Phys. 1 203
[6] Schofield P, Hendersen J R 1982 Proc. R. Soc. London Ser. A 379 231
Google Scholar
[7] 毛志红, 包福兵, 余霞 2013 低温工程 3 47
Google Scholar
Mao Z H, Bao F B, Yu X 2013 Cryogenics 3 47
Google Scholar
[8] 周绍华, 黄永华 2018 低温 40 49
Zhou S H, Huang Y H 2018 Chin. J. Low. Temp. Phys. 40 49
[9] Cormier J, Rickman J M, Delph T J 2001 J. Appl. Phys. 89 99
Google Scholar
[10] Cheung K S, Yip S 1991 J. Appl. Phys. 70 5688
Google Scholar
[11] Sun Z H, Wang X X, Soh K A, Wu H A 2006 Model. Simul. Mater. Sci. Eng. 14 423
Google Scholar
[12] Xu R, Liu B 2009 Acta Mech. Solida Sin. 22 644
Google Scholar
[13] Li Y F, Cui M Q, Peng B, Qin M D 2018 J. Mol. Graph. Model. 83 84
Google Scholar
[14] Torres-Sánchez A, Vanegas J M, Arroyo M 2015 Phys. Rev. Lett. 114 258102
Google Scholar
[15] Chen Y 2016 Europhys. Lett. 116 34003
Google Scholar
[16] Yu Y X, Jin L 2008 J. Chem. Phys. 128 014901
Google Scholar
-

图 1 体积为V的长方体系统示意图
Figure 1. Schematic figure of a rectangle with volume V.

图 2 一个粒子在V内, 一个粒子在V外, 只有一个交点示意图
Figure 2. Geometry for calculating the contribution to the pressure from a pair of molecules i and j with only one intersection.

图 3 两个粒子都在V外有两个交点示意图
Figure 3. Geometry for calculating the contribution to the pressure from a pair of molecules i and j with two intersections.
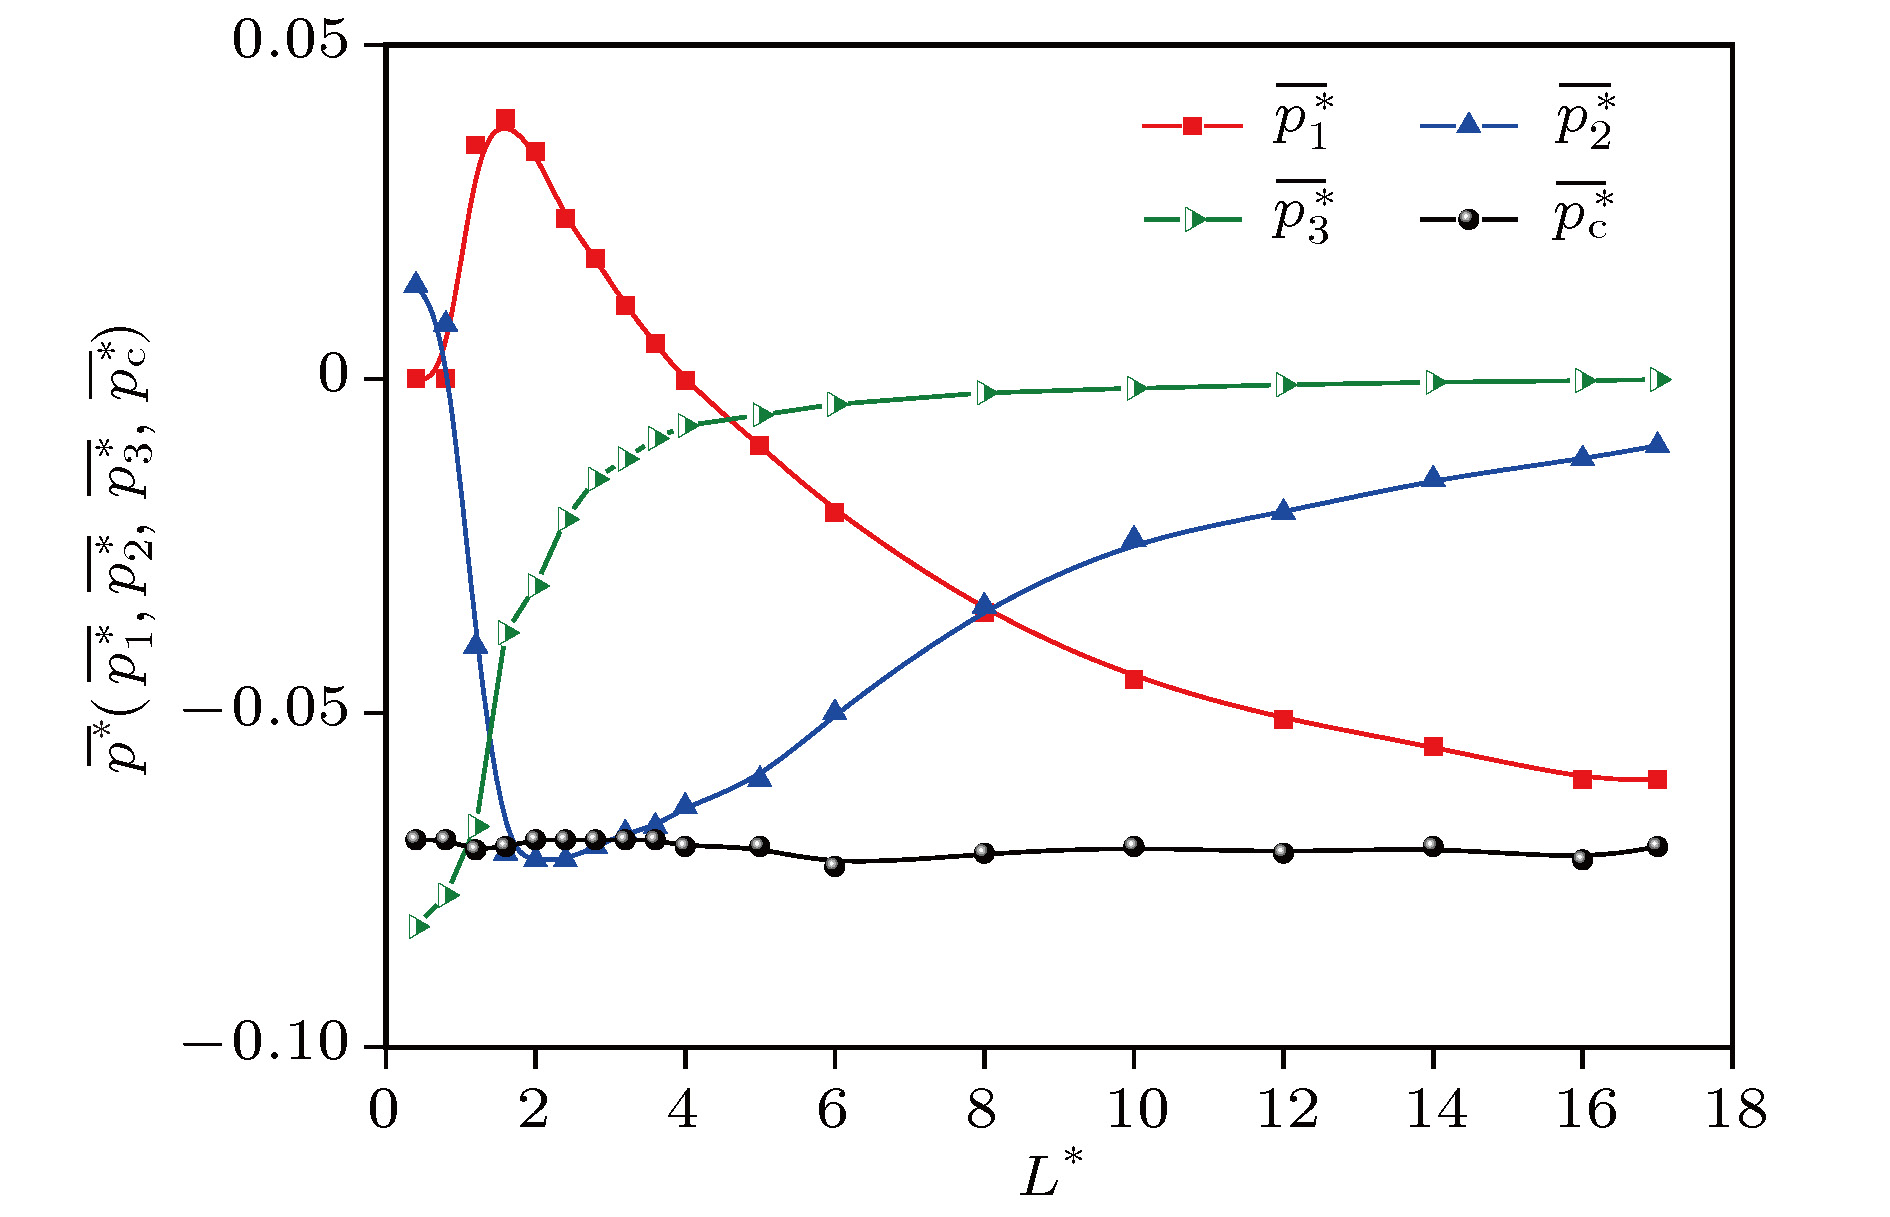
图 4
$\overline {p_1^*} $ ,$\overline {p_2^*} $ ,$\overline {p_3^*} $ ,$\overline {p_{\rm{c}}^*} $ 与${L^*}$ 的关系Figure 4. Relation between
$\overline {p_1^*} $ ,$\overline {p_2^*} $ ,$\overline {p_3^*} $ ,$\overline {p_{\rm{c}}^*} $ and${L^*}$ .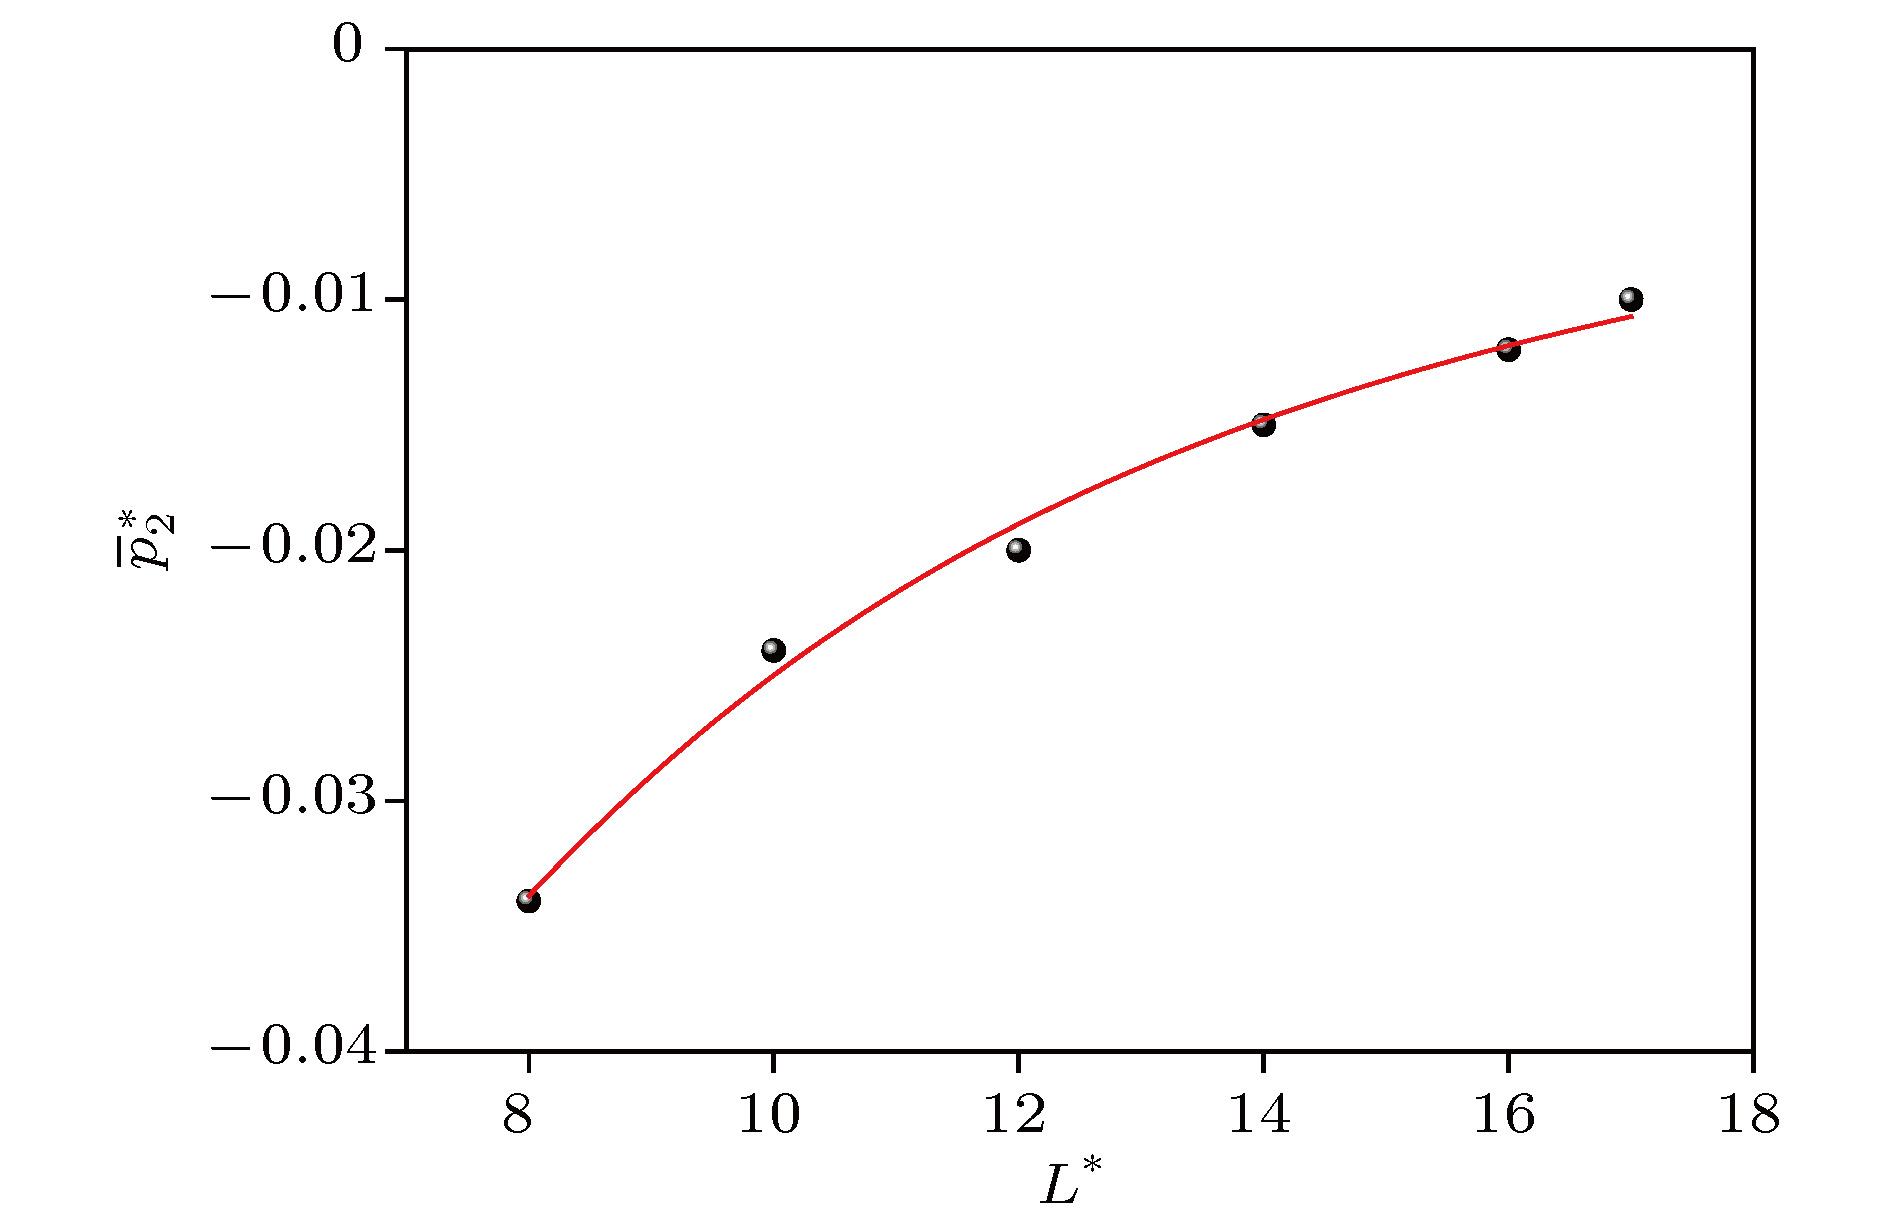
图 5
$\overline {p_2^*} $ 的拟合曲线Figure 5. Fitting curve of
$\overline {p_2^*} $ .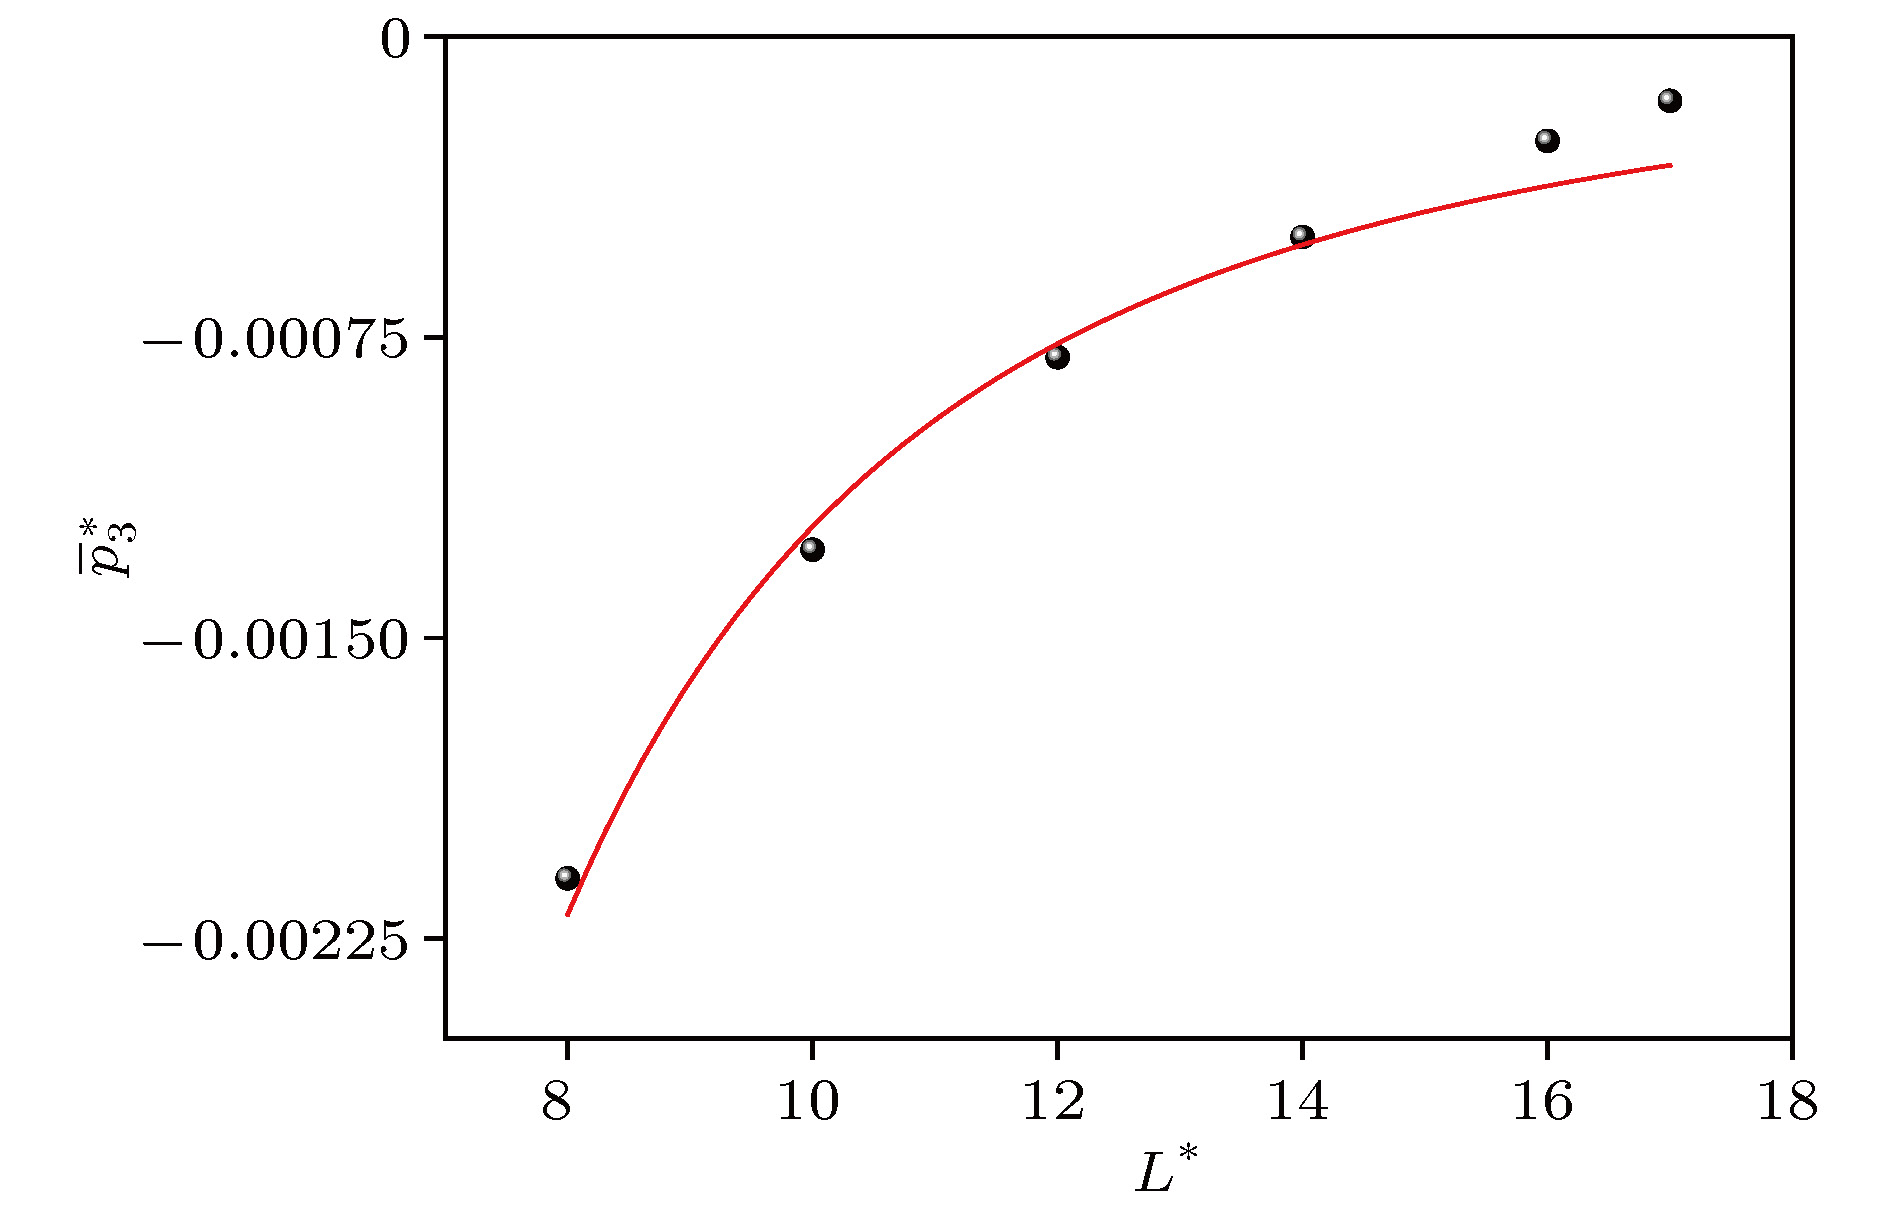
图 6
$\overline {p_3^*} $ 的拟合曲线Figure 6. Fitting curve of
$\overline {p_3^*} $ .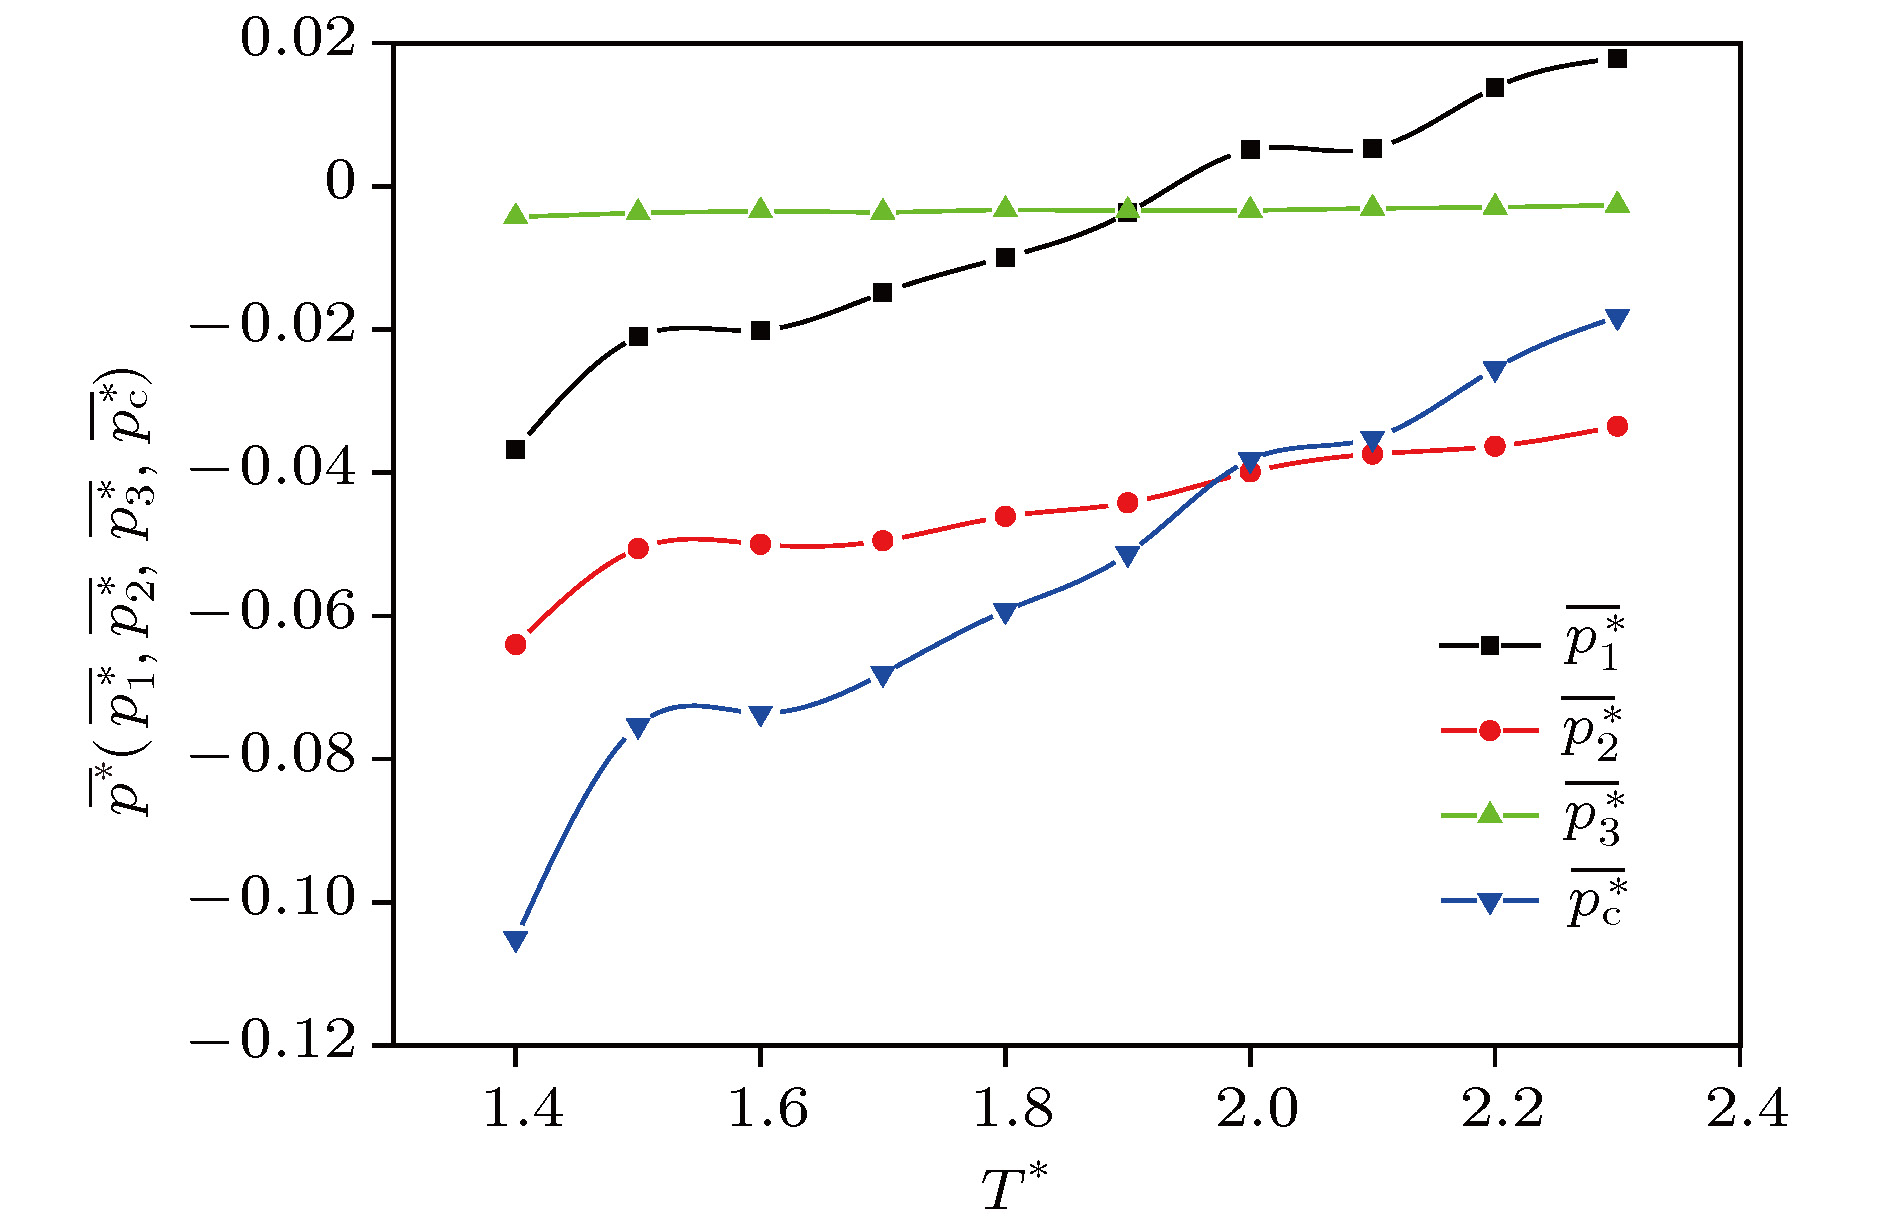
图 7
$\overline {p_1^*} $ ,$\overline {p_2^*} $ ,$\overline {p_3^*} $ ,$\overline {p_{\rm{c}}^*} $ 与${T^*}$ 的关系Figure 7. Relation between
$\overline {p_1^*} $ ,$\overline {p_2^*} $ ,$\overline {p_3^*} $ ,$\overline {p_{\rm{c}}^*} $ and${T^*}$ .表 1
$\overline {p_1^*} $ ,$\overline {p_2^*} $ ,$\overline {p_3^*} $ 和$\overline {p_{\rm{c}}^*} $ 的模拟值Table 1. Values of
$\overline {p_1^*} $ ,$\overline {p_2^*} $ ,$\overline {p_3^*} $ and$\overline {p_{\rm{c}}^*} $ given by simulation.${L^*}$ $\overline {p_1^*} $ $\overline {p_2^*} $ $\overline {p_3^*} $ $\overline {p_c^*} $ 0.4 0 0.014 –0.082 –0.069 0.8 0 0.00814 –0.0773 –0.069 1.2 0.035 –0.04 –0.067 –0.0705 1.6 0.039 –0.071 –0.038 –0.07 2 0.034 –0.072 –0.031 –0.069 2.4 0.024 –0.072 –0.021 –0.069 2.8 0.018 –0.07 –0.015 –0.069 3.2 0.011 –0.068 –0.012 –0.069 3.6 0.0053 –0.067 –0.0089 –0.069 4 –3 × 10⁻⁴ –0.064 –0.007 –0.07 5 –0.01 –0.06 –0.0054 –0.07 6 –0.02 –0.05 –0.0038 –0.073 8 –0.035 –0.034 –0.0021 –0.071 10 –0.045 –0.024 –0.0014 –0.07 12 –0.051 –0.02 –9 × 10⁻⁴ –0.071 14 –0.055 –0.015 –5 × 10⁻⁴ –0.07 16 –0.06 –0.012 –2.6 × 10⁻⁴ –0.072 17 –0.06 –0.01 –1 × 10⁻⁴ –0.07  DownLoad: CSV
-
[1] Clausius R 1870 Philosoph. Magaz. 40 122
[2] Maxwell J C 1874 Nature 10 477
Google Scholar
[3] Kirkwood J G, Buff F P T 1949 J. Chem. Phys. 17 338
Google Scholar
[4] Irving J H, Kirkwood J G 1950 J. Chem. Phys. 18 817
Google Scholar
[5] Harasima A 1958 Adv. Chem. Phys. 1 203
[6] Schofield P, Hendersen J R 1982 Proc. R. Soc. London Ser. A 379 231
Google Scholar
[7] 毛志红, 包福兵, 余霞 2013 低温工程 3 47
Google Scholar
Mao Z H, Bao F B, Yu X 2013 Cryogenics 3 47
Google Scholar
[8] 周绍华, 黄永华 2018 低温 40 49
Zhou S H, Huang Y H 2018 Chin. J. Low. Temp. Phys. 40 49
[9] Cormier J, Rickman J M, Delph T J 2001 J. Appl. Phys. 89 99
Google Scholar
[10] Cheung K S, Yip S 1991 J. Appl. Phys. 70 5688
Google Scholar
[11] Sun Z H, Wang X X, Soh K A, Wu H A 2006 Model. Simul. Mater. Sci. Eng. 14 423
Google Scholar
[12] Xu R, Liu B 2009 Acta Mech. Solida Sin. 22 644
Google Scholar
[13] Li Y F, Cui M Q, Peng B, Qin M D 2018 J. Mol. Graph. Model. 83 84
Google Scholar
[14] Torres-Sánchez A, Vanegas J M, Arroyo M 2015 Phys. Rev. Lett. 114 258102
Google Scholar
[15] Chen Y 2016 Europhys. Lett. 116 34003
Google Scholar
[16] Yu Y X, Jin L 2008 J. Chem. Phys. 128 014901
Google Scholar


 DownLoad:


Catalog
Metrics
- Abstract views: 9188
- PDF Downloads: 52
- Cited By: 0
