-
A gas pressure measurement device is built based on the gas refractive index method, and the measurement range is from 10 kPa to 100 kPa, and the device is tested by a dual-cavity comparison method. The temperature of the two vacuum chambers is separately controlled and the two cavities are connected to ensure that the gas pressures in the two cavities are the same. Using high-purity nitrogen (6N) as the gas medium, under the condition of different gas pressures, the dual-cavity comparative measurements are conducted. The results show that the optical pressure gauge has a repeatability better than 30 × 10–6, which is significantly better than the commercial capacitive pressure gauge, indicating that this method has great potential applications. Sources of error and uncertainty in the measurement are analyzed, and it is planned to design a new system to improve the measurement.
-
Keywords:
- metrology /
- gas pressure /
- gas refractive index /
- double-cavity comparison
[1] Tilford C R 1994 Metrologia 30 545
 Google Scholar
[2] Hendricks J H, Olson D A 2010 Measurement 43 664
 Google Scholar
[3] Pendrill L R 2004 Metrologia 41 S40
 Google Scholar
[4] May E F, Pitre L, Mehl J B, Moldover M R, Schmidt J W 2004 Rev. Sci. Instrum. 75 3307
 Google Scholar
[5] Andersson M, Eliasson L, Pendrill L R 1987 Appl. Opt. 26 4835
 Google Scholar
[6] Birch K P 1991 J. Opt. Soc. Am. A 8 647
 Google Scholar
[7] Fang H, Juncar P 1999 Rev. Sci. Instrum. 70 3160
 Google Scholar
[8] Fox R W, Washburn B R, Newbury N R, Hollberg L 2005 Appl. Opt. 44 7793
 Google Scholar
[9] Zhang J, Lu Z H, Menegozzi B, Wang L J 2006 Rev. Sci. Instrum. 77 083104
 Google Scholar
[10] 许玉蓉, 刘洋洋, 王进, 孙羽, 习振华, 李得天, 胡水明 2020 69 150601
 Google Scholar
Xu Y R, Liu Y Y, Wang J, Sun Y, Xi Z H, Li D T, Hu S M 2020 Acta Phys. Sin. 69 150601
 Google Scholar
[11] Egan P, Stone J A 2011 Appl. Opt. 50 3076
 Google Scholar
[12] Puchalski M, Piszczatowski K, Komasa J, Jeziorski B, Szalewicz K 2016 Phys. Rev. A 93 032515
 Google Scholar
[13] Amorski C, Casida M E, Salahub D R 1996 J. Chem. Phys. 104 5134
 Google Scholar
[14] Egan P F, Stone J A, Scherschligt J K, Harvey A H 2019 J. Vac. Sci. Technol. A 37 031603
 Google Scholar
[15] Ewing M B, Royal D D 2002 J. Chem. Thermodyn. 34 1089
 Google Scholar
-
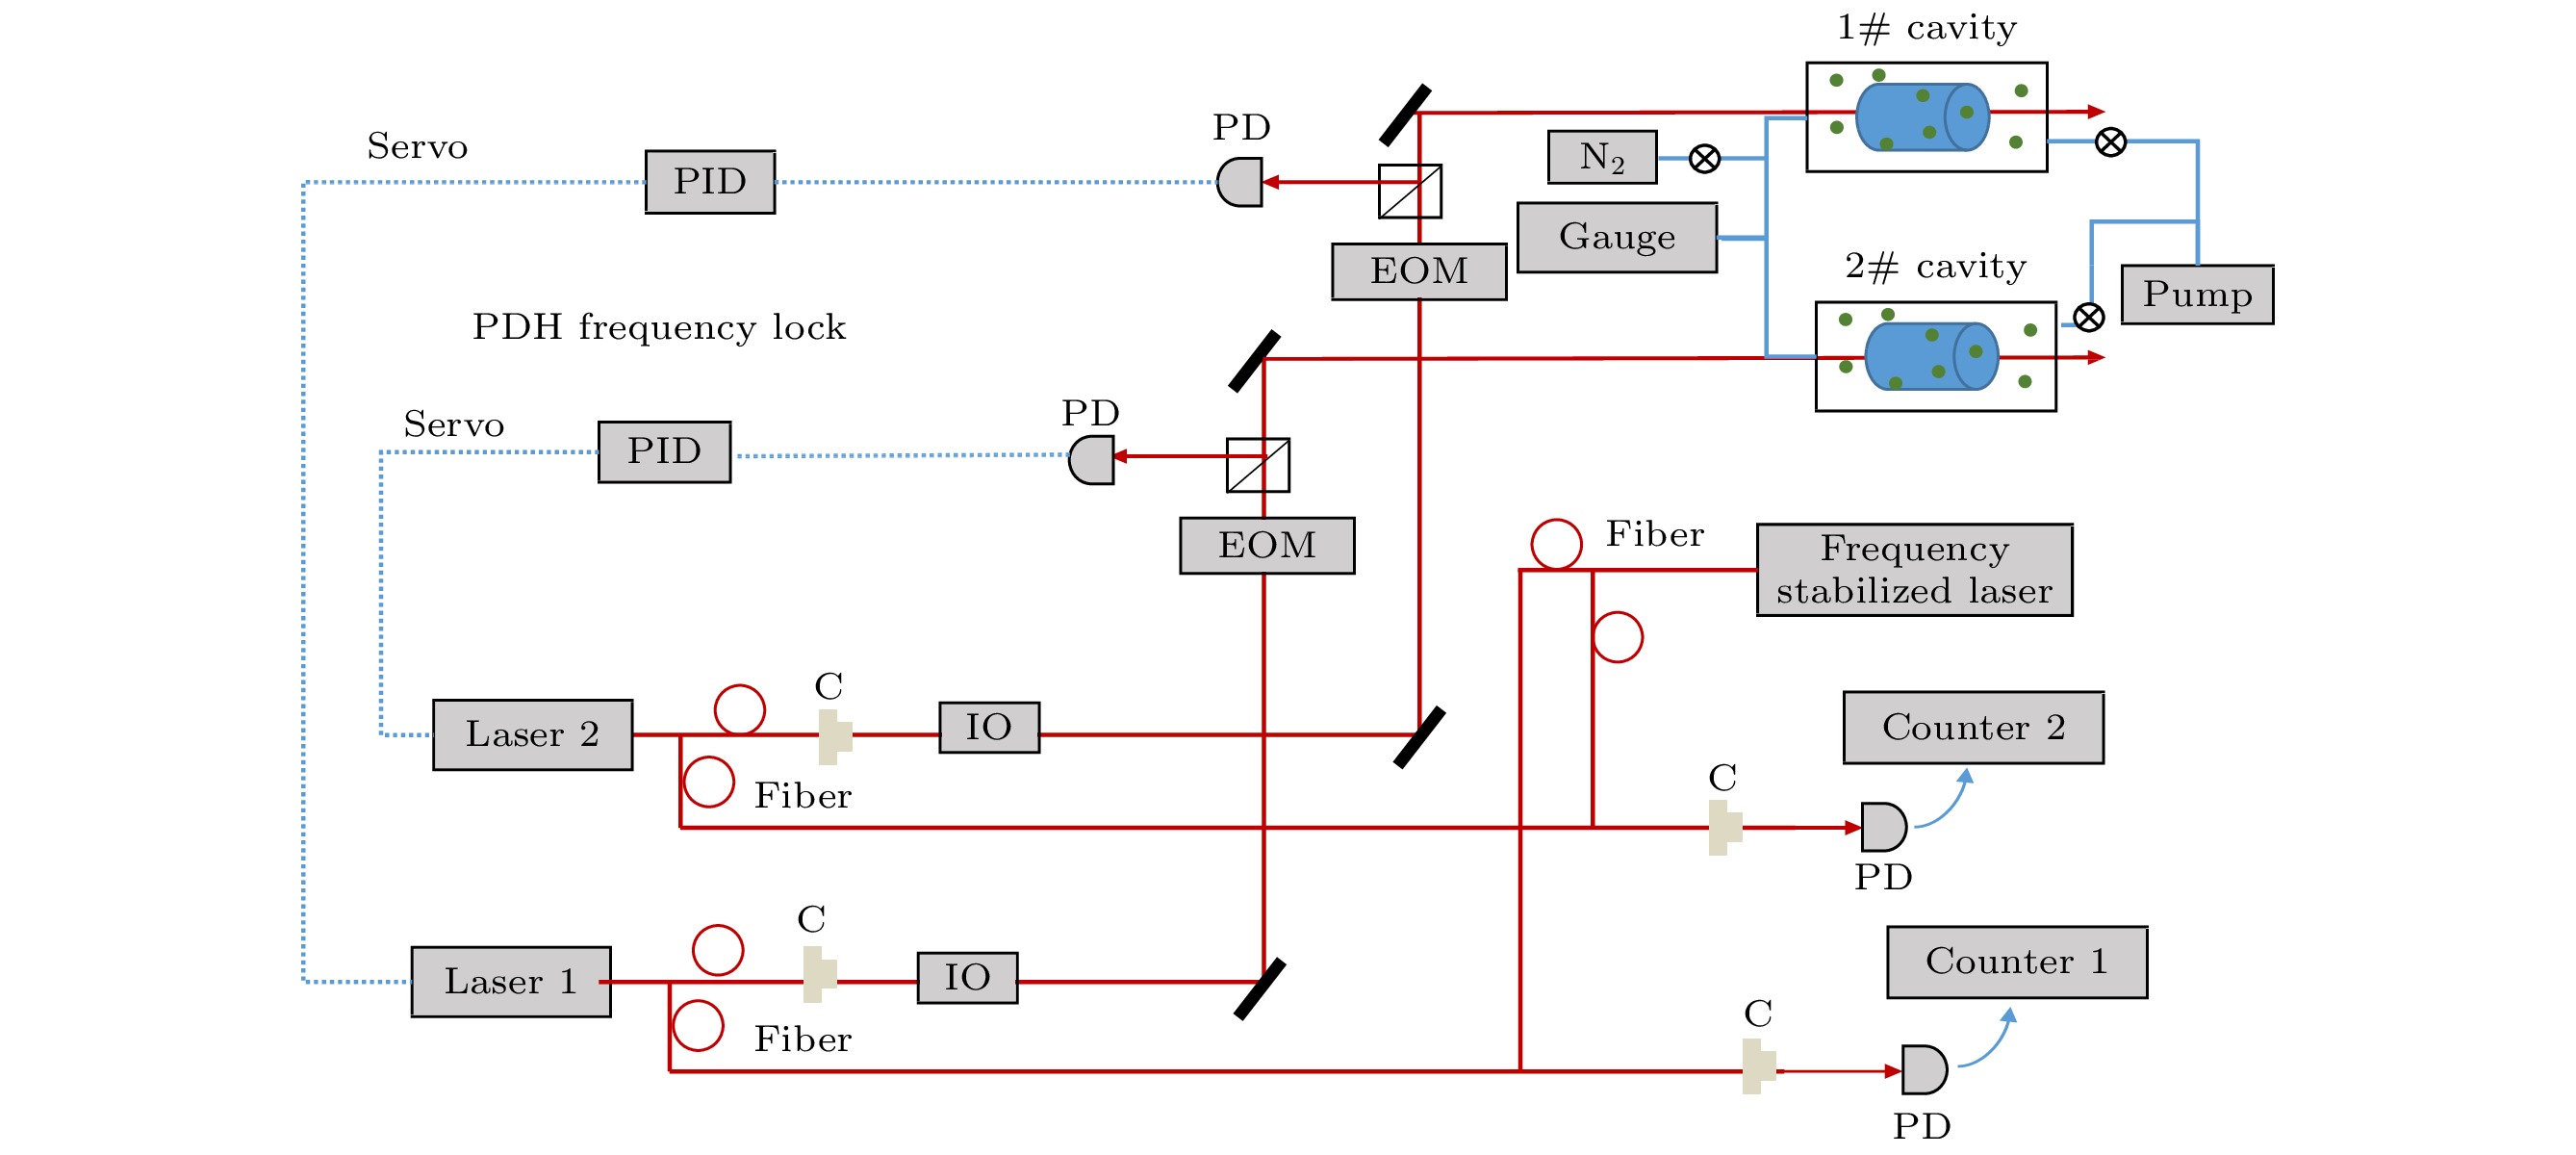
图 1 双腔比对测量光路示意图, Laser 1为NKT窄线宽激光器, Laser 2为自制ECDL, IO为隔离器, EOM为电光调制器, counter为频率计, C为光纤耦合头, PD为光电探测器
Figure 1. Schematic diagram of the optical path of the dual cavity comparison measurement. Laser 1 is an NKT narrow linewidth laser, Laser 2 is a self-made ECDL, IO is an isolator, EOM is an electro-optic modulator, counter is a frequency meter, and C is an optical fiber coupler.
图 2 (a) 真空腔体结构示意图, Sensor 1—3为控温铂电阻温度计, Sensor A—D为测温铂电阻温度计; (b)真空腔体实物图
Figure 2. (a) A schematic diagram of the vacuum cavity structure, in which sensor 1–3 are temperature-controlled platinum resistance thermometers, and sensor A–D are temperature-measured platinum resistance thermometers; (b) the physical map of the vacuum cavity.
图 5 双腔比对压力测量结果, 其中, 彩色点代表的是双腔测量得到的气体压力之差, a—f共6组重复实验, 黑色代表的是其中一次腔体测得的气体压力与薄膜压力计读数之差, 红线为双腔结果之差的平均值
$\Delta P=3.0\pm 3\;\mathrm{P}\mathrm{a}$ Figure 5. Comparison of the pressure measurement results of the dual cavities, where the colored dots represent the difference between the gas pressures measured by the two cavities, a to f totals 6 sets of repeated experiments, and the black represents the difference between the reading of pressure gauge and the gas pressures measured by one of the cavity, the red line is the average value of the pressure measurement results of the dual cavities ∆P=3.0±3 Pa.
-
[1] Tilford C R 1994 Metrologia 30 545
 Google Scholar
[2] Hendricks J H, Olson D A 2010 Measurement 43 664
 Google Scholar
[3] Pendrill L R 2004 Metrologia 41 S40
 Google Scholar
[4] May E F, Pitre L, Mehl J B, Moldover M R, Schmidt J W 2004 Rev. Sci. Instrum. 75 3307
 Google Scholar
[5] Andersson M, Eliasson L, Pendrill L R 1987 Appl. Opt. 26 4835
 Google Scholar
[6] Birch K P 1991 J. Opt. Soc. Am. A 8 647
 Google Scholar
[7] Fang H, Juncar P 1999 Rev. Sci. Instrum. 70 3160
 Google Scholar
[8] Fox R W, Washburn B R, Newbury N R, Hollberg L 2005 Appl. Opt. 44 7793
 Google Scholar
[9] Zhang J, Lu Z H, Menegozzi B, Wang L J 2006 Rev. Sci. Instrum. 77 083104
 Google Scholar
[10] 许玉蓉, 刘洋洋, 王进, 孙羽, 习振华, 李得天, 胡水明 2020 69 150601
 Google Scholar
Xu Y R, Liu Y Y, Wang J, Sun Y, Xi Z H, Li D T, Hu S M 2020 Acta Phys. Sin. 69 150601
 Google Scholar
[11] Egan P, Stone J A 2011 Appl. Opt. 50 3076
 Google Scholar
[12] Puchalski M, Piszczatowski K, Komasa J, Jeziorski B, Szalewicz K 2016 Phys. Rev. A 93 032515
 Google Scholar
[13] Amorski C, Casida M E, Salahub D R 1996 J. Chem. Phys. 104 5134
 Google Scholar
[14] Egan P F, Stone J A, Scherschligt J K, Harvey A H 2019 J. Vac. Sci. Technol. A 37 031603
 Google Scholar
[15] Ewing M B, Royal D D 2002 J. Chem. Thermodyn. 34 1089
 Google Scholar
Catalog
Metrics
- Abstract views: 5624
- PDF Downloads: 102
- Cited By: 0


 DownLoad:


