-
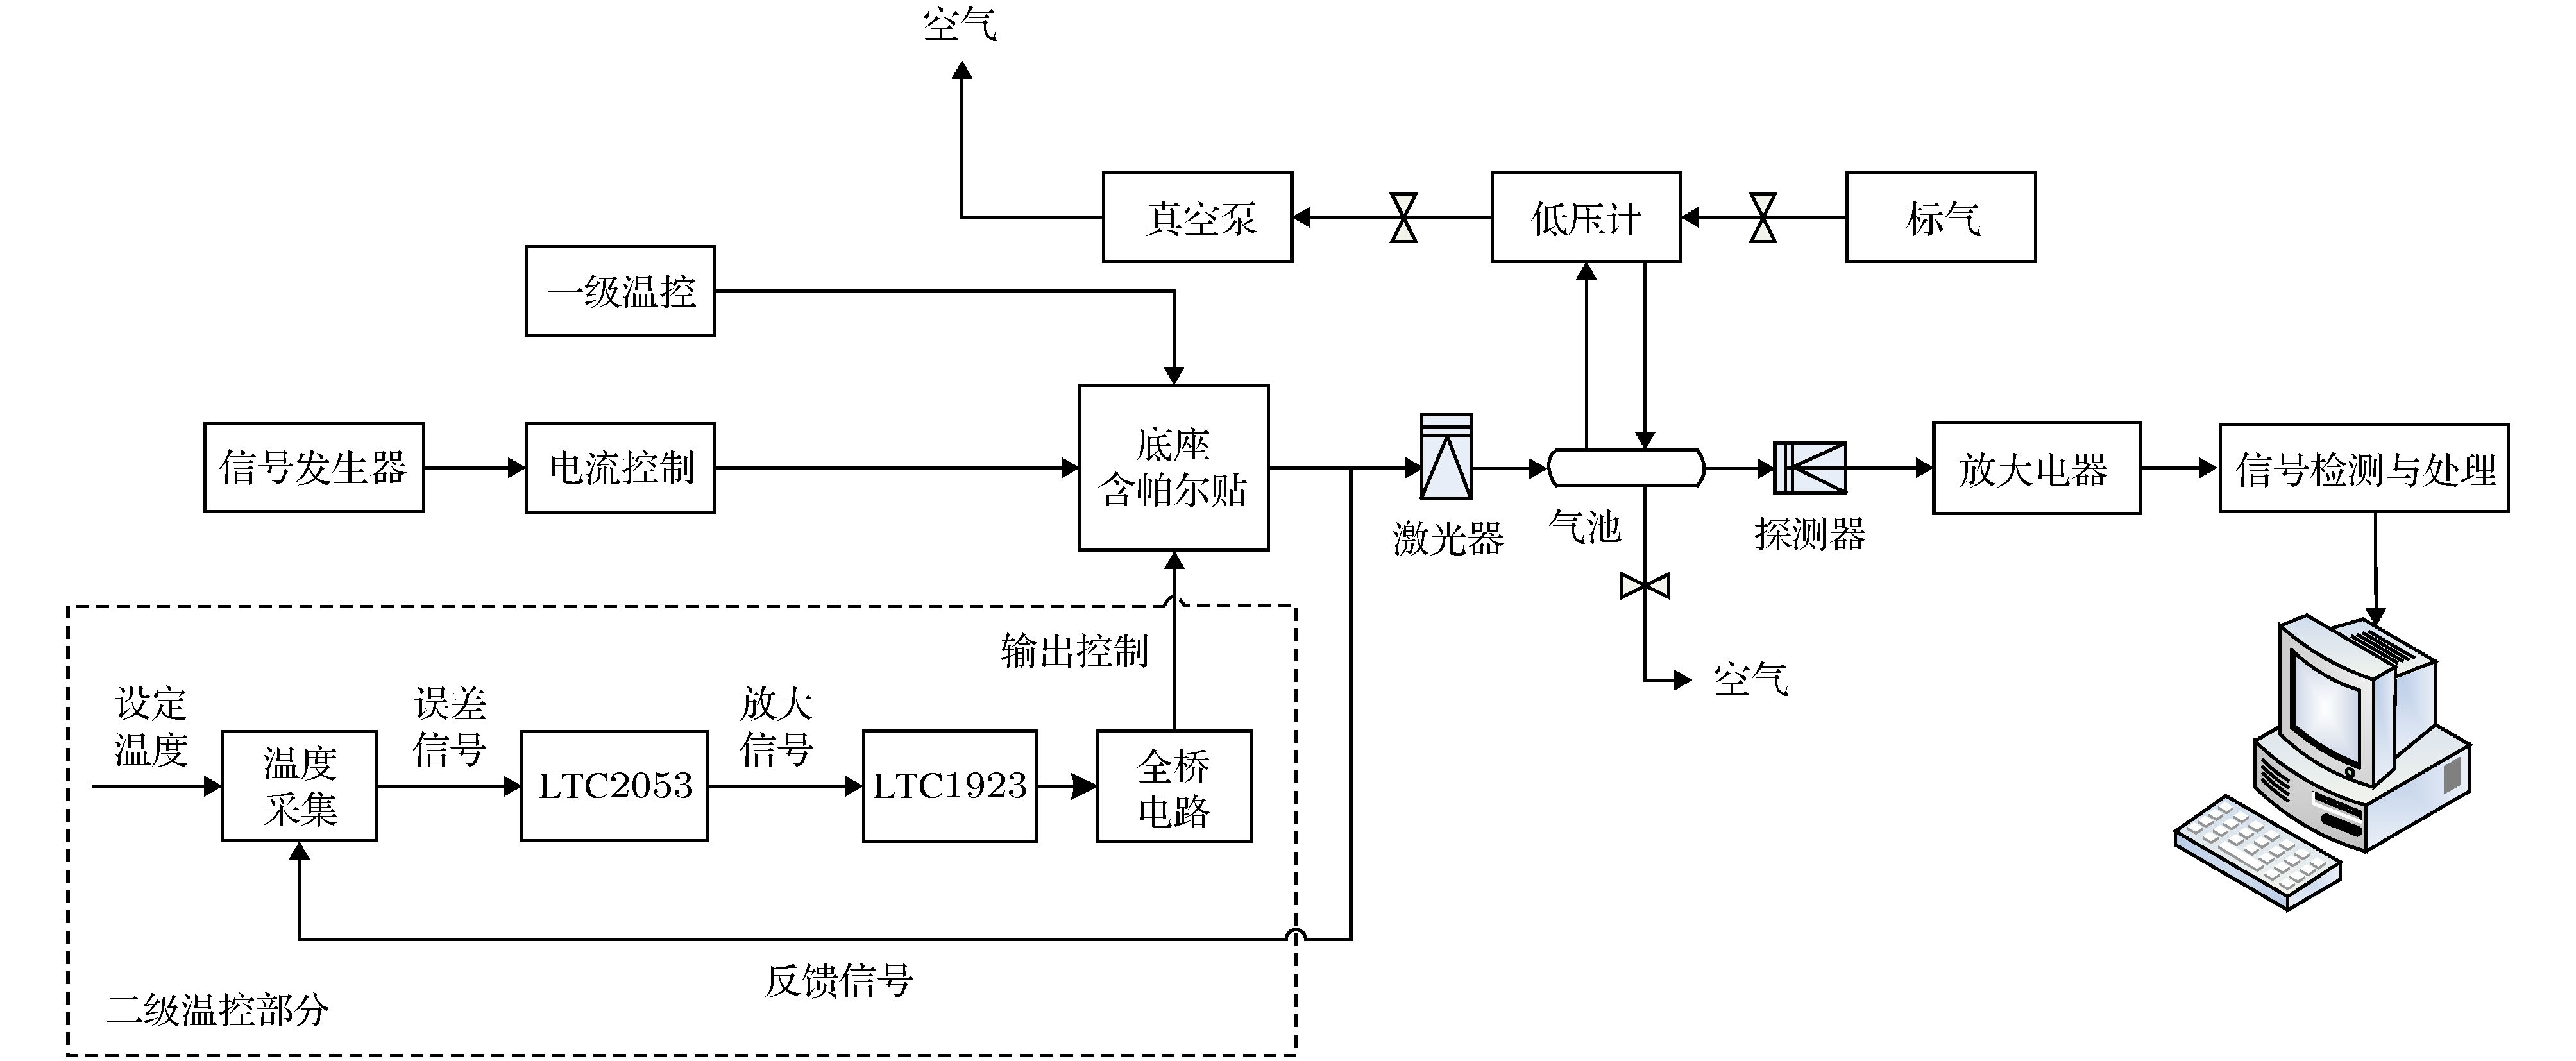
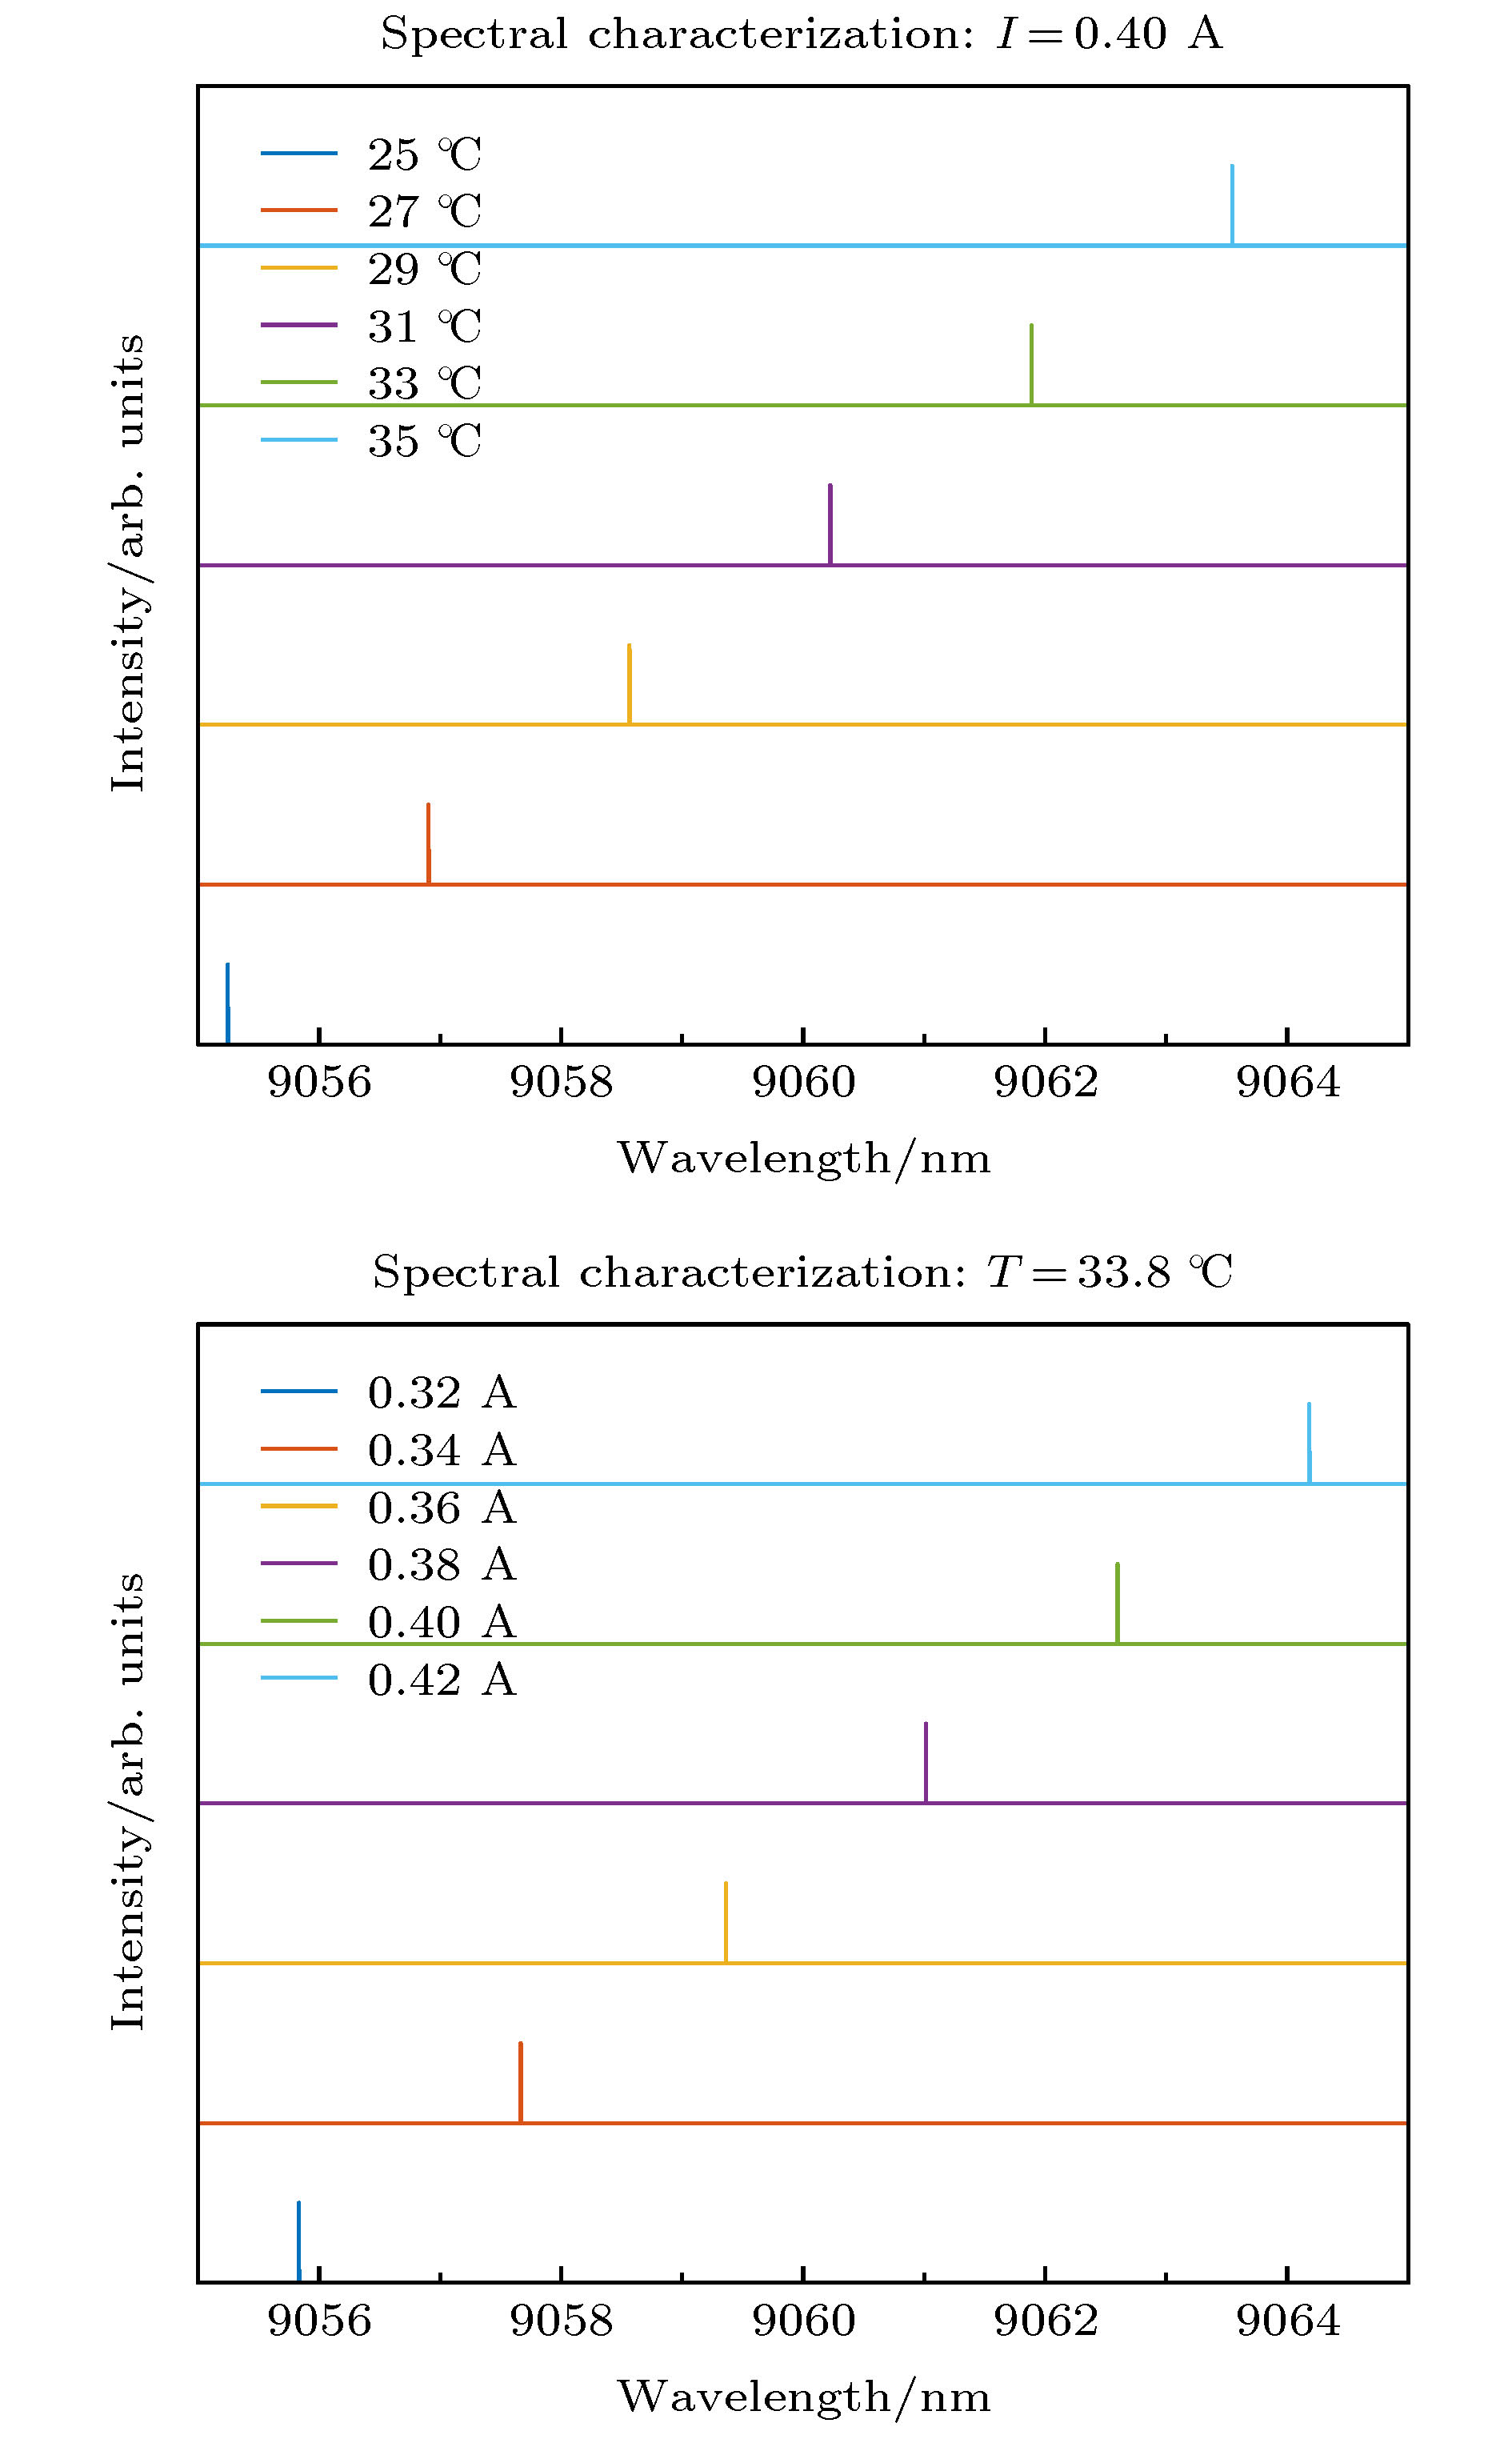
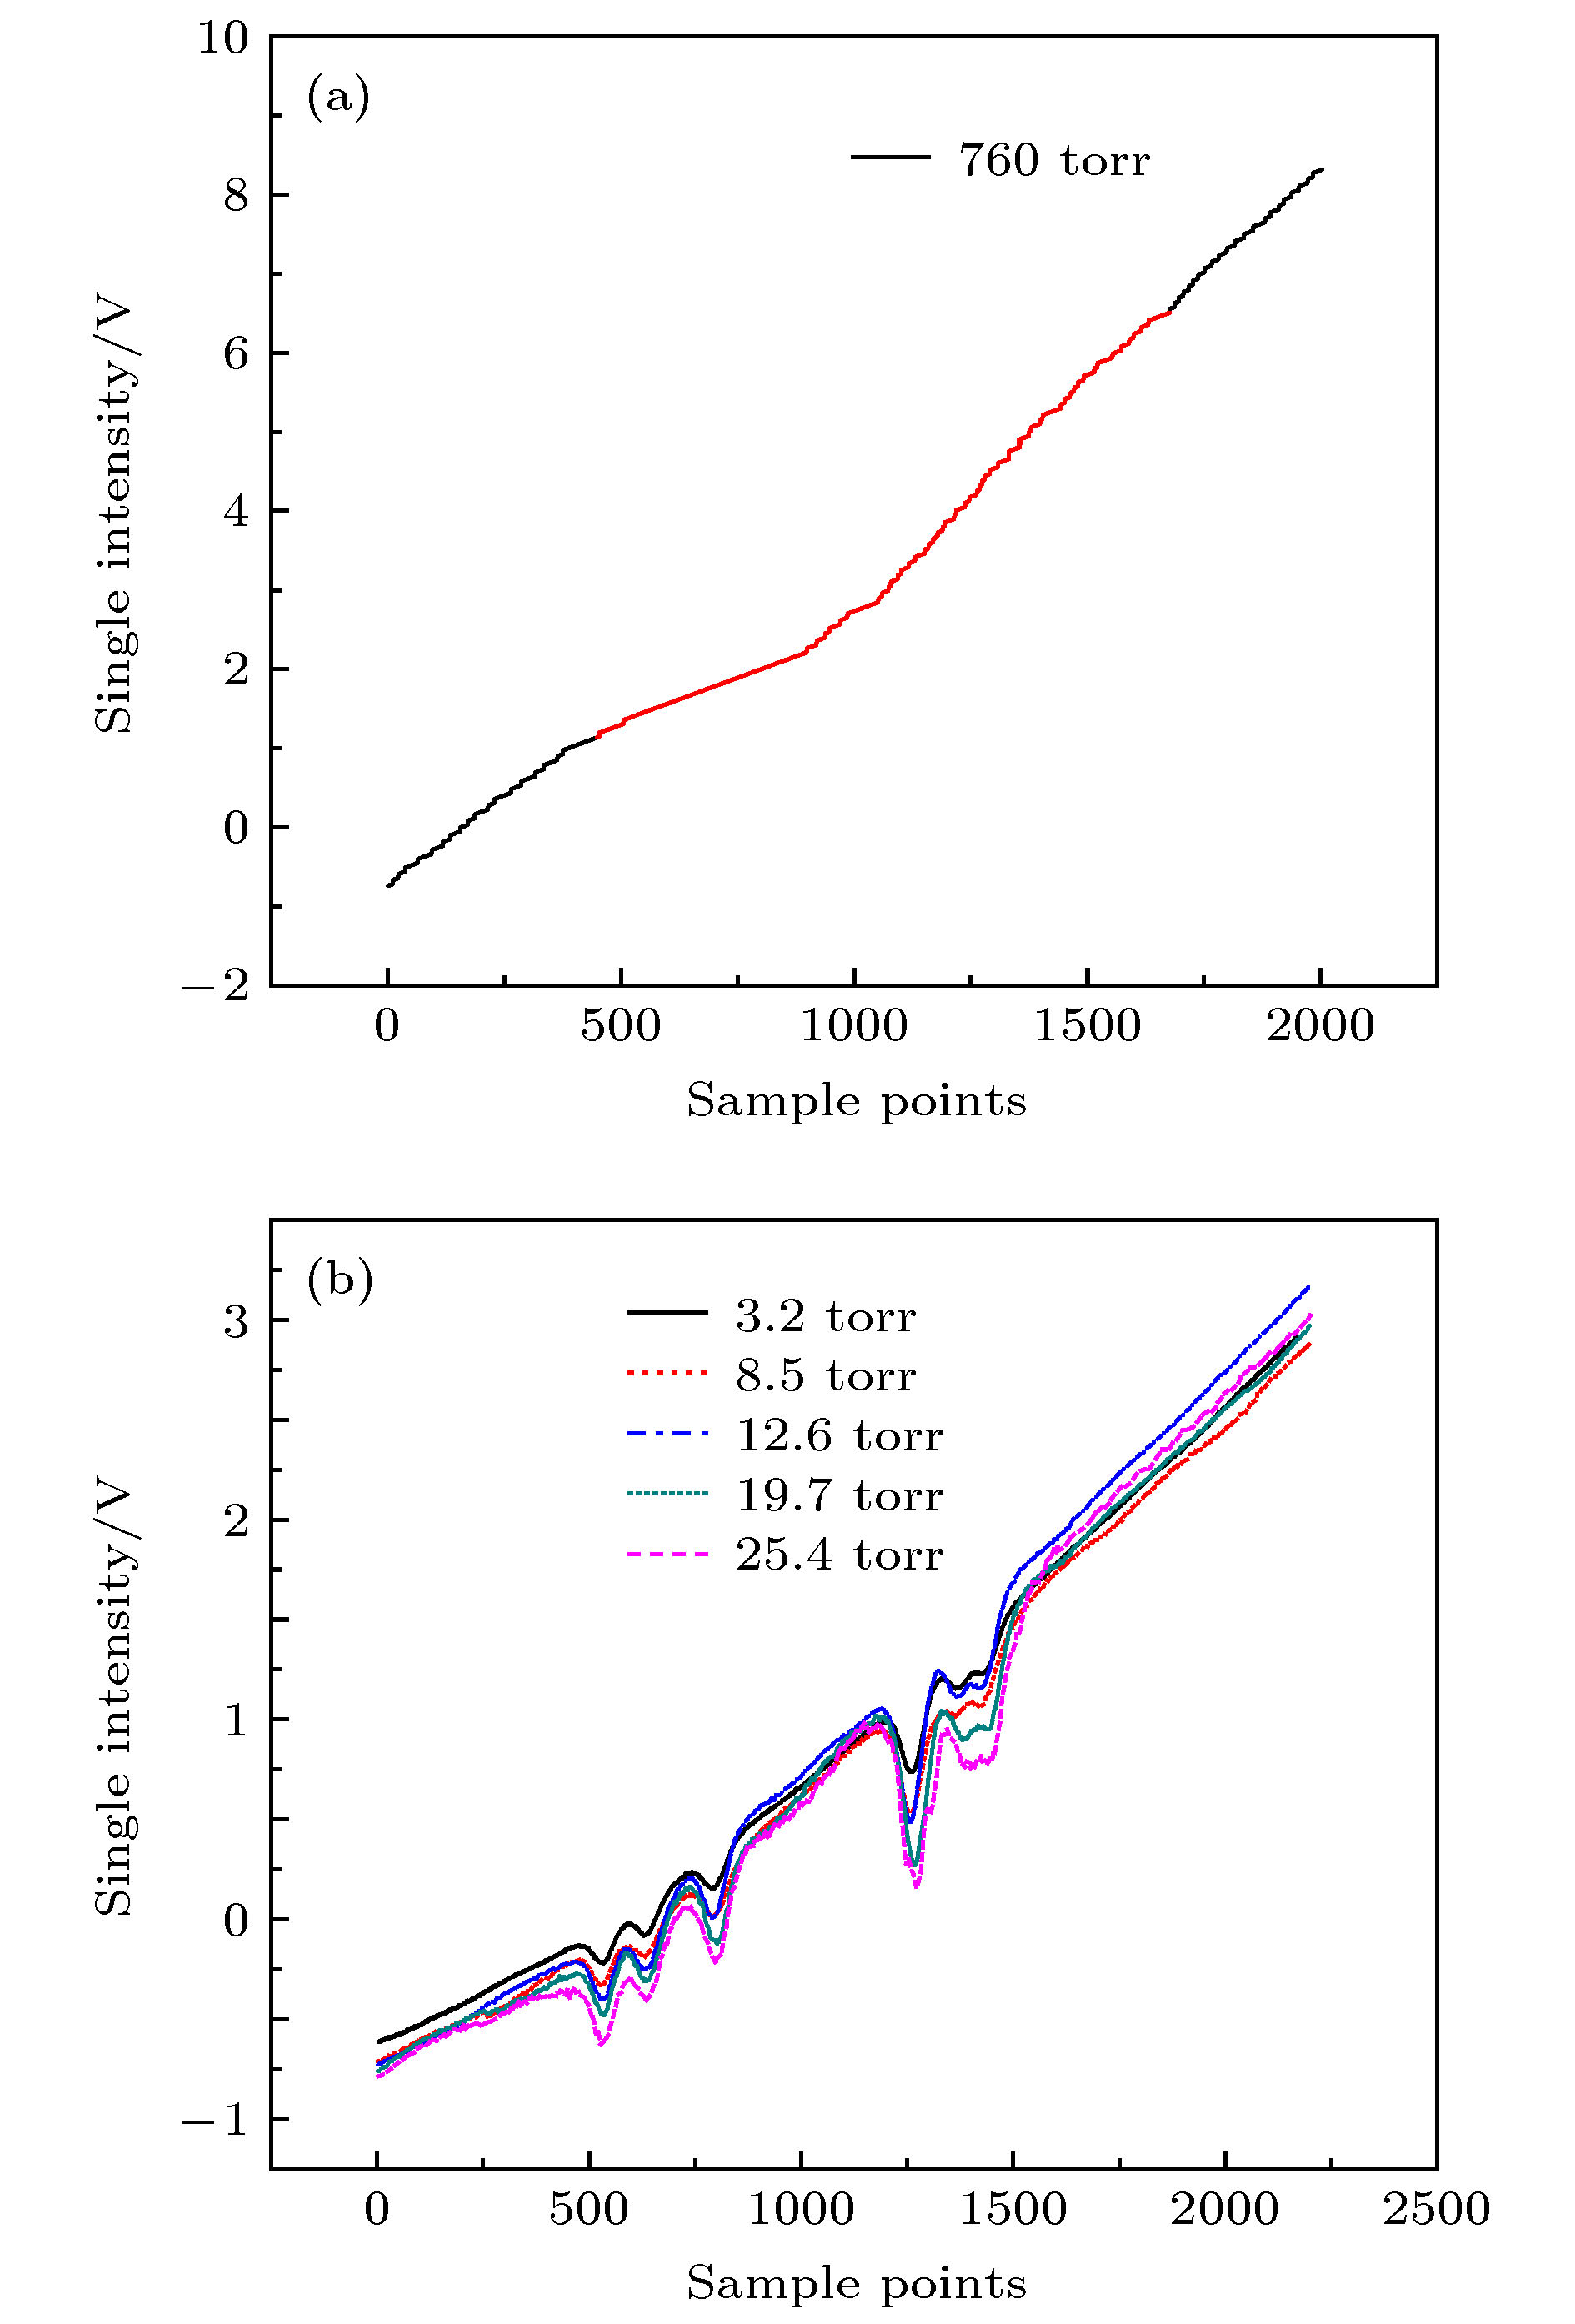
Due to the important role of NH3 in atmospheric aerosol chemistry, rapid and accurate inversion of ammonia concentration is very important for environmental issues. In this paper, a 9.05 μm continuous quantum cascade laser (QCL) is used as the light source at room temperature, and the scanned-wavelength direct-absorption tunable diode laser absorption spectroscopy (TDLAS) is used to study the spectral characteristics of the QCL at 1103.4 cm–1. A low-pressure experimental platform based on two-level temperature control was designed to measure the six aliasing absorption lines of ammonia at 1103.4 cm–1. The broadening of spectral line becomes smaller under the condition of reducing the pressure, and the aliasing spectra are separated. The line strength of each absorption line is calculated, and the measurement uncertainty is further analyzed. A method for accurate inversion of single-spectrum gas concentration by low-pressure separation was proposed for severely aliased spectra, and experimental verification was performed. By comparing the results with the HITRAN database, it is concluded that the experimental measured line strength of ammonia gas at 1103.4 cm–1 has a deviation from the database of . The uncertainty of the line intensity measurement is mainly related to the separation and extraction of aliasing absorbance, which is about 2.42%–8.92%. The deviation between the inversion concentration and the actual value under the condition of extreme low pressure is between 1% and 3%, while the calculated deviation of the line intensity value in the 2.71%–4.71% HITRAN database is about 3% to 5%. The results above indicate that the experimental data are reliable. The non-separative aliasing spectral line method is used to invert the concentration at normal pressure, and the low-pressure separated single spectral line method is used to invert the concentration at low pressure. The results of the two are compared. The analysis results show that the low-pressure separation single-spectrum spectral line inversion concentration value has smaller deviation and higher accuracy from the original concentration. The study of this method provides reference for future inversion of gas concentrations inversion in the atmospheric environment and other fields.
-
Keywords:
- laser absorption spectrum /
- quantum cascade laser /
- line intensity /
- concentration inversion
[1] 何莹 2017 博士学位论文(合肥: 中国科学技术大学)
He Y 2017 Ph. D. Dissertation (Hefei: University of Science and Technology of China) (in Chinese)
[2] Gu B J, Ju X T, Chang J, Ge Y, Vitousek P M 2015 Proc. Natl. Acad. Sci. U.S.A. 112 8792
 Google Scholar
[3] Fowler D, Coyle M, Skiba U, Sutton M A, Voss M 2013 Philos. Trans. R. Soc. B-Biol. Sci. 368 0164
[4] Vitousek P M, Menge D N L, Reed S C, Cleveland C C 2013 Philos. Trans. R.Soc. B-Biol. Sci. 368 0119
[5] Bhattacharyya P, Roy K S, Neogi S, Adhya T K, Rao K S, Manna M C 2012 Soil Tillage Res. 124 119
 Google Scholar
[6] 王飞, 黄群星, 李宁, 严建华, 池涌, 岑可法 2007 56 3867
 Google Scholar
Wang F, Huang Q X, Li N, Yan J H, Chi Y, Cen K F 2007 Acta Phys. Sin. 56 3867
 Google Scholar
[7] Tao L, Sun K, Miller D J, Khan M A, Zondlo M A 2012 Opt. Lett. 37 1358
 Google Scholar
[8] 陈玖英, 刘建国, 何亚柏, 王辽, 江强, 许振宇, 姚路, 袁松, 阮俊, 何俊锋, 戴云海, 阚瑞峰 2013 62 224206
 Google Scholar
Chen J Y, Liu J G, He Y B, Wang L, Jiang Q, Xu Z Y, Yao L, Yuan S, Ruan J, He J F, Dai Y H, Kan R F 2013 Acta Phys. Sin. 62 224206
 Google Scholar
[9] 王立明, 张玉钧, 李宏斌, 周毅, 尤坤, 何莹, 刘文清 2012 中国光学快报 10 74
Wang L M, Zhang Y J, Li H B, Zhou Y, You K, He Y, Liu W Q 2012 Chin. Opt. Lett. 10 74
[10] Webber M E, Baer D S, Hanson R K 2001 Appl. Opt. 40 2031
 Google Scholar
[11] Xu L H, Liu Z, Yakovlev 2004 Infrared Phys. Technol. 45 31
 Google Scholar
[12] Jia H, Zhao W, Cai T 2009 J. Quant.Spectrosc.Radiat. Transfer 110 347
 Google Scholar
[13] Sur R, Spearrin R M, Peng W Y, Strand C L, Jeffffries J B, Enns G M, Hanson R K 2016 J. Quant.Spectrosc.Radiat. Transfer 175 90
 Google Scholar
[14] Romh J E, Cacciani P, Taher F 2016 J. Mol.Spectrosc. 326 122
 Google Scholar
[15] Yang S, Li J, Wang R 2017 Applied Optics and Photonics China Beijing, China, October 24, 2017 p61
[16] You K, Zhang Y J, Wang L M, Li H B, He Y 2013 Adv. Mater. Res. 760 84
[17] 鲁一冰, 刘文清, 张玉钧, 张恺, 何莹, 尤坤, 李潇毅, 刘国华, 唐七星, 范博强, 余冬琪, 李梦琪 2019 光谱学与光谱分析 39 2657
Lu Y B, Liu W Q, Zhang Y J, Zhang K, He Y, You K, Li X Y, Liu G H, Tang Q X, Fan B Q, Yu D Q, Li M Q 2019 Spectrosc. Spect. Anal. 39 2657
[18] 费业泰 2015 误差理论与数据处理 (北京: 机械工业出版社) 第83页
Fei Y T 2015 Error Theory and Data Processing (Beijing: Machinery Industry Press) p83 (in Chinese)
[19] Xin Z 2005 Pap. Reg. Sci. 8418 3
[20] PogányA, Klein A, Ebert V 2015 J. Quant. Spectrosc. Radiat. Transfer 165 108
 Google Scholar
[21] GoldensteinC S, Hanson R K 2015 J. Quant. Spectrosc. Radiat. Transfer 152 127
 Google Scholar
[22] GoldensteinC S, Jeffries J B, Hanson R K 2013 J. Quant. Spectrosc. Radiat. Transfer 130 100
 Google Scholar
[23] 聂伟, 阚瑞峰, 许振宇, 杨晨光, 陈兵, 夏晖晖, 魏敏, 陈祥, 姚路, 李杭, 范雪丽, 胡佳屹 2017 66 054207
 Google Scholar
Nie W, Kan R F, Xu Z Y, Yang C G, Chen B, Xia H H, Wei M, Chen X, Yao L, Li H, Fan X L, Hu J Y 2017 Acta Phys.Sin. 66 054207
 Google Scholar
[24] 林洁丽 2001 博士学位论文 (武汉: 中国科学院研究生院 (武汉物理与数学研究所))
Lin J L 2001 Ph. D. Dissertation (Wuhan: Chinese Academy of Sciences (Wuhan Institute of Physics and Mathematics)) (in Chinese)
-
表 1 NH3吸收线及主要参数
Table 1. NH3 absorption line and main parameters.
同位素
Isotopologue波数
ν/cm–1线强
S/(cm–1/(molecule cm–2))空气展宽
γair/cm–1·atm–1自展宽
γself/cm–1·atm–1爱因斯坦系数
A/s–114NH3 1103.43047 7.119 × 10⁻²⁰ 0.0875 0.452 7.183 14NH3 1103.43432 6.131 × 10⁻²⁰ 0.0933 0.521 5.263 14NH3 1103.44122 1.514 × 10⁻¹⁹ 0.0818 0.388 8.654 14NH3 1103.46978 7.756 × 10⁻²⁰ 0.0763 0.328 9.694 14NH3 1103.47951 8.172 × 10⁻²⁰ 0.0994 0.595 2.877 14NH3 1103.48575 7.824 × 10⁻²⁰ 0.071 0.274 10.32 表 2 实验测量线强与HITRAN数据库对比分析
Table 2. Comparison of experimental measurement line strength and HITRAN database.
v0/cm–1 SH/cm–2atm–1 SM/cm–2atm–1 E/% 1103.43047 1.78339 1.70439 4.43 1103.43432 1.53589 1.46362 4.71 1103.44122 3.79275 3.6901 2.71 1103.46978 1.94297 1.87825 3.33 1103.47951 2.04718 1.97089 3.73 1103.48575 1.96001 1.88383 3.89 表 3 混叠光谱线强测量不确定度
Table 3. Uncertainty in the measurement of the intensity of the overlapping spectral line.
积分吸光度的
不确定度 ΔA/%压强的不
确定度 ΔP/%浓度的不
确定度 Δm/%光程的不
确定度 ΔL/%温度的不
确定度 ΔT/%线强的不
确定度 ΔS/%min 2.42 0.15 0.2 0.2 0.1 2.44 max 8.92 8.93 表 4 实验测量线强反演浓度与HITRAN数据库线强反演浓度作对比分析
Table 4. Contrast analysis of experimentally measured line strong inversion concentration and HITRAN database line strong inversion concentration.
实验气压/
torrHITRAN数据库线强
反演浓度 m1/ppm实验测量线强反演
浓度 m2/ppmm1与实际浓度
偏差/%m2与实际浓度
偏差/%3.2 104.98 102.55 4.98 2.55 8.5 103.89 101.94 3.89 1.94 12.6 102.90 101.40 2.90 1.40 19.7 103.08 101.07 3.08 1.07 25.4 103.22 101.00 3.22 1.00 31.8 106.23 102.88 6.23 2.88 90.7 108.53 104.91 8.53 4.91 760 108.86 104.93 8.86 4.93 表 5 不同压力、标气浓度的比较结果
Table 5. Comparison results of different pressure and standard gas concentrations.
压力P/torr 反演浓度
m1, m2/ppm标气浓度m/ppm 3.2 8.5 12.6 19.7 25.4 760 151.68 m1 156.68 155.32 154.73 154.79 154.81 159.62 m2 154.12 153.54 153.05 152.77 152.70 155.48 202.00 m1 207.13 206.67 205.14 205.45 205.86 210.97 m2 205.25 204.73 204.29 203.88 203.82 207.06 250.34 m1 256.08 255.03 254.26 254.45 254.71 260.25 m2 254.37 253.79 253.25 252.91 252.86 256.61 413.00 m1 420.47 419.73 418.18 418.55 418.94 423.77 m2 419.65 418.33 417.61 416.87 416.76 420.51 -
[1] 何莹 2017 博士学位论文(合肥: 中国科学技术大学)
He Y 2017 Ph. D. Dissertation (Hefei: University of Science and Technology of China) (in Chinese)
[2] Gu B J, Ju X T, Chang J, Ge Y, Vitousek P M 2015 Proc. Natl. Acad. Sci. U.S.A. 112 8792
 Google Scholar
[3] Fowler D, Coyle M, Skiba U, Sutton M A, Voss M 2013 Philos. Trans. R. Soc. B-Biol. Sci. 368 0164
[4] Vitousek P M, Menge D N L, Reed S C, Cleveland C C 2013 Philos. Trans. R.Soc. B-Biol. Sci. 368 0119
[5] Bhattacharyya P, Roy K S, Neogi S, Adhya T K, Rao K S, Manna M C 2012 Soil Tillage Res. 124 119
 Google Scholar
[6] 王飞, 黄群星, 李宁, 严建华, 池涌, 岑可法 2007 56 3867
 Google Scholar
Wang F, Huang Q X, Li N, Yan J H, Chi Y, Cen K F 2007 Acta Phys. Sin. 56 3867
 Google Scholar
[7] Tao L, Sun K, Miller D J, Khan M A, Zondlo M A 2012 Opt. Lett. 37 1358
 Google Scholar
[8] 陈玖英, 刘建国, 何亚柏, 王辽, 江强, 许振宇, 姚路, 袁松, 阮俊, 何俊锋, 戴云海, 阚瑞峰 2013 62 224206
 Google Scholar
Chen J Y, Liu J G, He Y B, Wang L, Jiang Q, Xu Z Y, Yao L, Yuan S, Ruan J, He J F, Dai Y H, Kan R F 2013 Acta Phys. Sin. 62 224206
 Google Scholar
[9] 王立明, 张玉钧, 李宏斌, 周毅, 尤坤, 何莹, 刘文清 2012 中国光学快报 10 74
Wang L M, Zhang Y J, Li H B, Zhou Y, You K, He Y, Liu W Q 2012 Chin. Opt. Lett. 10 74
[10] Webber M E, Baer D S, Hanson R K 2001 Appl. Opt. 40 2031
 Google Scholar
[11] Xu L H, Liu Z, Yakovlev 2004 Infrared Phys. Technol. 45 31
 Google Scholar
[12] Jia H, Zhao W, Cai T 2009 J. Quant.Spectrosc.Radiat. Transfer 110 347
 Google Scholar
[13] Sur R, Spearrin R M, Peng W Y, Strand C L, Jeffffries J B, Enns G M, Hanson R K 2016 J. Quant.Spectrosc.Radiat. Transfer 175 90
 Google Scholar
[14] Romh J E, Cacciani P, Taher F 2016 J. Mol.Spectrosc. 326 122
 Google Scholar
[15] Yang S, Li J, Wang R 2017 Applied Optics and Photonics China Beijing, China, October 24, 2017 p61
[16] You K, Zhang Y J, Wang L M, Li H B, He Y 2013 Adv. Mater. Res. 760 84
[17] 鲁一冰, 刘文清, 张玉钧, 张恺, 何莹, 尤坤, 李潇毅, 刘国华, 唐七星, 范博强, 余冬琪, 李梦琪 2019 光谱学与光谱分析 39 2657
Lu Y B, Liu W Q, Zhang Y J, Zhang K, He Y, You K, Li X Y, Liu G H, Tang Q X, Fan B Q, Yu D Q, Li M Q 2019 Spectrosc. Spect. Anal. 39 2657
[18] 费业泰 2015 误差理论与数据处理 (北京: 机械工业出版社) 第83页
Fei Y T 2015 Error Theory and Data Processing (Beijing: Machinery Industry Press) p83 (in Chinese)
[19] Xin Z 2005 Pap. Reg. Sci. 8418 3
[20] PogányA, Klein A, Ebert V 2015 J. Quant. Spectrosc. Radiat. Transfer 165 108
 Google Scholar
[21] GoldensteinC S, Hanson R K 2015 J. Quant. Spectrosc. Radiat. Transfer 152 127
 Google Scholar
[22] GoldensteinC S, Jeffries J B, Hanson R K 2013 J. Quant. Spectrosc. Radiat. Transfer 130 100
 Google Scholar
[23] 聂伟, 阚瑞峰, 许振宇, 杨晨光, 陈兵, 夏晖晖, 魏敏, 陈祥, 姚路, 李杭, 范雪丽, 胡佳屹 2017 66 054207
 Google Scholar
Nie W, Kan R F, Xu Z Y, Yang C G, Chen B, Xia H H, Wei M, Chen X, Yao L, Li H, Fan X L, Hu J Y 2017 Acta Phys.Sin. 66 054207
 Google Scholar
[24] 林洁丽 2001 博士学位论文 (武汉: 中国科学院研究生院 (武汉物理与数学研究所))
Lin J L 2001 Ph. D. Dissertation (Wuhan: Chinese Academy of Sciences (Wuhan Institute of Physics and Mathematics)) (in Chinese)
Catalog
Metrics
- Abstract views: 11959
- PDF Downloads: 102
- Cited By: 0


 DownLoad:


