-
In order to obtain a new imaging strategy of the Fourier telescope (FT) with a better imaging quality and a less imaging time, we optimize and compare three down-sampling imaging strategies in this paper: the compressed sensing method (CS), the low-frequency full sampling method (LF) and the variable-density random sampling method (VD), which are different from the traditional Fourier telescope in both of the image quality and the imaging time. The analytical methods are as follows: based on the target’s spectral data obtained from the field experiment of traditional FT, three down-sampling methods (LF, VD and CS) are used to reconstruct the target’s images according to their own sampling modes and reconstruction methods, respectively; the differences between the three down-sampling methods and the traditional FT regarding the image quality are compared by the instinctive observation and the Strehl ratio; based on the analysis of the imaging time, the differences between the three down-sampling methods and the traditional FT regarding the imaging time are preliminarily compared. The analysis shows that: 1) the image quality of the compressed sensing method is better than that of the other two down-sampling methods (LF and VD), slightly lower than that of the traditional imaging; 2) although the image quality of the compressed sensing method is slightly lower than that of the traditional FT, its imaging time is much lower than that of the traditional FT; 3) the field data used in the analysis contain noises, which means that the reconstruction methods of the above three down-sampling strategies have a better robustness to the noises. Based on the above results, it can be seen that the Fourier telescope based on compressed sensing (CS-FT) is an excellent imaging strategy which can greatly reduce the imaging time in the condition with actual noises.
-
Keywords:
- synthetic aperture imaging /
- Fourier telescope /
- image reconstruction techniques /
- compressed sensing
[1] Louis S 1991 Appl. Opt. 30 206
 Google Scholar
[2] Campbell B F, Rubin L, Holmes R B 1995 Appl. Opt. 34 5932
 Google Scholar
[3] Rider C D, Jingle C, Nielson E 1996 Proceeding of the 1996 p147
[4] Holmes R B, Ma S, Bhowmik A, et al. 1996 J. Opt. Soc. Am. 13 351
 Google Scholar
[5] Brinkley T J, Sand1er D Effect 1999 SPIE 3815 42
[6] Bakut P A, Mandrosov V I 1999 SPIE 3815 49
[7] Cuellar E L, Stapp J, Cooper J 2005 SPIE 5896 58960D
[8] Mandrosov V I, Bakut P A, Gamiz V I 2001 SPIE 4167 192
[9] Be1en'kii M, Hughes K, Brinkley T, et al. 2002 SPIE 4821 62
[10] Ford S D, Voelz D G, Gamiz V L, et al. 1999 SPIE 3815 2
[11] Gamiz V L, Holmes R B, Czyzak S R, et al. 2000 SPIE 4091 304
[12] Thornton M A, Oldenettel J R, Hult D W, et al. 2002 SPIE 4489 78
[13] Stapp J, Spivey B, Chen L, et al. 2006 SPIE 6307 630701-1
[14] Spivey B, Stapp J, Sandler D 2006 SPIE 6307 630702-1
[15] Cuellar E L, Cooper J, Mathis J, et al. 2008 SPIE 7094 70940G-1
[16] Candes E J, Wakin M B 2008 IEEE Signal Processing Mag. 25 21
[17] Romberg J 2008 IEEE Signal Processing Mag. 25 14
[18] Lustig M, Donoho D, Pauly J M 2007 Mag. Reson. Med. 58 1182
 Google Scholar
[19] Qi D, Sha W 2009 Mathematics 1 1
[20] Qu X B, Zhang W R, Guo D, Cai C B, Cai S H, Chen Z 2010 Inverse Prob. Sci. Eng. 18 737
 Google Scholar
[21] 刘欣悦, 董磊, 王建立 2010 光学精密工程 18 521
Liu X Y, Dong L, Wang J L 2010 Optics and Precision Engineering 18 521
[22] Lu C M, Gao X, Tang J, et al. 2012 SPIE 8551 855110-1
[23] Li Y, Xiangli B, Zhang W X, et al. 2013 SPIE 887788770J-1
[24] Zhou Z S, Xiangli B, Zhang W X, et al. 2013 SPIE 8905 89052X-1
[25] Yu S H, Dong L, Liu X Y, Lin X D, Meng H R, Zhong X 2016 Appl. Opt. 55 6654
[26] Donoho D, Maleki A, Shahram M 2018 WAVELAB 850 http://statweb.stanford.edu/~wavelab/Wavelab_850/index_wavelab850.html
[27] 董磊, 刘欣悦, 陈宝刚等 2011 光子学报 40 1317
Dong L, Liu X Y, Chen B G, et al. 2011 Acta Photon. Sin. 40 1317
[28] 董磊, 刘欣悦, 林旭东等 2012 光学学报 32 32 0201004-1
Dong L, Liu X Y, Lin X D, et al. 2012 Acta Opt. Sin. 32 0201004-1
-
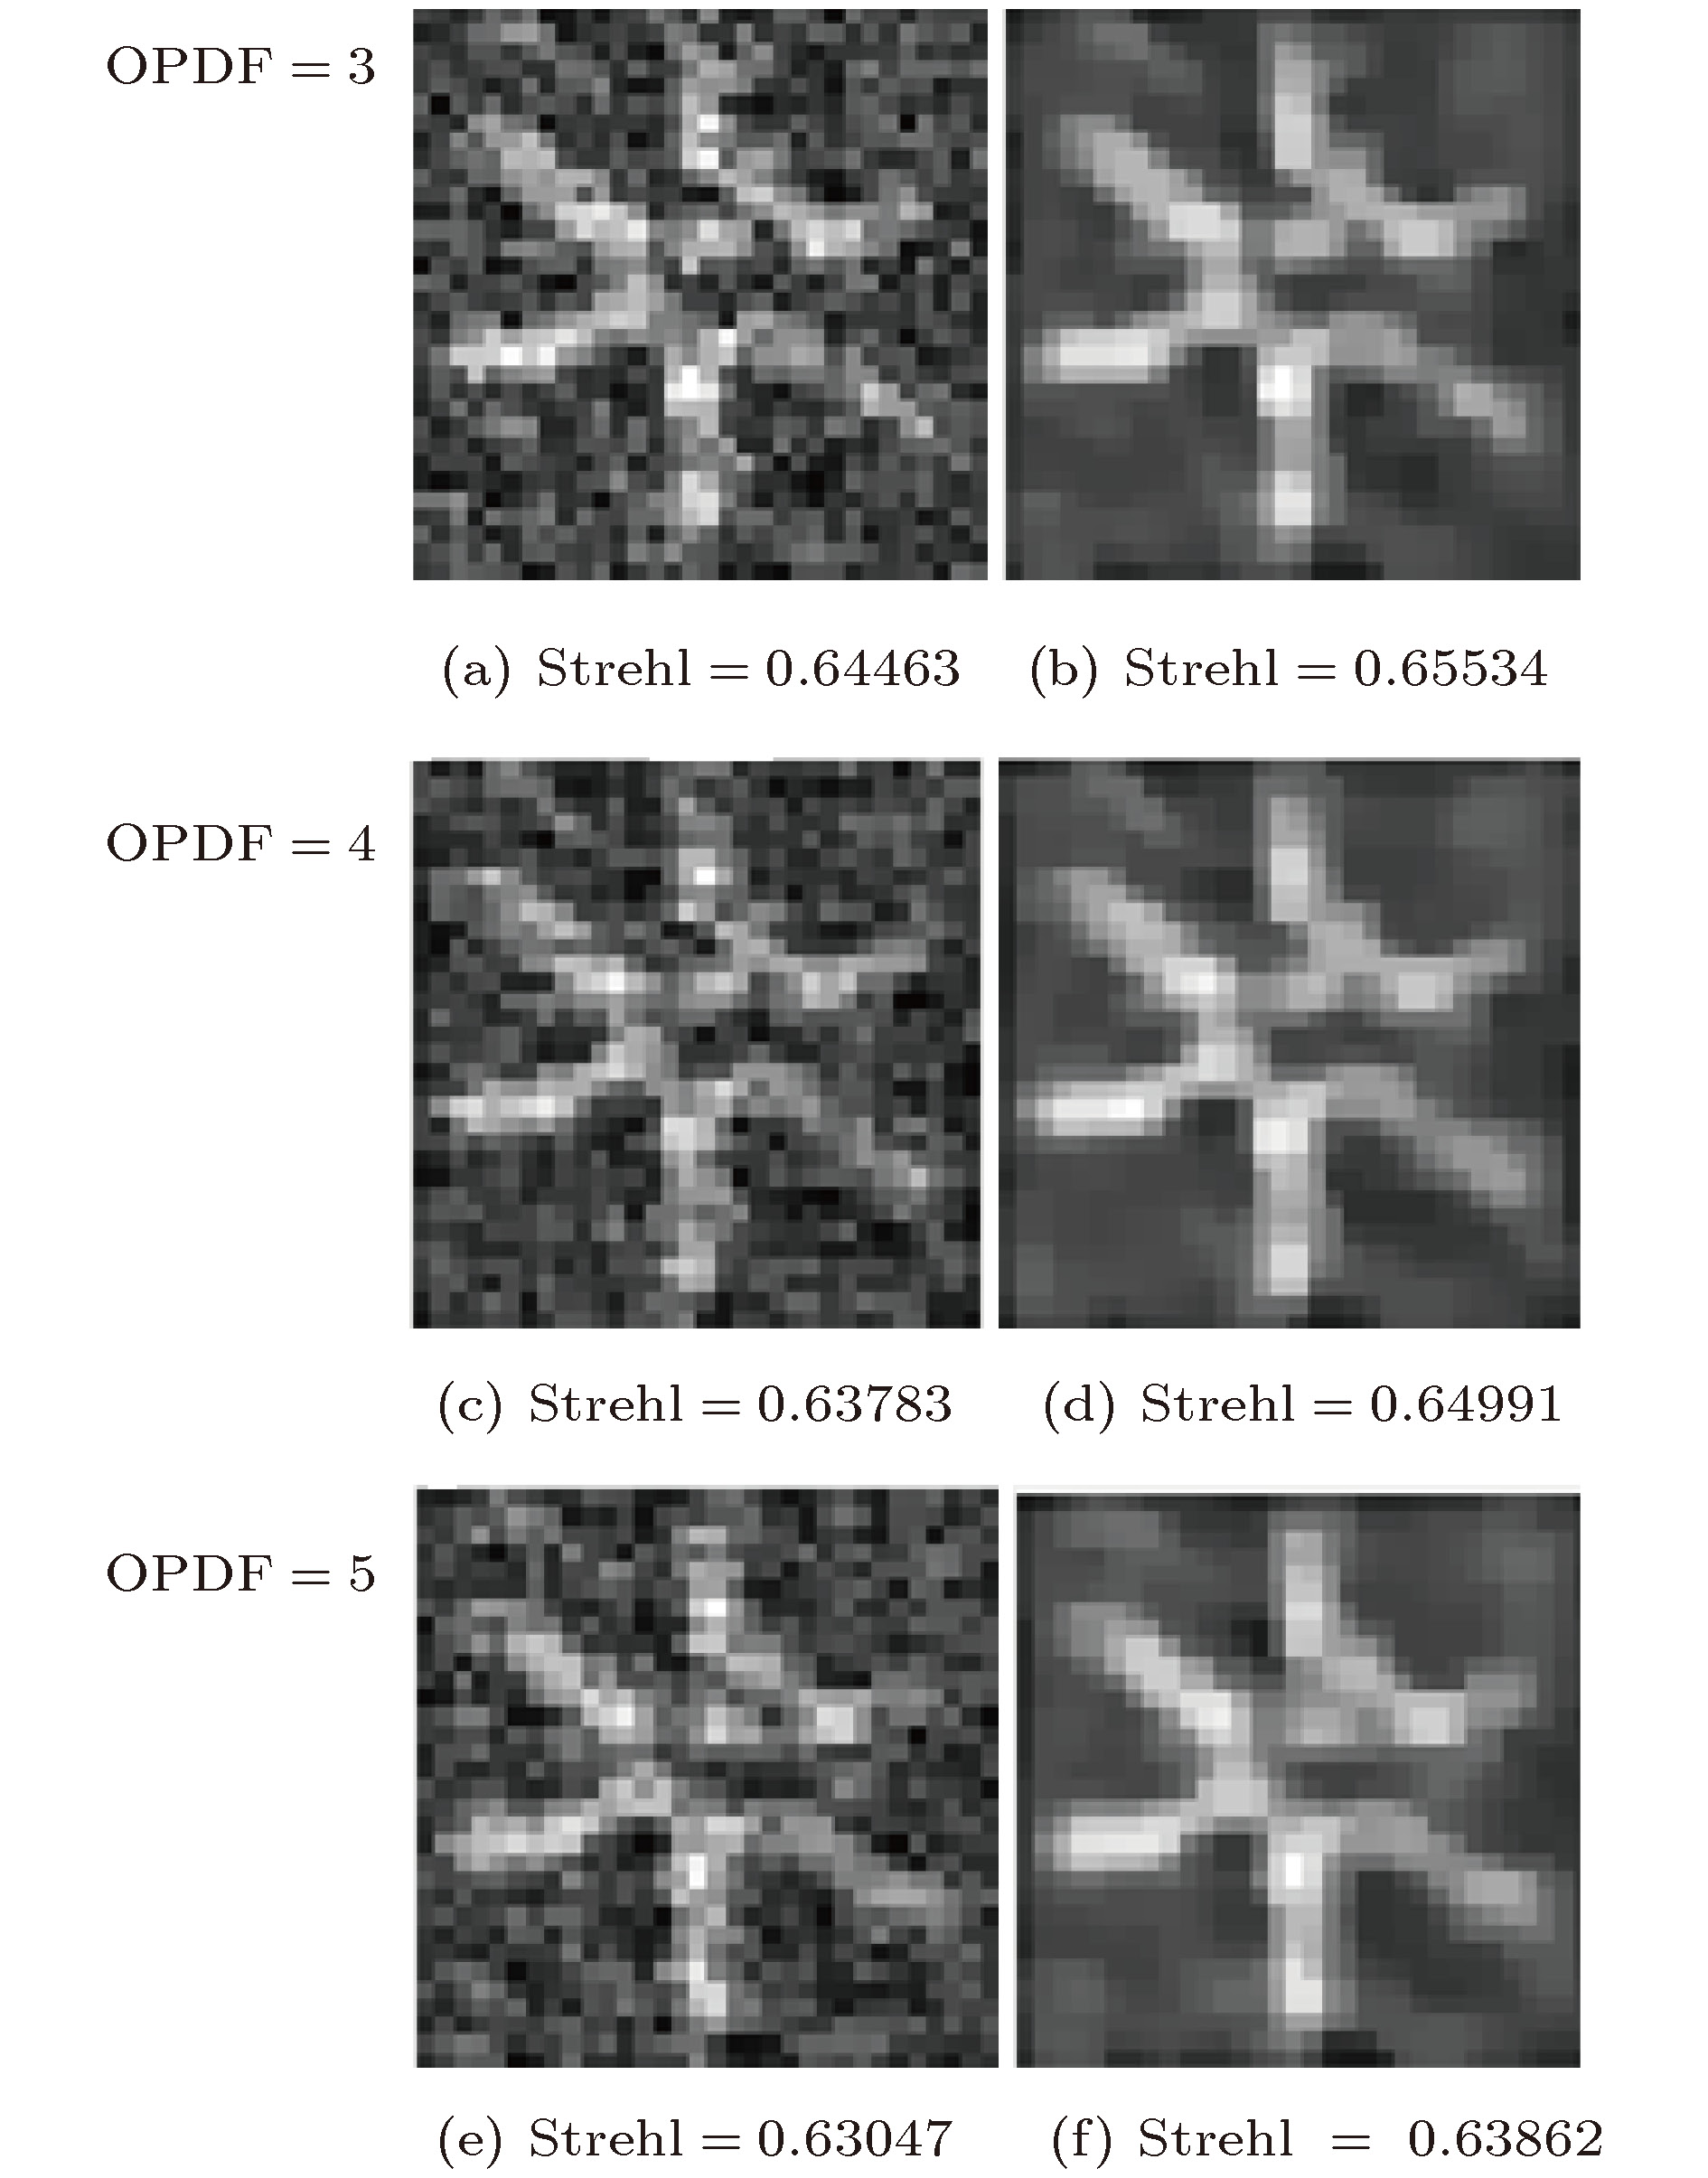
图 9 OPDF的影响 (a) 和 (b) 分别是OPDF = 3时的VD图像和CS图像; (c) 和 (d) 分别是OPDF = 4时的VD图像和CS图像; (e) 和 (f) 分别是OPDF = 5时的VD图像和CS图像
Figure 9. The effect of the OPDF: (a) and (b) are the VD image and the CS image, respectively, when OPDF = 3; (c) and (d) are the VD image and the CS image, respectively, when OPDF = 4; (e) and (f) are the VD image and the CS image, respectively, when OPDF = 5
图 10 LSR的影响 (a) 和 (b) 分别是LSR = 0时的VD图像和CS图像; (c) 和 (d) 分别是LSR = 0.1时的VD图像和CS图像; (e) 和 (f) 分别是LSR = 0.3时的VD图像和CS图像; (g) 和 (h) 分别是LSR = 0.4时的VD图像和CS图像
Figure 10. The effect of the LSR: (a) and (b) are the VD image and the CS image, respectively, when LSR = 0; (c) and (d) are the VD image and the CS image, respectively, when LSR = 0.1; (e) and (f) are the VD image and the CS image, respectively, when LSR = 0.3; (g) and (h) are the VD image and the CS image, respectively, when LSR = 0.4
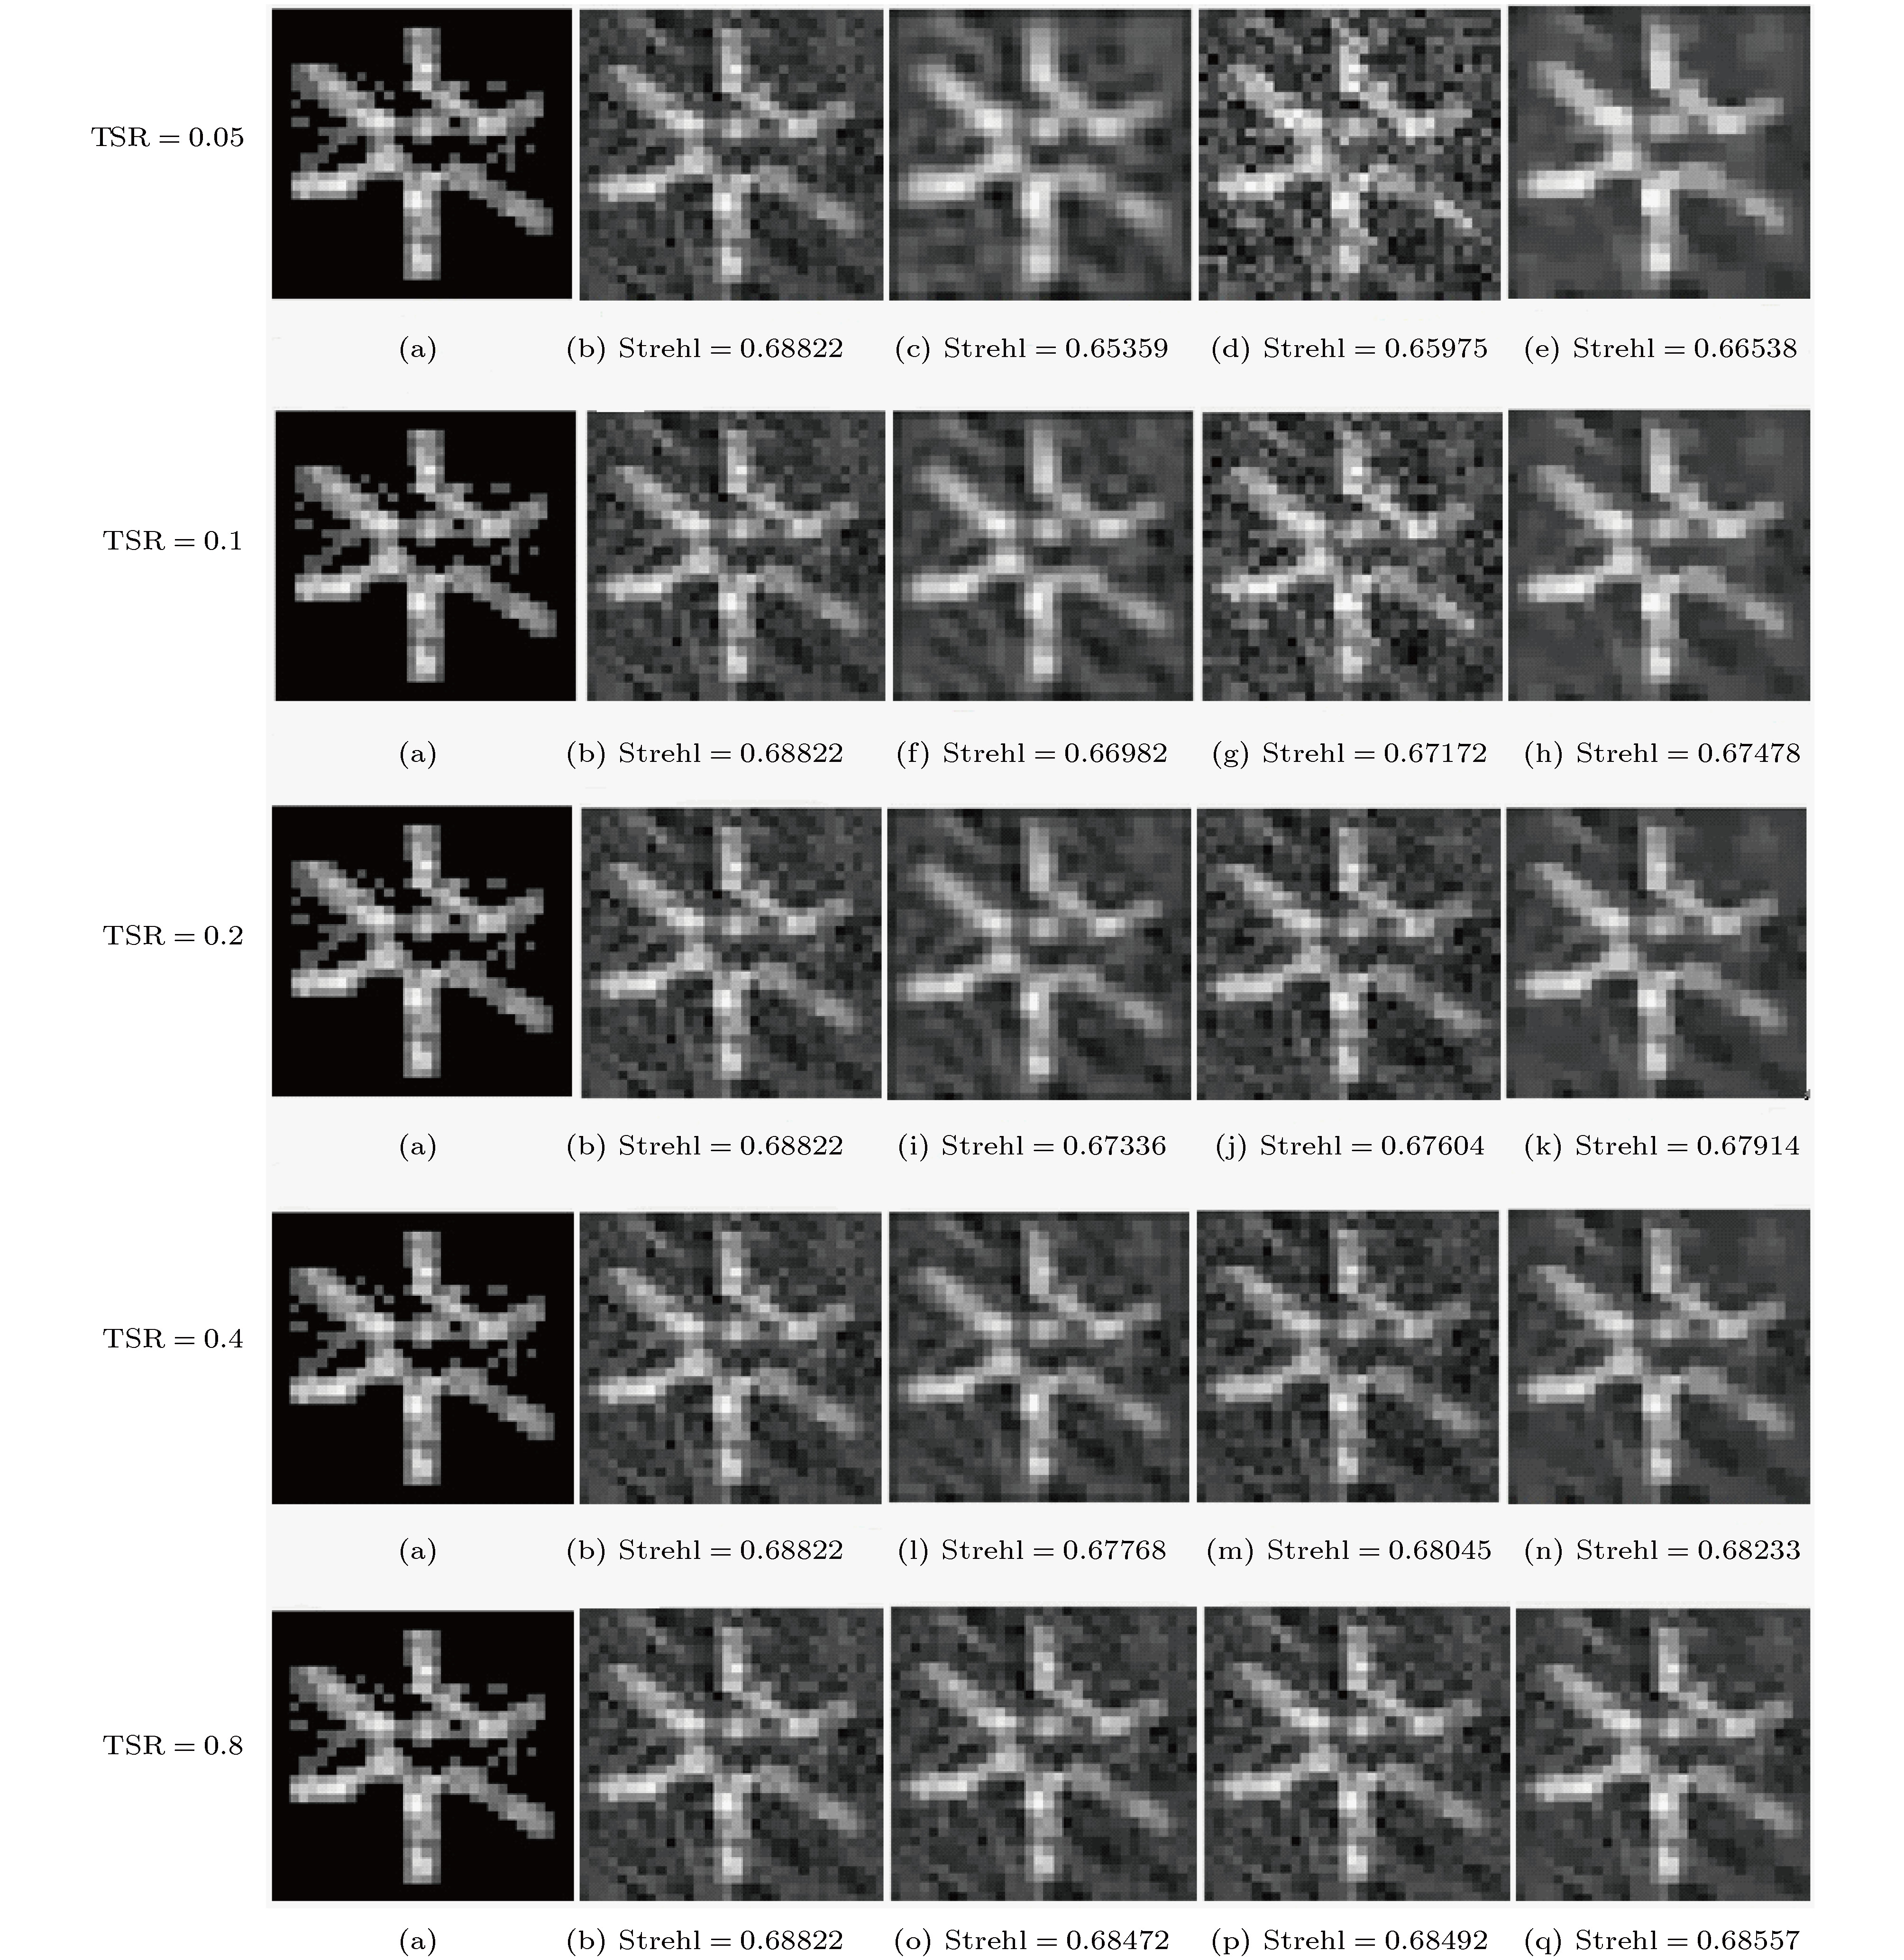
图 11 TSR的影响 (a) 和 (b) 分别是标准图像和传统FT图像; (c), (d) 和 (e) 分别是TSR = 0.05时的LF图像, VD图像和CS图像; (f), (g) 和 (h) 分别是TSR = 0.1时的LF图像, VD图像和CS图像; (i), (j) 和 (k) 分别是TSR = 0.2时的LF图像, VD图像和CS图像; (l), (m) 和 (n) 分别是TSR = 0.4时的LF图像, VD图像和CS图像; (o), (p) 和 (q) 分别是TSR = 0.8时的LF图像, VD图像和CS图像
Figure 11. The effect of the TSR: (a) and (b) are the standard image and the traditional FT image, respectively; (c), (d) and (e) are the LF image, the VD image and the CS image, respectively, when TSR = 0.05; (f), (g) and (h) are the LF image, the VD image and the CS image, respectively, when TSR = 0.1; (i), (j) and (k) are the LF image, the VD image and the CS image, respectively, when TSR = 0.2; (l), (m) and (n) are the LF image, the VD image and the CS image, respectively, when TSR = 0.4; (o), (p) and (q) are the LF image, the VD image and the CS image, respectively, when TSR = 0.8
表 1 四种方法的比较
Table 1. Comparison of the four methods
TSR Traditional FT/s LF method/s VD method/s CS method/s 0.05 8289 529 530 554 0.1 8289 943 944 968 0.2 8289 1772 1773 1797 0.4 8289 3430 3431 3455 0.8 8289 6746 6747 6771 -
[1] Louis S 1991 Appl. Opt. 30 206
 Google Scholar
[2] Campbell B F, Rubin L, Holmes R B 1995 Appl. Opt. 34 5932
 Google Scholar
[3] Rider C D, Jingle C, Nielson E 1996 Proceeding of the 1996 p147
[4] Holmes R B, Ma S, Bhowmik A, et al. 1996 J. Opt. Soc. Am. 13 351
 Google Scholar
[5] Brinkley T J, Sand1er D Effect 1999 SPIE 3815 42
[6] Bakut P A, Mandrosov V I 1999 SPIE 3815 49
[7] Cuellar E L, Stapp J, Cooper J 2005 SPIE 5896 58960D
[8] Mandrosov V I, Bakut P A, Gamiz V I 2001 SPIE 4167 192
[9] Be1en'kii M, Hughes K, Brinkley T, et al. 2002 SPIE 4821 62
[10] Ford S D, Voelz D G, Gamiz V L, et al. 1999 SPIE 3815 2
[11] Gamiz V L, Holmes R B, Czyzak S R, et al. 2000 SPIE 4091 304
[12] Thornton M A, Oldenettel J R, Hult D W, et al. 2002 SPIE 4489 78
[13] Stapp J, Spivey B, Chen L, et al. 2006 SPIE 6307 630701-1
[14] Spivey B, Stapp J, Sandler D 2006 SPIE 6307 630702-1
[15] Cuellar E L, Cooper J, Mathis J, et al. 2008 SPIE 7094 70940G-1
[16] Candes E J, Wakin M B 2008 IEEE Signal Processing Mag. 25 21
[17] Romberg J 2008 IEEE Signal Processing Mag. 25 14
[18] Lustig M, Donoho D, Pauly J M 2007 Mag. Reson. Med. 58 1182
 Google Scholar
[19] Qi D, Sha W 2009 Mathematics 1 1
[20] Qu X B, Zhang W R, Guo D, Cai C B, Cai S H, Chen Z 2010 Inverse Prob. Sci. Eng. 18 737
 Google Scholar
[21] 刘欣悦, 董磊, 王建立 2010 光学精密工程 18 521
Liu X Y, Dong L, Wang J L 2010 Optics and Precision Engineering 18 521
[22] Lu C M, Gao X, Tang J, et al. 2012 SPIE 8551 855110-1
[23] Li Y, Xiangli B, Zhang W X, et al. 2013 SPIE 887788770J-1
[24] Zhou Z S, Xiangli B, Zhang W X, et al. 2013 SPIE 8905 89052X-1
[25] Yu S H, Dong L, Liu X Y, Lin X D, Meng H R, Zhong X 2016 Appl. Opt. 55 6654
[26] Donoho D, Maleki A, Shahram M 2018 WAVELAB 850 http://statweb.stanford.edu/~wavelab/Wavelab_850/index_wavelab850.html
[27] 董磊, 刘欣悦, 陈宝刚等 2011 光子学报 40 1317
Dong L, Liu X Y, Chen B G, et al. 2011 Acta Photon. Sin. 40 1317
[28] 董磊, 刘欣悦, 林旭东等 2012 光学学报 32 32 0201004-1
Dong L, Liu X Y, Lin X D, et al. 2012 Acta Opt. Sin. 32 0201004-1
Catalog
Metrics
- Abstract views: 9768
- PDF Downloads: 47
- Cited By: 0


 DownLoad:

