-
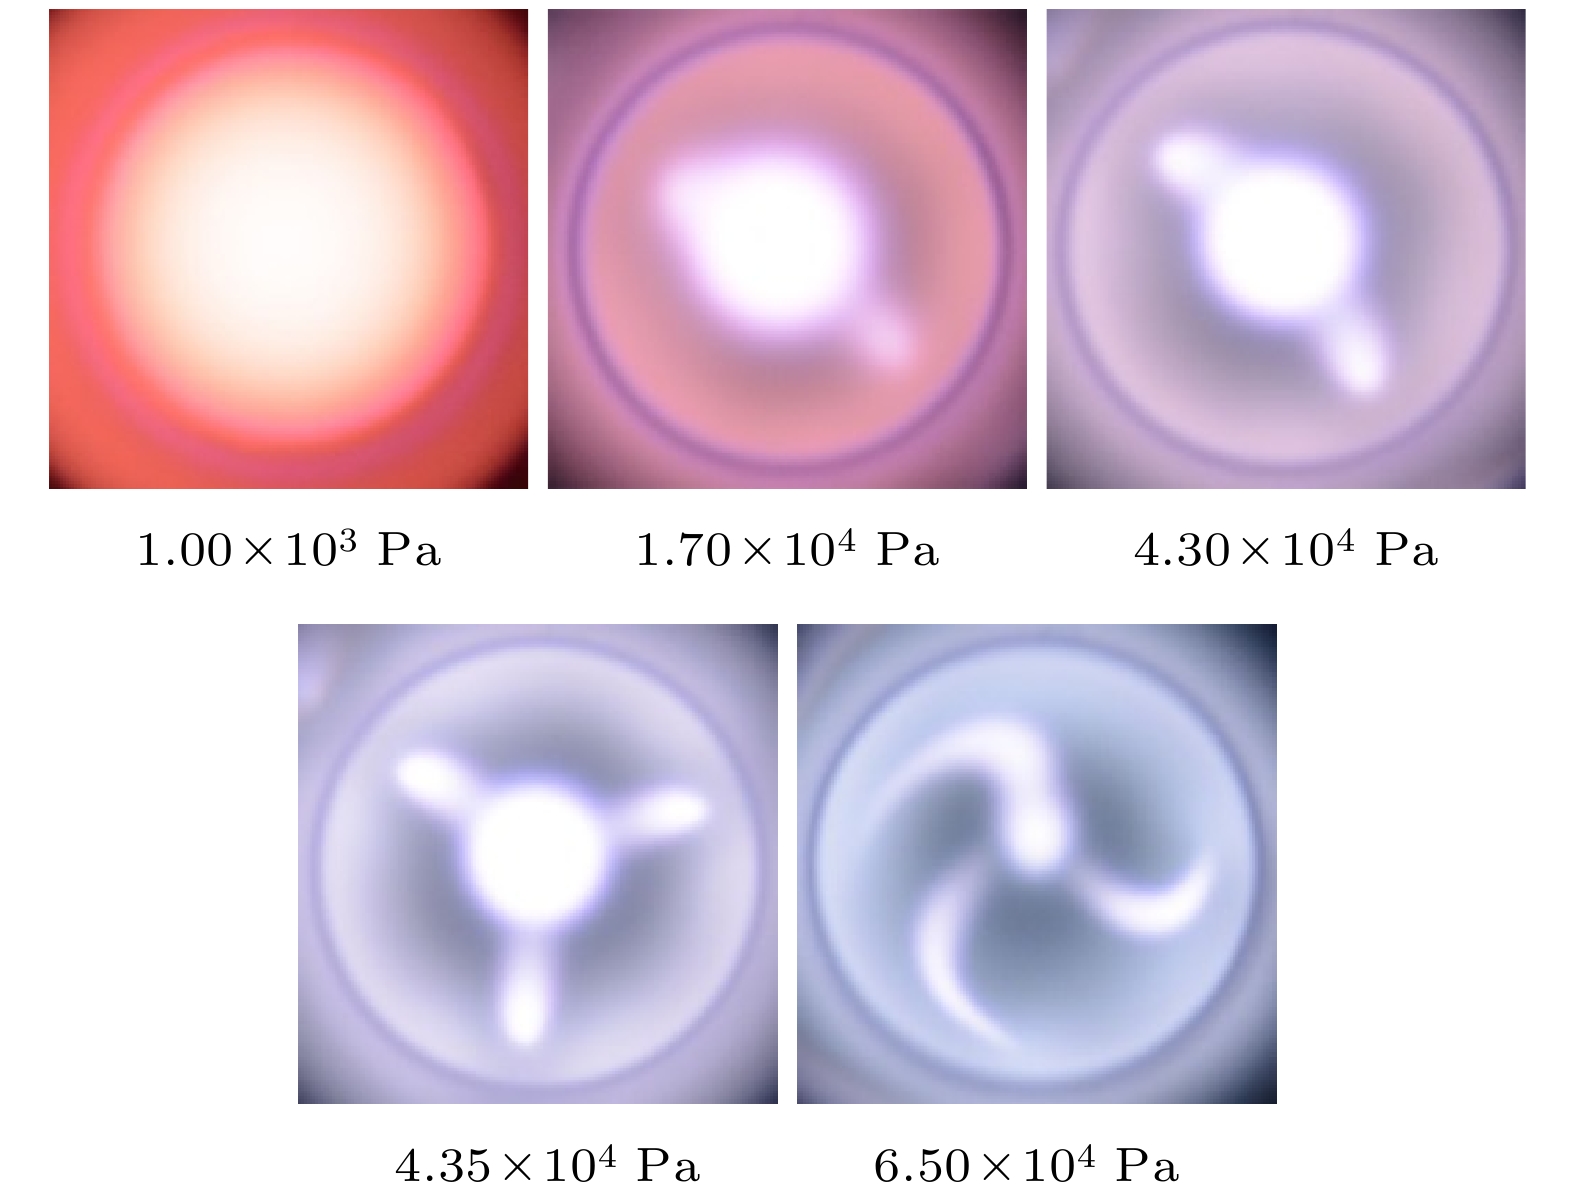
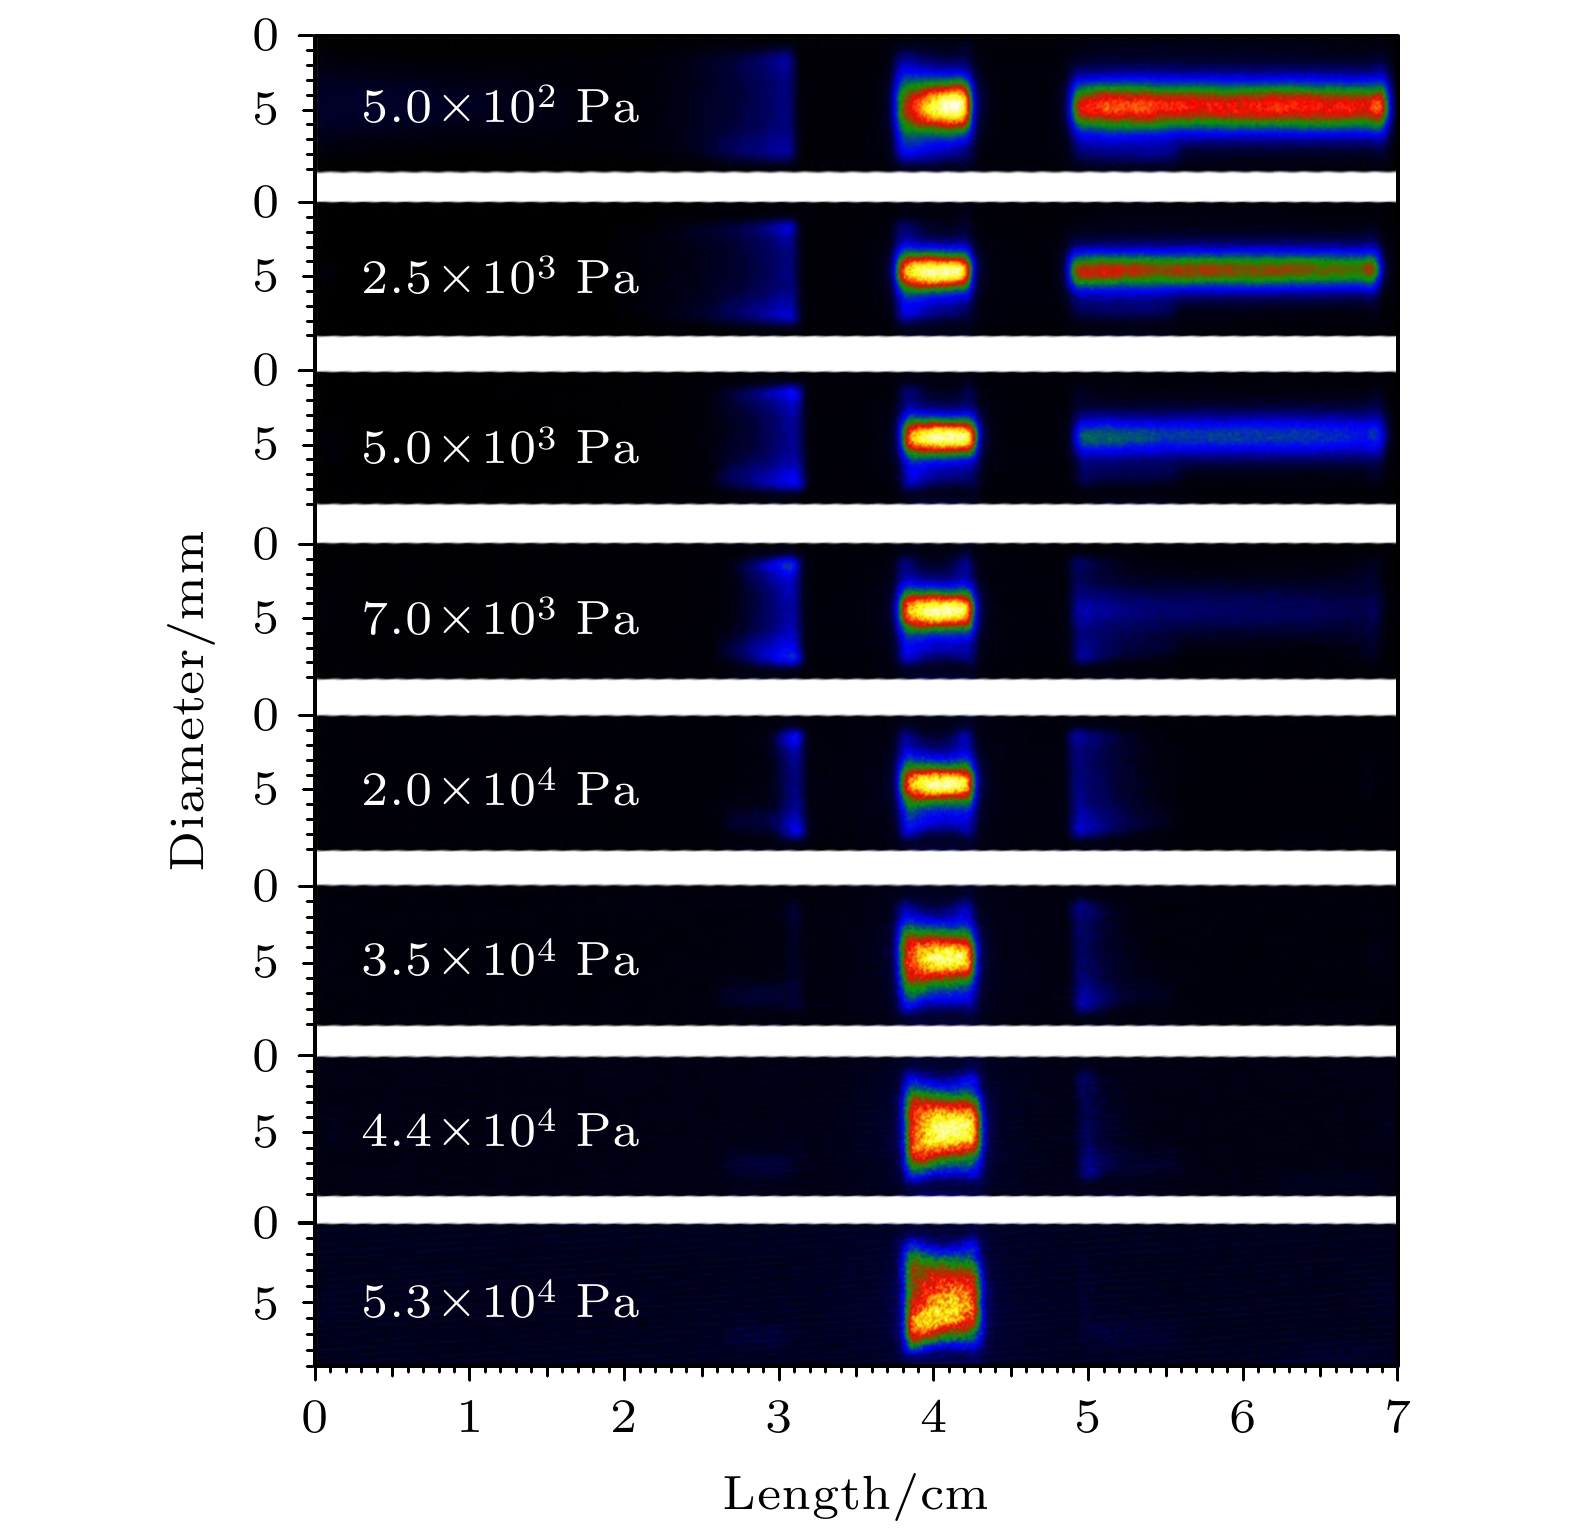
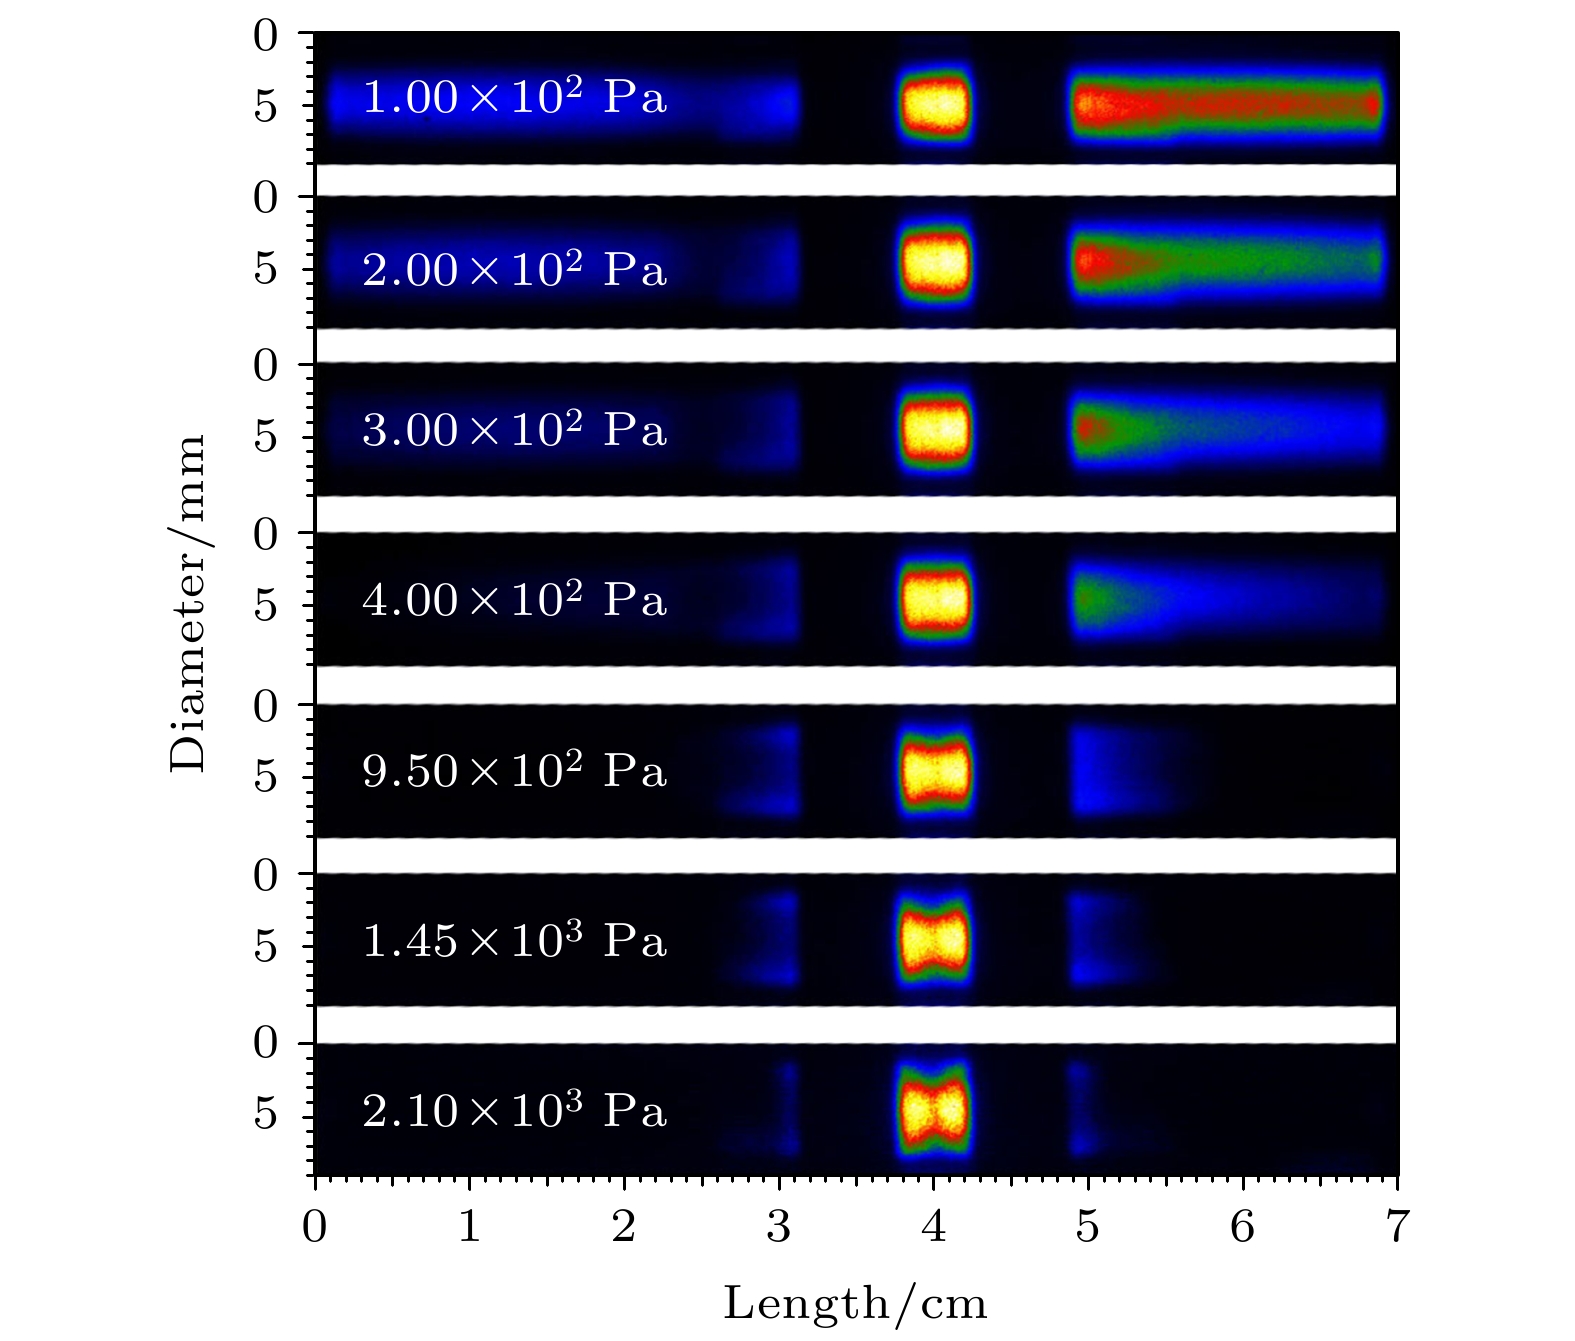
微束射频容性放电在纳米晶体颗粒等离子体增强气相合成有着潜在的应用前景. 本论文利用ICCD、单反相机、高压探头和电流探头等对微束射频容性放电特性进行了实验诊断研究. 结果发现: 在纯氩气微束射频放电中, 随着气压的增加, 放电从辉光放电模式向多通道丝状放电模式转换; 在99%氩/1%氢混合气体微束射频放电中, 丝状放电模式消失, 而是从低气压全空间分布的辉光放电模式, 到中等气压向轴心收缩的辉光放电模式, 最后到高气压的“环状”辉光放电模式; 而在纯氢气微束射频放电中, 随着气压的增加, 放电模式直接从全空间分布的辉光放电模式向“环状”辉光放电模式转换. 最后通过射频电场中电子加热、趋肤效应和气体热传导的共同作用解释了产生不同放电模式的物理机制.Micro-beam radio-frequency (RF) capacitive discharges have been widely used in the plasma enhanced chemical vapor deposition of nanocrystalline particles such as nano silicon crystal. However, the plasma column shrinks radially at a sufficiently high gas pressures as manifested by their glow not entirely filling the radial cross-section of the discharge tube. This greatly limits the dissociation rate of gas in plasma. In order to obtain the information about the plasma column varying with gas pressure, the formation of different gas discharge mode under different pressure is discussed. In this paper the spatial characteristics of micro-beam RF capacitive discharges are investigated by using an intensified charged-coupled device (ICCD) and a single lens reflex camera (SLR camera). Furthermore, high voltage probe and current probe are used to record the electrical characteristics of the high voltage electrode. The results indicate that in a pure argon discharge, the discharge mode evolves from a glow discharge into a filament discharge with the increase of pressure. As the pressure continues to increase, the filament is split: a single channel of plasma is split into two or more filaments at a certain gas pressure. However, the glow discharge in a mixture of 99% argon and 1% hydrogen at a low pressure is observed: the plasma spreads throughout the tube. As the pressure increases, the filament disappears, and the plasma column still can be observed in the center of quartz tube. The glow shrinks in the radial center at a moderate pressure. At a high pressure, the "annulus" glow discharge is achieved as manifested by a glow ring on the surface of the discharge tube. In addition, in pure hydrogen discharges, the discharge mode evolves from the full-space glow discharge into an "annulus" glow discharge with pressure increasing. Finally, through the interaction between the electron heating by the radio frequency electric field and heat conduction of gas, the filament discharge in a low thermal conduction gas is explained. In addition, special attention is paid to the pure argon filamentation, which is the splitting of a single channel of plasma into two or more smaller filaments as a result of the skin effect.
-
Keywords:
- radio-frequency capacitively coupled micro-beam plasmas /
- experimental diagnoses /
- mode transition
[1] 韩传余, 吴瑜, 王守国 2010 科技导报 20 93
 Google Scholar
Han C Y, Wu Y, Wang S G 2010 Sci. Technol. Rev. 20 93
 Google Scholar
[2] Mangolini L, Thimsen E, Kortshagen U 2005 Nano Lett. 5 655
 Google Scholar
[3] Jurbergs D, Rogojina E, Mangolini L, Kortshagen U 2006 Appl. Phys. Lett. 88 233116
 Google Scholar
[4] Kortshagen U 2009 J. Phys. D: Appl. Phys. 42 113001
 Google Scholar
[5] Gresback R, Holman Z, Kortshagen U 2007 Appl. Phys. Lett. 91 093119
 Google Scholar
[6] Gresback R, Hue R, Gladfelter W, Kortshage U 2011 Nanoscale Res. Lett. 6 68
 Google Scholar
[7] Gresback R, Nozaki T, Okazaki K 2011 Nanotechnology 22 305605
 Google Scholar
[8] Shen P, Uesawa N, Inasawa S, Yamaguchi Y J 2010 Mater. Chem. 20 1669
 Google Scholar
[9] Djermanova N, Grozev D, Kirov K, Makasheva K, Shivarova A, Tsvetkov Ts 1999 J. Appl. Phys. 86 738
 Google Scholar
[10] Kabouzi Y, Calzada M D, Moisan M, Tran K C, Trassy C 2002 J. Appl. Phys. 91 1008
 Google Scholar
[11] Kabouzi Y, Moisan M, Rostaing J C, Trassy C, Guérin D, Kéroack D, Zakrzewski Z 2003 J. Appl. Phys. 93 9483
 Google Scholar
[12] D B Ogle, G A Woolsey 1987 J. Phys. D: Appl. Phys. 20 453
 Google Scholar
[13] Maximov A V, Schlüter H 1999 Phys. Scr. 60 556
 Google Scholar
[14] Chen Z, Yin Z, Huang Y, Stepanova O, Gutsev S, Kudryavtsev A A 2015 IEEE Trans. Plasma Sci. 43 906
 Google Scholar
[15] Chen Z, Xia G, Zhou Q, Hu Y, Zheng X, Zheng Z, Hong L, Li P, Huang Y, Liu M 2012 Rev. Sci. Instrum. 83 084701
 Google Scholar
[16] Yanguas-Gil A, Focke K, Benedikt J, Keudell A V 2007 J. Appl. Phys. 101 103307
 Google Scholar
[17] Hong Y C, Uhm H S, Yi W J 2008 Appl. Phys. Lett. 93 051504
 Google Scholar
[18] Mckay K, Iza F, Kong M G 2010 Eur. Phys. J. D 60 497
 Google Scholar
[19] Sands B L, Ganguly B N, Tachibana K 2008 Appl. Phys. Lett. 92 151503
 Google Scholar
[20] Urabe K, Ito Y, Sakai O, Tachibana K 2010 Jpn. J. Appl. Phys. 49 106001
 Google Scholar
-
图 8 不同电压下, 氩气放电中射频电流(峰峰值)随着气压的变化曲线 (a)
$1 \times {10^3}$ Pa辉光放电; (b) 出现双通道丝状放电的临界点; (c) 出现三通道丝状放电的临界点; (d) 等离子体收缩在两个电极之间的临界点Fig. 8. Evolution of radio-frequency current (peak-to-peak) with pressure in argon discharges for different voltages: (a) The glow discharge at
$1 \times {10^3}$ Pa; (b) the occurrence of double-channel filament discharge; (c) the occurrence of three-channel filament discharge; (d) the plasma contraction between two electrodes.图 10 不同电压下, 氢气等离子体射频电流(峰峰值)随着气压的变化曲线 (a)
$1 \times {10^2}$ Pa辉光放电; (b) 等离子体收缩在两个电极间的临界点; (c) 等离子体熄灭前Fig. 10. Evolution of radio-frequency current (peak-to-peak) with pressure in hydrogen discharges for different voltages: (a) The glow discharge at
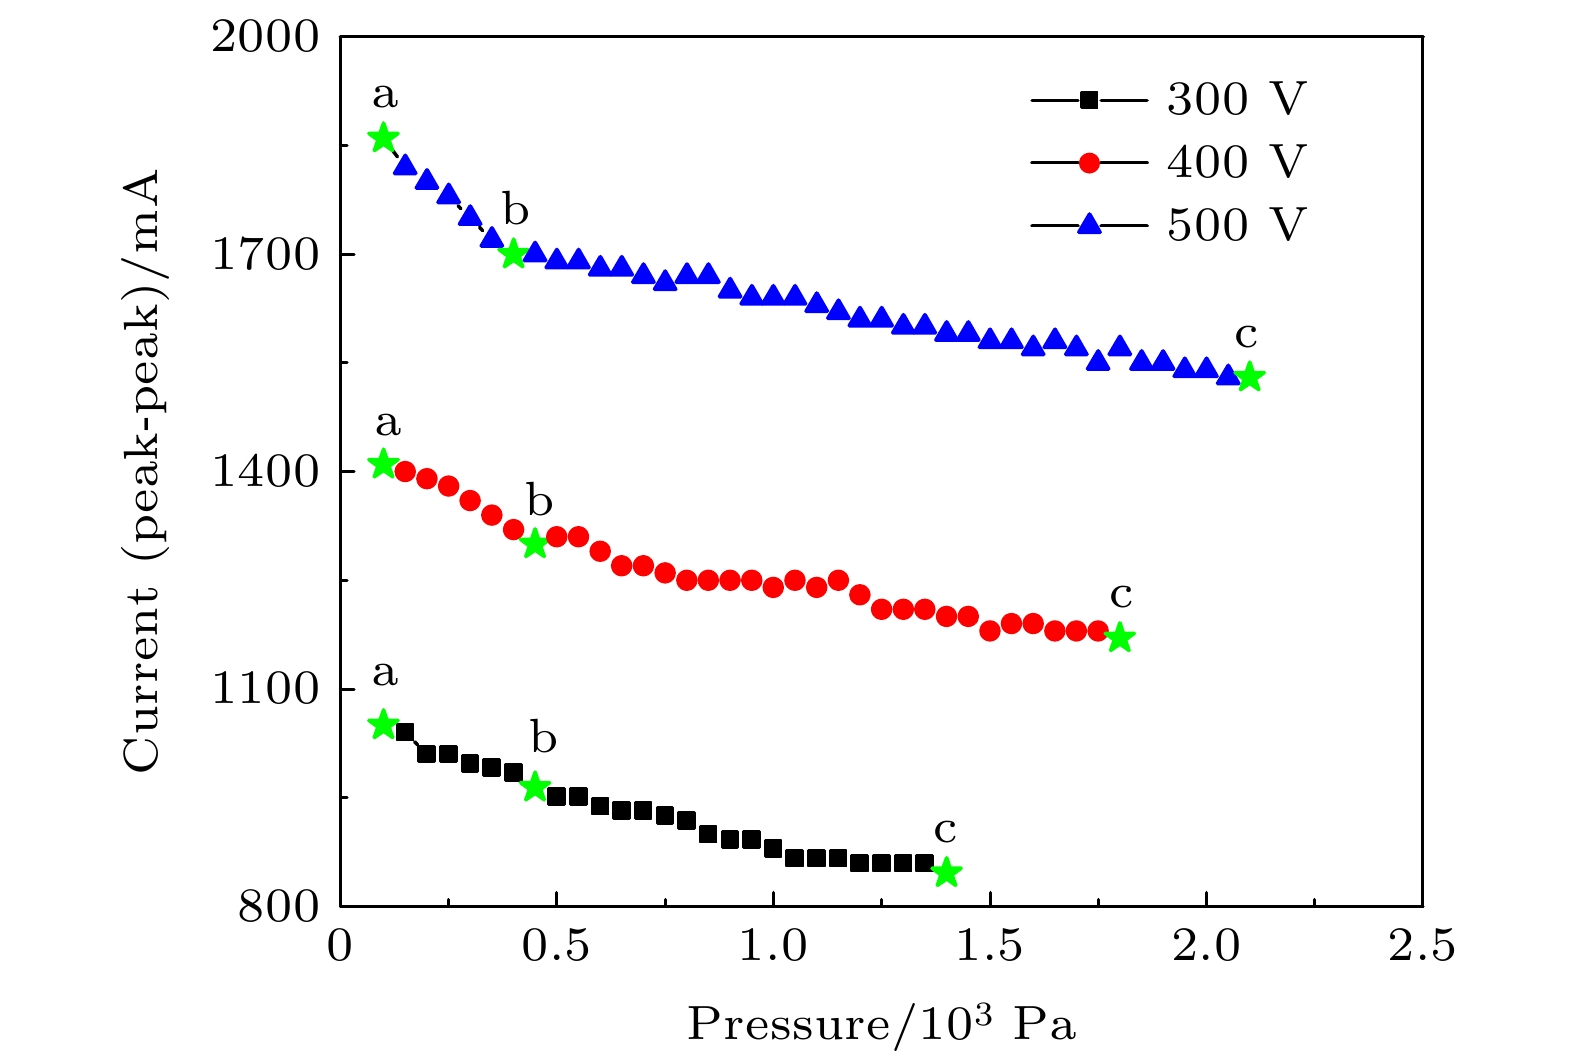
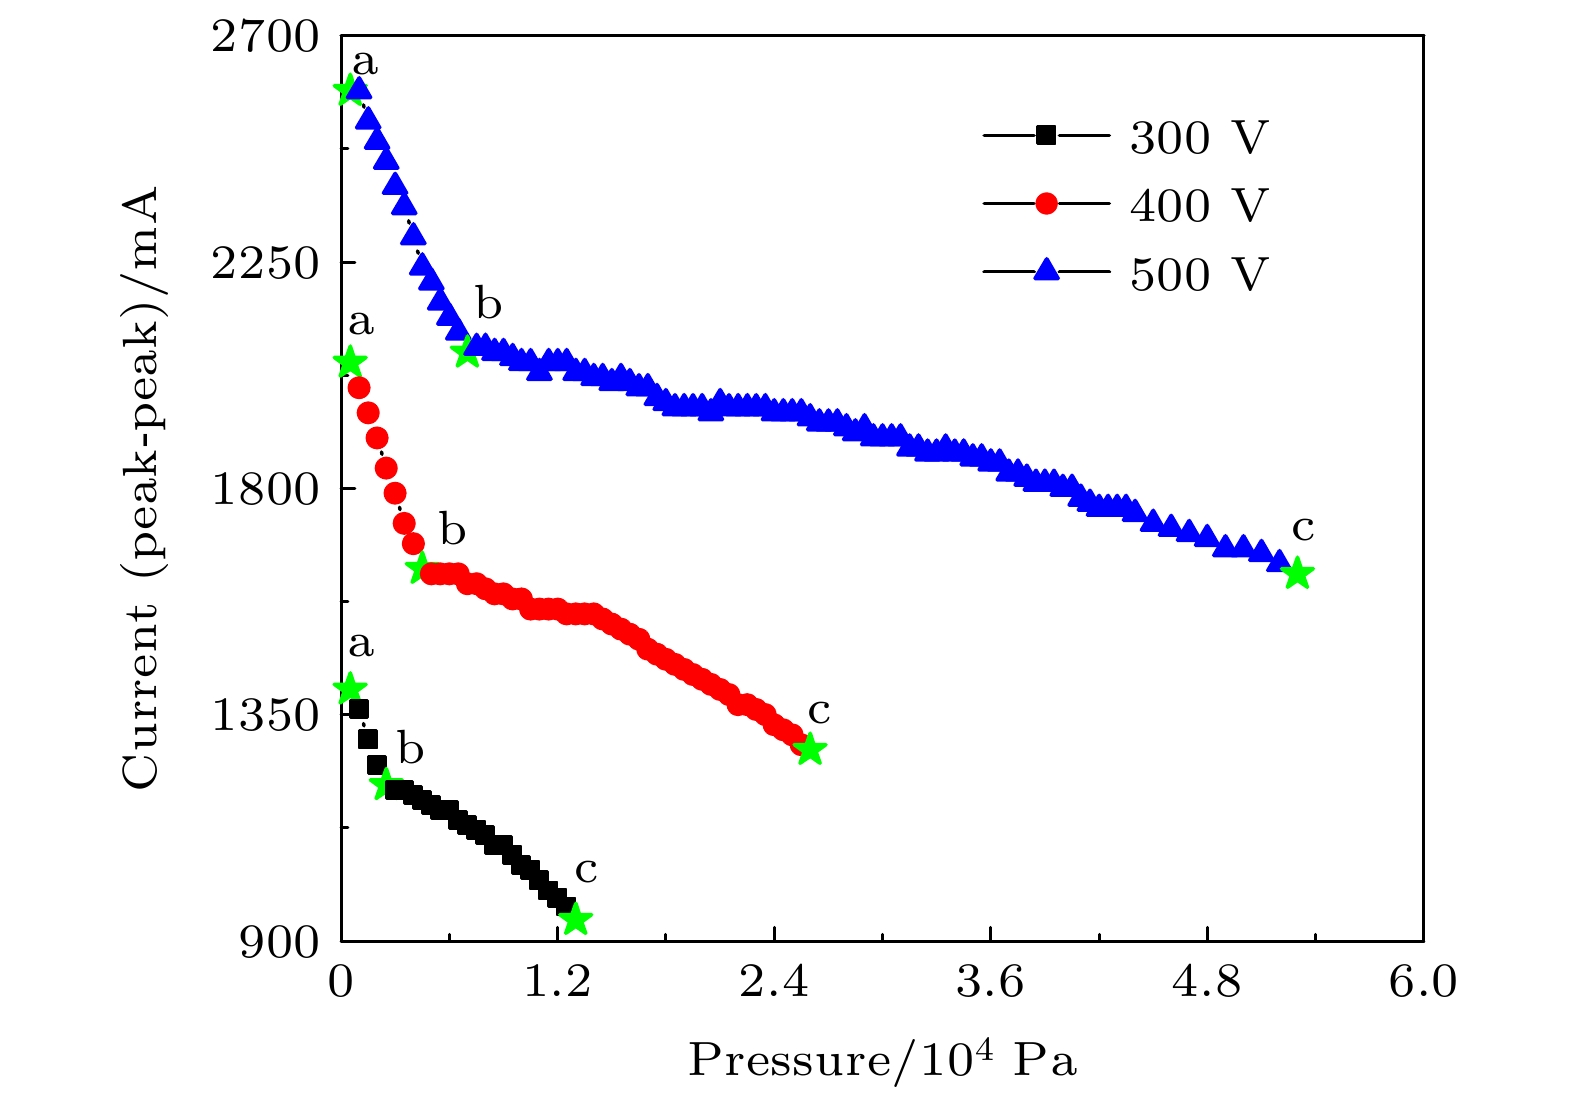
$1 \times {10^2}$ Pa; (b) the plasma contraction between two electrodes; (c) the plasma extinction.图 9 不同电压下, 99%氩/1%氢混合气体放电射频电流(峰峰值)随着气压的变化曲线 (a)
$5 \times {10^2}$ Pa辉光放电; (b) 等离子体收缩在两个电极间的临界点; (c) 等离子体熄灭前Fig. 9. Evolution of radio-frequency current (peak-to-peak) with pressure in argon/hydrogen (99%/1%) discharges for different voltages: (a) The glow discharge at
$5 \times {10^2}$ Pa; (b) the plasma contraction between two electrodes; (c) the plasma extinction. -
[1] 韩传余, 吴瑜, 王守国 2010 科技导报 20 93
 Google Scholar
Han C Y, Wu Y, Wang S G 2010 Sci. Technol. Rev. 20 93
 Google Scholar
[2] Mangolini L, Thimsen E, Kortshagen U 2005 Nano Lett. 5 655
 Google Scholar
[3] Jurbergs D, Rogojina E, Mangolini L, Kortshagen U 2006 Appl. Phys. Lett. 88 233116
 Google Scholar
[4] Kortshagen U 2009 J. Phys. D: Appl. Phys. 42 113001
 Google Scholar
[5] Gresback R, Holman Z, Kortshagen U 2007 Appl. Phys. Lett. 91 093119
 Google Scholar
[6] Gresback R, Hue R, Gladfelter W, Kortshage U 2011 Nanoscale Res. Lett. 6 68
 Google Scholar
[7] Gresback R, Nozaki T, Okazaki K 2011 Nanotechnology 22 305605
 Google Scholar
[8] Shen P, Uesawa N, Inasawa S, Yamaguchi Y J 2010 Mater. Chem. 20 1669
 Google Scholar
[9] Djermanova N, Grozev D, Kirov K, Makasheva K, Shivarova A, Tsvetkov Ts 1999 J. Appl. Phys. 86 738
 Google Scholar
[10] Kabouzi Y, Calzada M D, Moisan M, Tran K C, Trassy C 2002 J. Appl. Phys. 91 1008
 Google Scholar
[11] Kabouzi Y, Moisan M, Rostaing J C, Trassy C, Guérin D, Kéroack D, Zakrzewski Z 2003 J. Appl. Phys. 93 9483
 Google Scholar
[12] D B Ogle, G A Woolsey 1987 J. Phys. D: Appl. Phys. 20 453
 Google Scholar
[13] Maximov A V, Schlüter H 1999 Phys. Scr. 60 556
 Google Scholar
[14] Chen Z, Yin Z, Huang Y, Stepanova O, Gutsev S, Kudryavtsev A A 2015 IEEE Trans. Plasma Sci. 43 906
 Google Scholar
[15] Chen Z, Xia G, Zhou Q, Hu Y, Zheng X, Zheng Z, Hong L, Li P, Huang Y, Liu M 2012 Rev. Sci. Instrum. 83 084701
 Google Scholar
[16] Yanguas-Gil A, Focke K, Benedikt J, Keudell A V 2007 J. Appl. Phys. 101 103307
 Google Scholar
[17] Hong Y C, Uhm H S, Yi W J 2008 Appl. Phys. Lett. 93 051504
 Google Scholar
[18] Mckay K, Iza F, Kong M G 2010 Eur. Phys. J. D 60 497
 Google Scholar
[19] Sands B L, Ganguly B N, Tachibana K 2008 Appl. Phys. Lett. 92 151503
 Google Scholar
[20] Urabe K, Ito Y, Sakai O, Tachibana K 2010 Jpn. J. Appl. Phys. 49 106001
 Google Scholar
计量
- 文章访问数: 8334
- PDF下载量: 170
- 被引次数: 0


 下载:
下载:

