-
Excimer laser plays an important role in the national economic production because of its short wavelength, high repetition frequency and large energy. In the output characteristics of excimer lasers, high beam quality and high energy stability are the characters of high-end excimer light source, and whether the excimer laser system can sufficiently develop the preionization process is the key to output laser pulses with high beam quality and stable energy. This paper is mainly to study the preionization process of ArF excimer laser, and establish one-dimensional simulation calculation model and two-dimensional simulation calculation model. Based on the fluid calculation method of Comsol Multiphysics software, the numerical simulation analysis and calculation are carried out, with the study focusing on the ionization wave propagation process in the preionization process and the relationship between preionization and main discharge. The results show that the spatial structure of corona rod and main electrode should be considered comprehensively when an excimer laser system is designed. Appropriate preionization structure and voltage can make the main discharge triggered during the maintenance of free electrons, which can effectively reduce the discharge voltage, avoid streamer and arc discharge, and improve the output beam quality and system energy stability.
-
Keywords:
- excimer laser /
- fluid model /
- preionization /
- electron number density
[1] Shuntaro W, Alcock A J, Leopold K E, Taylor R S 1981 Appl. Phys. Lett. 38 3
 Google Scholar
[2] Feenstra L, Bastiaens H M J, Peters P J M, Witteman W J 1999 IEEE J. Sel. Top. Quant. 5 1515
 Google Scholar
[3] Lin S C, Levatter J I 1979 Appl. Phys. Lett. 34 505
 Google Scholar
[4] Levatter J I, Lin S C 1980 J. Appl. Phys. 51 210
 Google Scholar
[5] Taylor R S 1986 Appl. Phys. B 41 1
 Google Scholar
[6] Kushner M J 1991 IEEE Trans. Plas. Sci. 19 387
 Google Scholar
[7] Treshchalov A, Lissovski A, Chikeev E 2002 Proc. SPIE. International Conference on Atomic and Molecular Pulsed Lasers IV 4747 253
 Google Scholar
[8] Mathew D, Bastiaens H M J, Boller K J 2006 Appl. Phys. Lett. 88 101502
 Google Scholar
[9] Xiong Z M, Kushner M J 2010 J. Phys. D: Apply. Phys. 43 505204
 Google Scholar
[10] Yampolskaya S A, Yastremskii A G, Panchenko Y N 2020 IEEE J. Quan. Elec. 56 1500209
 Google Scholar
[11] Akashi H, Sakai Y, Tagashira H 1995 J. Phys. D: Appl. Phys. 28 445
 Google Scholar
[12] Hagelaar G J M, Pitchford L C 2005 Plas. Sour. Sci. 14 722
 Google Scholar
[13] Razhev A M, Shchedrin A I, Kalyuzhnaya A G, Zhupikov A A 2005 Quantum Electron. 35 799
 Google Scholar
-
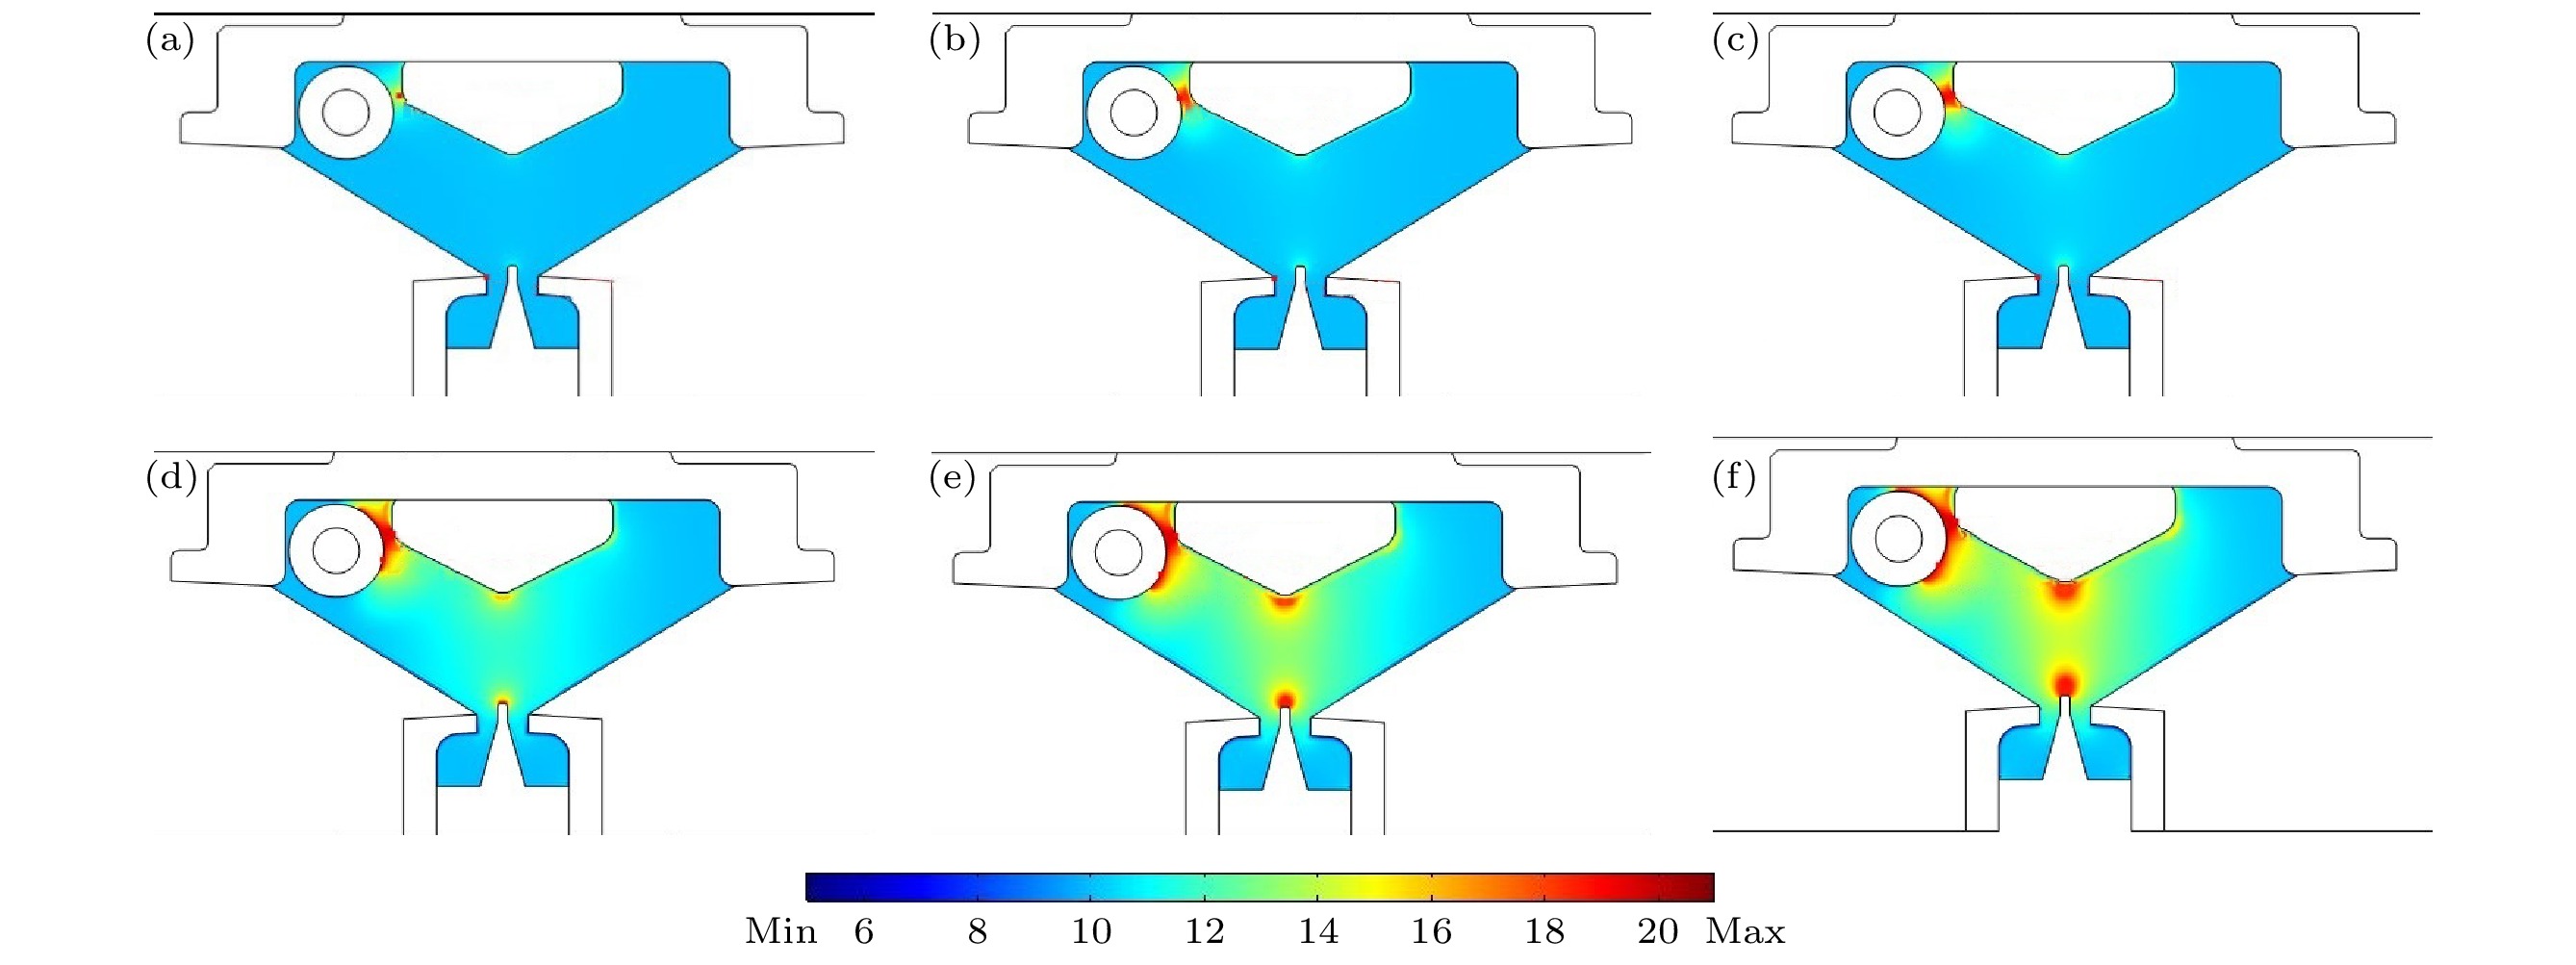
图 6 预电离过程中电子数密度分布情况 (a) t = 25 ns时, max = 1.76×10¹⁵, min = 1.37×10⁵; (b) t = 29 ns时, max = 4.40×10¹⁸, min = 9.28×10⁴; (c) t = 30 ns时, max = 2.44×10¹⁹, min = 8.28×10⁴; (d) t = 35 ns时, max = 4.40×10¹⁸, min = 9.28×10⁴; (e) t = 45 ns时, max = 1.50×1024, min = 1.74×10⁻⁷; (f) t = 47 ns时, max = 1.62×1024, min = 1.88×10⁻⁷
Figure 6. Distribution of electron number density during preionization: (a) t = 25 ns, max = 1.76×10¹⁵, min = 1.37×10⁵; (b) t = 29 ns, max = 4.40×10¹⁸, min = 9.28×10⁴; (c) t = 30 ns, max = 2.44×10¹⁹, min = 8.28×10⁴; (d) t = 35 ns, max = 4.40×10¹⁸, min = 9.28×10⁴; (e) t = 45 ns, max = 1.50×1024, min = 1.74×10⁻⁷; (f) t = 47 ns, max = 1.62×1024, min = 1.88×10⁻⁷.
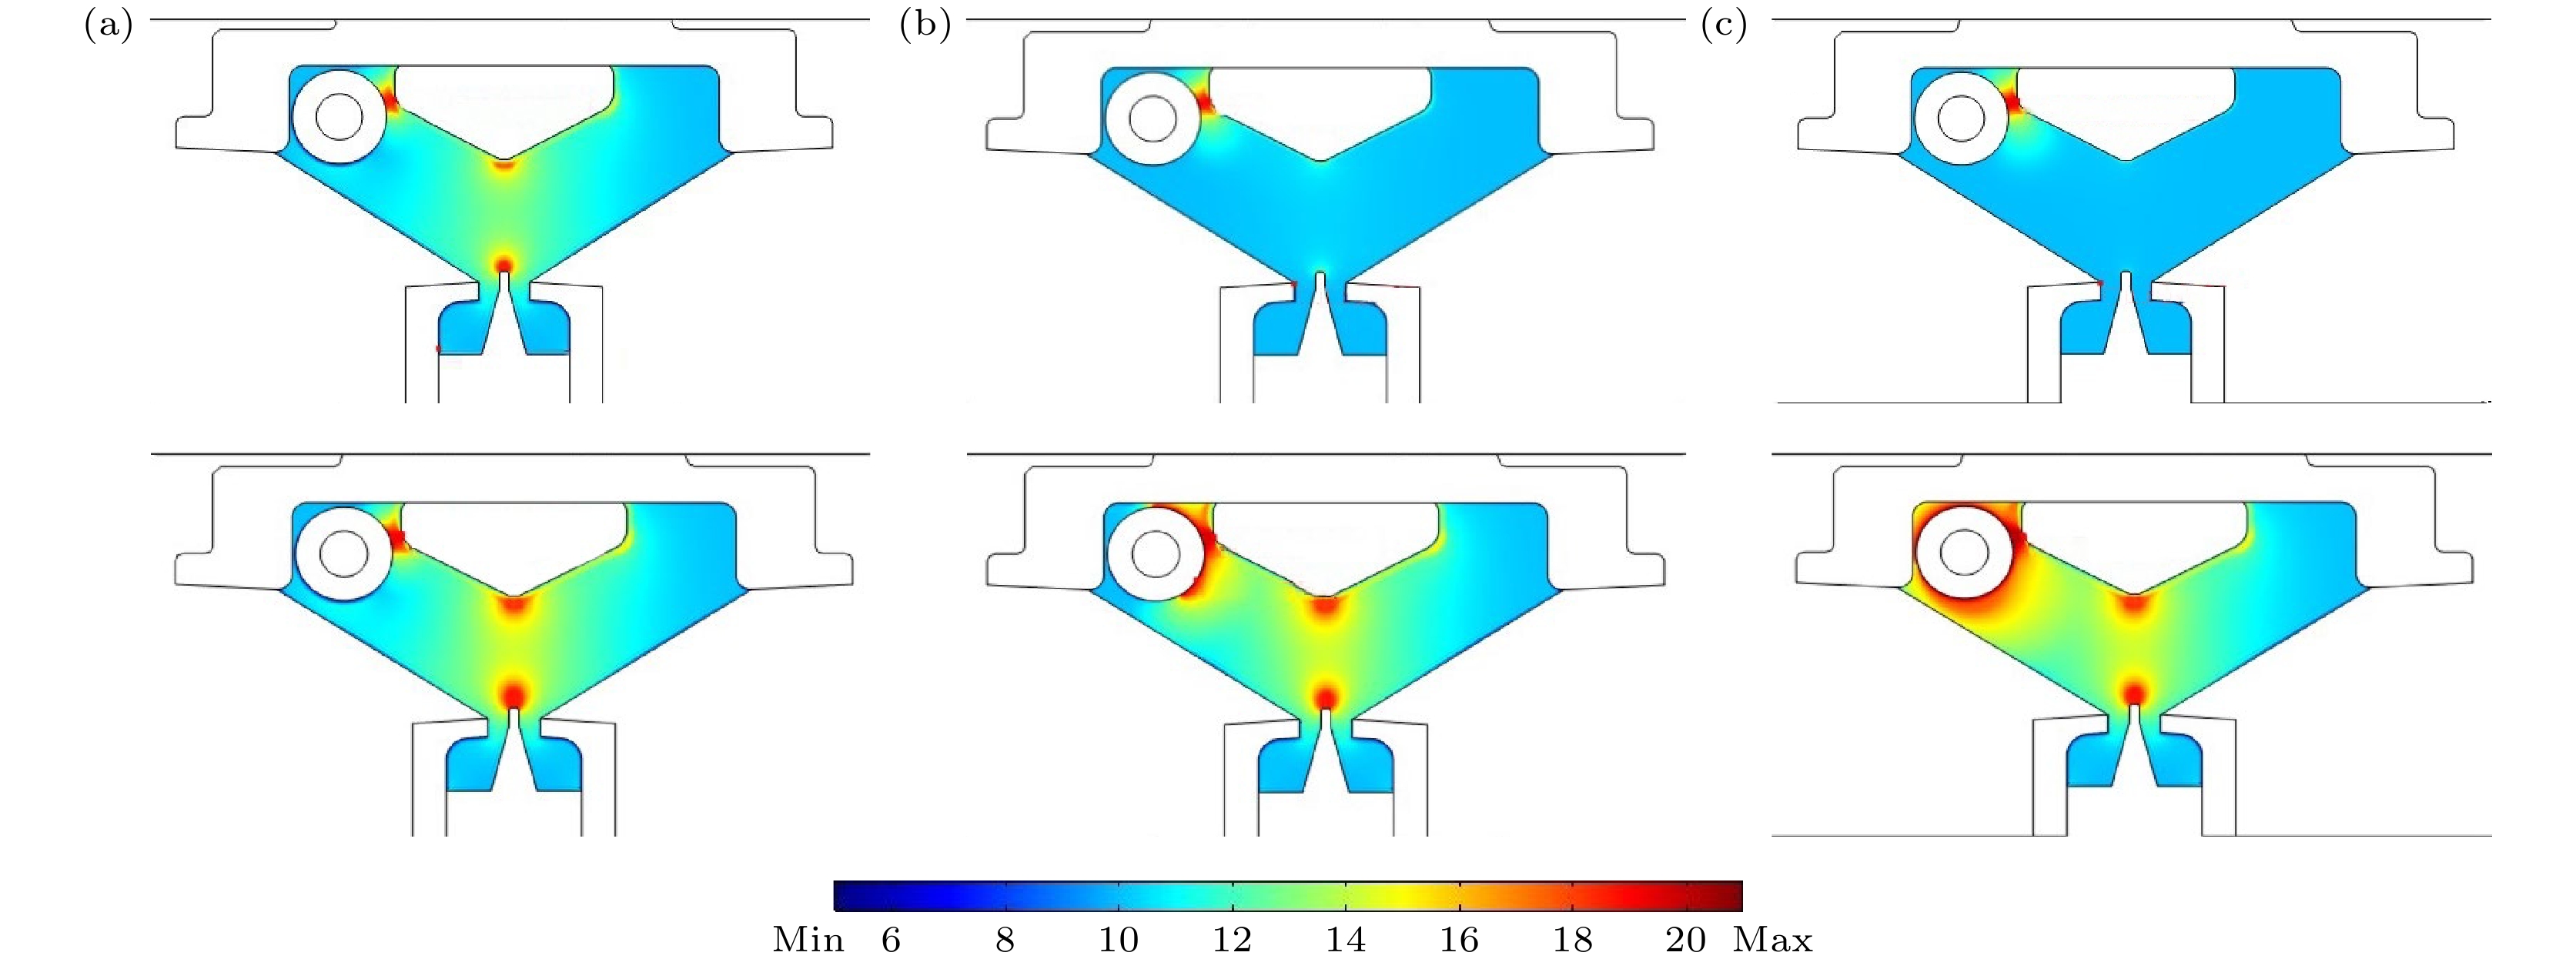
图 7 不同预电离电压下自由电子数密度分布情况 (a) V = 5.2 kV时, t = 44 ns, max = 9.67×10¹⁸, min = 1.54×10⁶; t = 47 ns, max = 7.31×10²², min = 0.009; (b) V = 13 kV时, t = 30 ns, max = 2.44×10¹⁹, min = 8.28×10⁴; t = 44 ns, max = 1.26×1024, min =1.88×10⁻⁷; (c) V = 26 kV时, t = 23 ns, max = 3.63×10²¹, min = 1.45×10⁴; t = 44 ns, max = 1.23×1025, min = 0.012
Figure 7. Electron number density distribution with different preionization voltage: (a) V = 5.2 kV, t = 44 ns, max = 9.67×10¹⁸, min = 1.54×10⁶; t = 47 ns, max = 7.31×10²², min = 0.009; (b) V = 13 kV, t = 30 ns, max = 2.44×10¹⁹, min = 8.28×10⁴; t = 44 ns, max = 1.26×1024, min = 1.88×10⁻⁷; (c) V = 26 kV, t = 23 ns, max = 3.63×10²¹, min = 1.45×10⁴; t = 44 ns, max = 1.23×1025, min = 0.012.
表 1 计算过程中考虑的化学反应通道, Boltz代表该反应的反应速率由玻尔兹曼方程计算得到[11,13]
Table 1. Reactions considered in the study, label Boltz indicates that the constant was calculated from the Boltzman equation[11,13].
Ionization reaction Constant rate Ar + e → Ar* + e Boltz Ar + e → Ar+ + 2e Boltz F2 + e → F– + F Boltz Ne + e → Ne+ + 2e Boltz Ne + e → Ne* + e Boltz Ne* + 2Ne → $ {\text{Ne}}_2^* $ + Ne 4 × 10–34 cm6/s[13] Ne* + e → Ne+ + 2e Boltz ArF* → Ar + F 1/4.2 ns[11] $ {\text{Ne}}_2^* $ → 2Ne + hγ'' 1/11 ns[13] Xe + hγ'' → Xe + e 10–16 cm2 [11] Ar+ → Ar — F– → F — Ar* → Ar — Ne+ → Ne — Ne* → Ne — $ {\text{Ne}}_2^* $ → 2Ne — -
[1] Shuntaro W, Alcock A J, Leopold K E, Taylor R S 1981 Appl. Phys. Lett. 38 3
 Google Scholar
[2] Feenstra L, Bastiaens H M J, Peters P J M, Witteman W J 1999 IEEE J. Sel. Top. Quant. 5 1515
 Google Scholar
[3] Lin S C, Levatter J I 1979 Appl. Phys. Lett. 34 505
 Google Scholar
[4] Levatter J I, Lin S C 1980 J. Appl. Phys. 51 210
 Google Scholar
[5] Taylor R S 1986 Appl. Phys. B 41 1
 Google Scholar
[6] Kushner M J 1991 IEEE Trans. Plas. Sci. 19 387
 Google Scholar
[7] Treshchalov A, Lissovski A, Chikeev E 2002 Proc. SPIE. International Conference on Atomic and Molecular Pulsed Lasers IV 4747 253
 Google Scholar
[8] Mathew D, Bastiaens H M J, Boller K J 2006 Appl. Phys. Lett. 88 101502
 Google Scholar
[9] Xiong Z M, Kushner M J 2010 J. Phys. D: Apply. Phys. 43 505204
 Google Scholar
[10] Yampolskaya S A, Yastremskii A G, Panchenko Y N 2020 IEEE J. Quan. Elec. 56 1500209
 Google Scholar
[11] Akashi H, Sakai Y, Tagashira H 1995 J. Phys. D: Appl. Phys. 28 445
 Google Scholar
[12] Hagelaar G J M, Pitchford L C 2005 Plas. Sour. Sci. 14 722
 Google Scholar
[13] Razhev A M, Shchedrin A I, Kalyuzhnaya A G, Zhupikov A A 2005 Quantum Electron. 35 799
 Google Scholar
Catalog
Metrics
- Abstract views: 5988
- PDF Downloads: 184
- Cited By: 0


 DownLoad:

