-
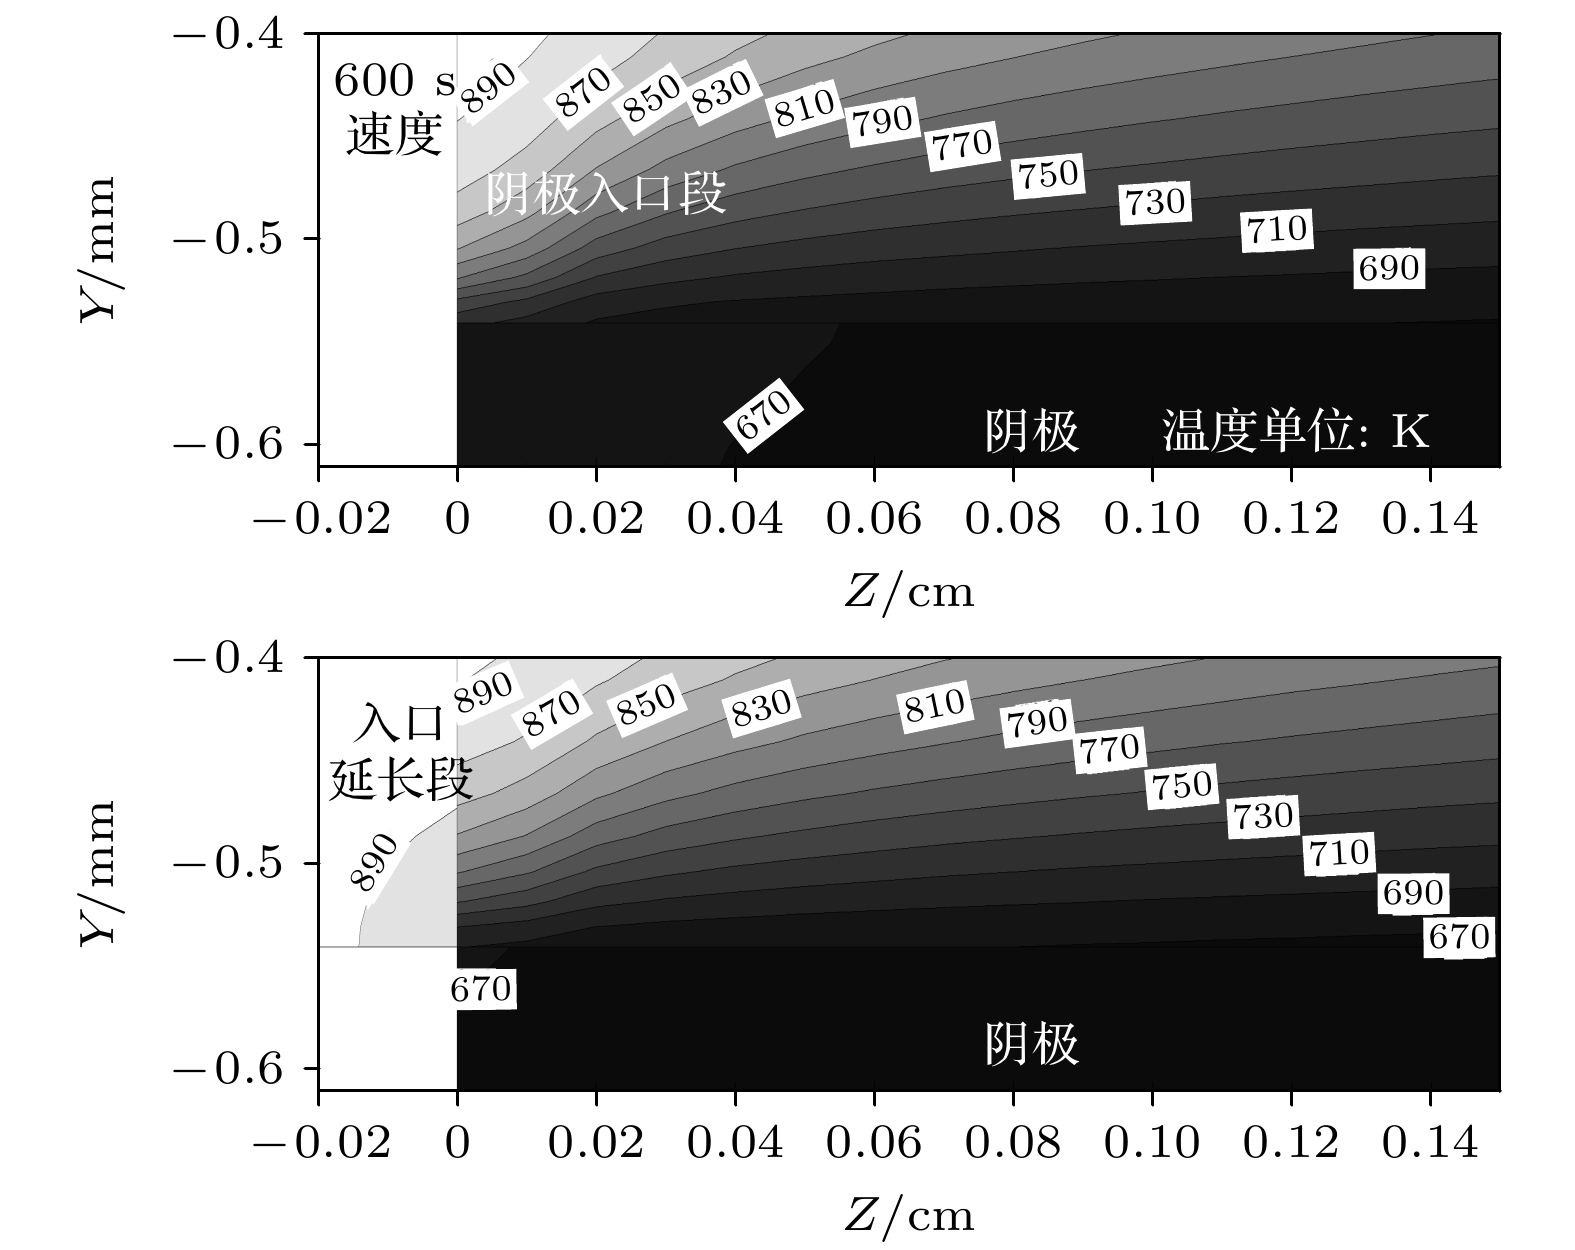
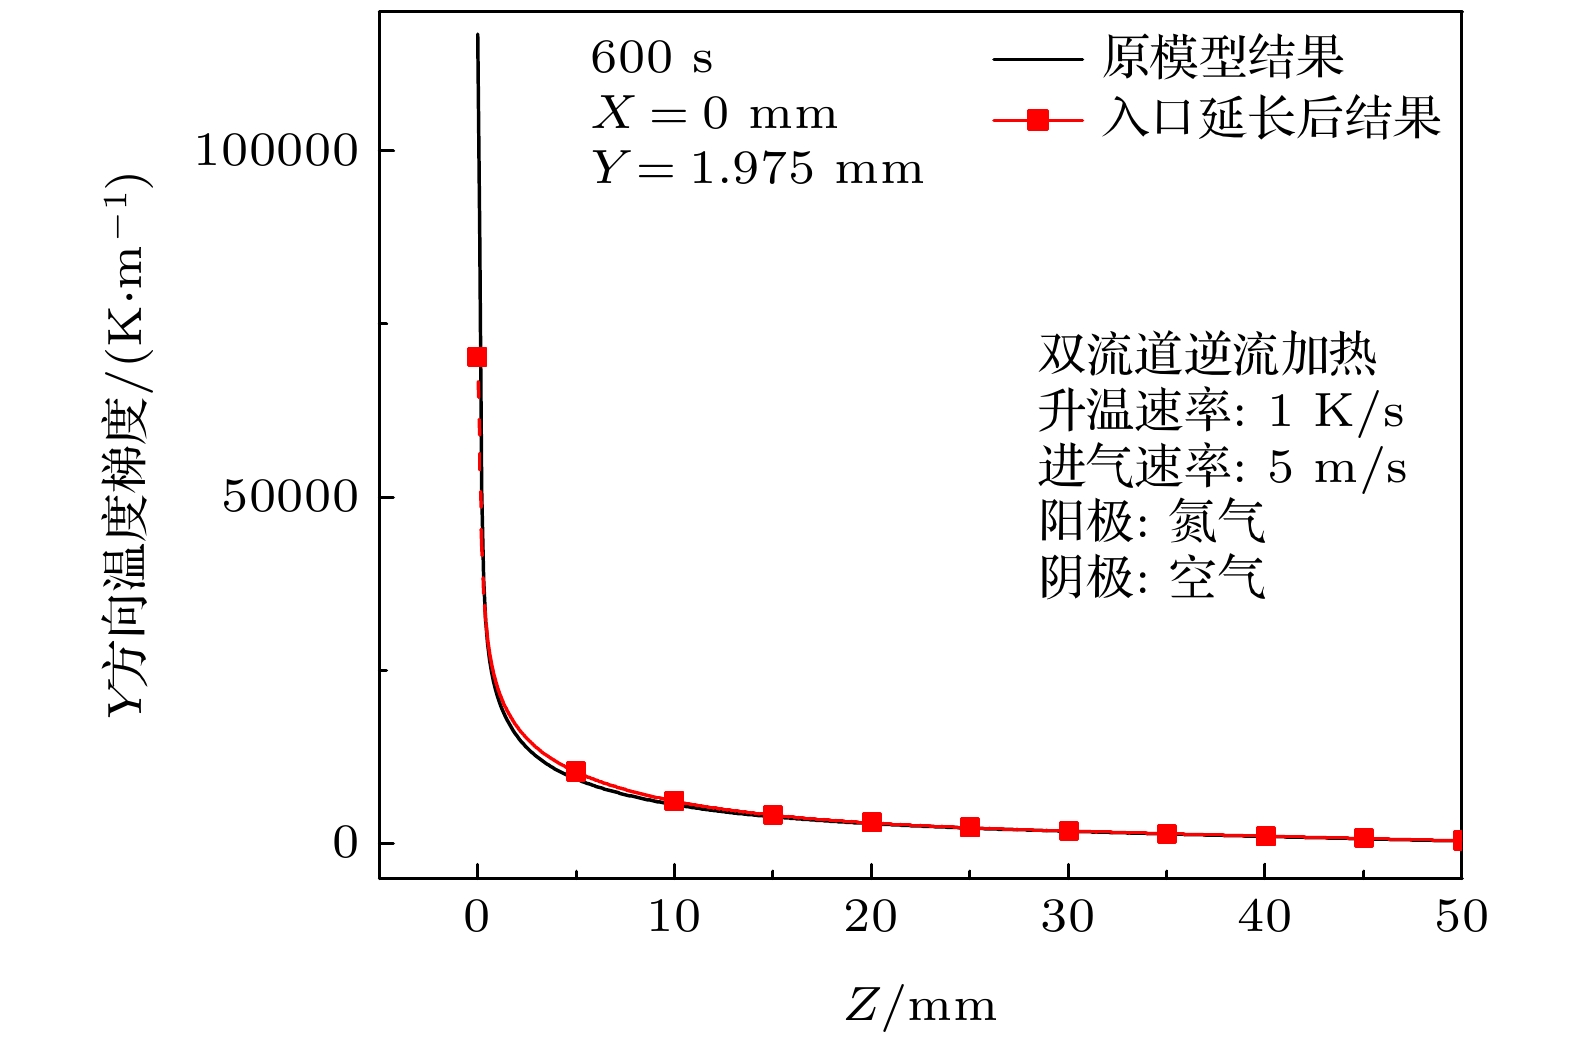
针对固体氧化物燃料电池热循环失效问题, 建立了固体氧化物燃料电池热气体预热动态模型, 研究了电池内最大温度梯度分布规律和入口异常高温度梯度形成的原因, 结果表明: 在热气体参数和预热方式变化时, 电池内最大温度梯度始终处于电池入口边缘处的电极表面; 电池入口处存在异常高的温度梯度, 且在入口一小段区域内, 温度梯度沿流动方向迅速下降; 其原因是模型中入口采用均一的平均速度和温度, “入口效应”强化气体与电池换热; 采用入口段延长的方式可使入口速度充分发展, 降低电池内最大温度梯度, 但由于均一温度入口并未优化, 入口处仍然存在很大的温度梯度和温度梯度变化; 因此采用数值模拟研究电池预热升温安全性时, 仅采用最大温度梯度作为安全性判据会高估电池内热应力.
The degradation or failure caused by thermal stress is a serious problem for solid oxide fuel cell (SOFC), especially in preheating process. The common working temperature for SOFC is more than 700 ℃, so it should be preheated to startup temperature (e.g. 600 ℃). The thermal stress induced by temperature gradient in SOFC is a crucial factor that results in the degradation or failure of SOFC, therefore there are many studies on the optimization of preheating process. Numerical model is an important tool in the study of SOFC preheating process, however there exists a serious discrepancy between the model results and experimental results. The numerical model always gives a very high temperature gradient in the SOFC which can result in SOFC crack according to the material permissible stress, and this result disagrees with the practical experimental result. In this paper, a hot gas preheating model of SOFC is developed and the model is verified by comparing with model results from the literature. Then, the location of maximum temperature gradient and distribution of temperature gradient in the SOFC are studied by this model, and the extremely high temperature gradient at entrance is analyzed. Some conclusions are given below. 1) The maximum temperature gradient is always located at the edge of SOFC nearby the gas entrance. The variation of temperature rise rate and velocity of hot gas show negligible effect on the position of maximum temperature gradient in the gas flow direction. For single channel preheating method, the maximum temperature gradient is at the gas entrance. For the dual channel preheating method, the maximum temperature gradient is always at the cathode gas entrance whatever gas feeding way is co-flow or counter-flow, because the thermal conductivity of cathode is lowest. 2) There is an extremely high temperature gradient at the gas entrance, and the temperature gradient sharply decreases along the gas flowing direction at the small entrance section. The extremely high temperature gradient may result from the uniform inlet temperature and velocity set in the model, and the entrance effect can greatly enhance the heat transfer between gas and SOFC component due to the large difference in velocity and temperature at the entrance section. 3) The entrance extension of gas channel can give rise to a fully developed velocity distribution and reduce the temperature gradient at SOFC entrance, however, there is always a high temperature gradient at the entrance section of SOFC due to the uniform inlet gas temperature. Therefore, the maximum temperature gradient given by numerical model as a criterion of SOFC safety can overestimate the thermal stress, and the distribution of temperature gradient in SOFC should be analyzed together to optimize the preheating process. -
Keywords:
- solid oxide fuel cell /
- temperature gradient /
- numerical model /
- entrance effect
[1] 衣宝廉 2003 燃料电池——原理·技术·应用 (北京: 化学工业出版社)
Yi B L 2003 Fuel Cells: Theory, Technology and Appliction (Beijing: Chemical Industry Press) (in Chinese)
[2] Singhal S C, Kendall K 2003 High-temperature Solid Oxide Fuel Cells: Fundamentals, Design and Applications (Amsterdam: ELSEVIER)
[3] Lymperopoulos N, Tsimis D, Aguilo-Rullan A, et al. 2019 ECS Trans. 91 9
 Google Scholar
[4] Vora S D, Jesionowski G, Williams M C 2019 ECS Trans. 91 27
 Google Scholar
[5] Yokokawa H, Suzuki M, Yoda M, et al. 2019 Fuel Cells 19 311
[6] Hayun H, Wolf R, Barad C, et al. 2020 J. Alloy. Compd. 821 153490
 Google Scholar
[7] Xu M, Li T S, Yang M, et al. 2016 Int. J. Hydrogen Energy 41 14927
 Google Scholar
[8] Xie J M, Hao W Q, Wang F H 2019 Int. J. Energy Res. 43 3020
 Google Scholar
[9] 樊鹏飞, 张兄文, 李国君等 2012 西安交通大学学报 46 75
Fan P F, Zhang X, Li G et al. 2012 J. Xi'an Jiaotong Univ. 46 75
[10] Hanasaki M, Uryu C, Taniguchi S, et al. 2013 ECS Trans. 57 691
 Google Scholar
[11] Bujalski W, Dikwal C M, Kendall K 2007 J. Power Sources 171 96
 Google Scholar
[12] Apfel H, Rzepka M, Tu H, et al. 2006 J. Power Sources 154 370
 Google Scholar
[13] Mirahmadi A, Valefi K 2011 J. Fuel Cell Sci. Technol. 8 061008
 Google Scholar
[14] Selimovic A, Kemm M, Torisson T, et al. 2005 J. Power Sources 145 463
 Google Scholar
[15] Damm D L, Fedorov A G 2006 J. Power Sources 159 956
 Google Scholar
[16] Colpan C O, Hamdullahpur F, Dincer I 2010 J. Power Sources 195 3579
 Google Scholar
[17] Chen M H, Jiang T L 2011 Int. J. Hydrogen Energy 36 6882
 Google Scholar
[18] Yuan P, Liu S F 2016 Int. J. Hydrogen Energy 41 12377
 Google Scholar
[19] Peksen M 2015 Int. J. Hydrogen Energy 40 12362
 Google Scholar
[20] Peksen M 2018 Int. J. Hydrogen Energy 43 354
 Google Scholar
[21] Peksen M, Al-Masri A, Blum L, et al. 2013 Int. J. Hydrogen Energy 38 4099
 Google Scholar
[22] Zheng K, Kuang Y, Rao Z, et al. 2019 J. Renewable Sustainable Energy 11 014301
 Google Scholar
[23] Atkinson A, Sun B 2007 Mater. Sci. Technol. 23 1135
 Google Scholar
[24] Sun B, Rudkin R A, Atkinson A 2009 Fuel Cells 9 805
 Google Scholar
[25] Zhang Y, Xia C 2010 J. Power Sources 195 6611
[26] Dikwal C M, Bujalski W, Kendall K 2009 J. Power Sources 193 241
[27] Aguiar P, Adjiman C S, Brandon N P 2005 J. Power Sources 147 136
 Google Scholar
[28] Kakac S, Pramuanjaroenkij A, Zhou X Y 2007 Int. J. Hydrogen Energy 32 761
 Google Scholar
[29] Beale S B, Andersson M, Boigues-Muñoz C, et al. 2021 Prog. Energy Combust. Sci. 85 100902
 Google Scholar
[30] Chen M H, Jiang T L 2012 J. Power Sources 220 331
 Google Scholar
[31] Gamrat G, Favre-Marinet M, Asendrych D 2005 Int. J. Heat Mass Transfer 48 2943
 Google Scholar
-
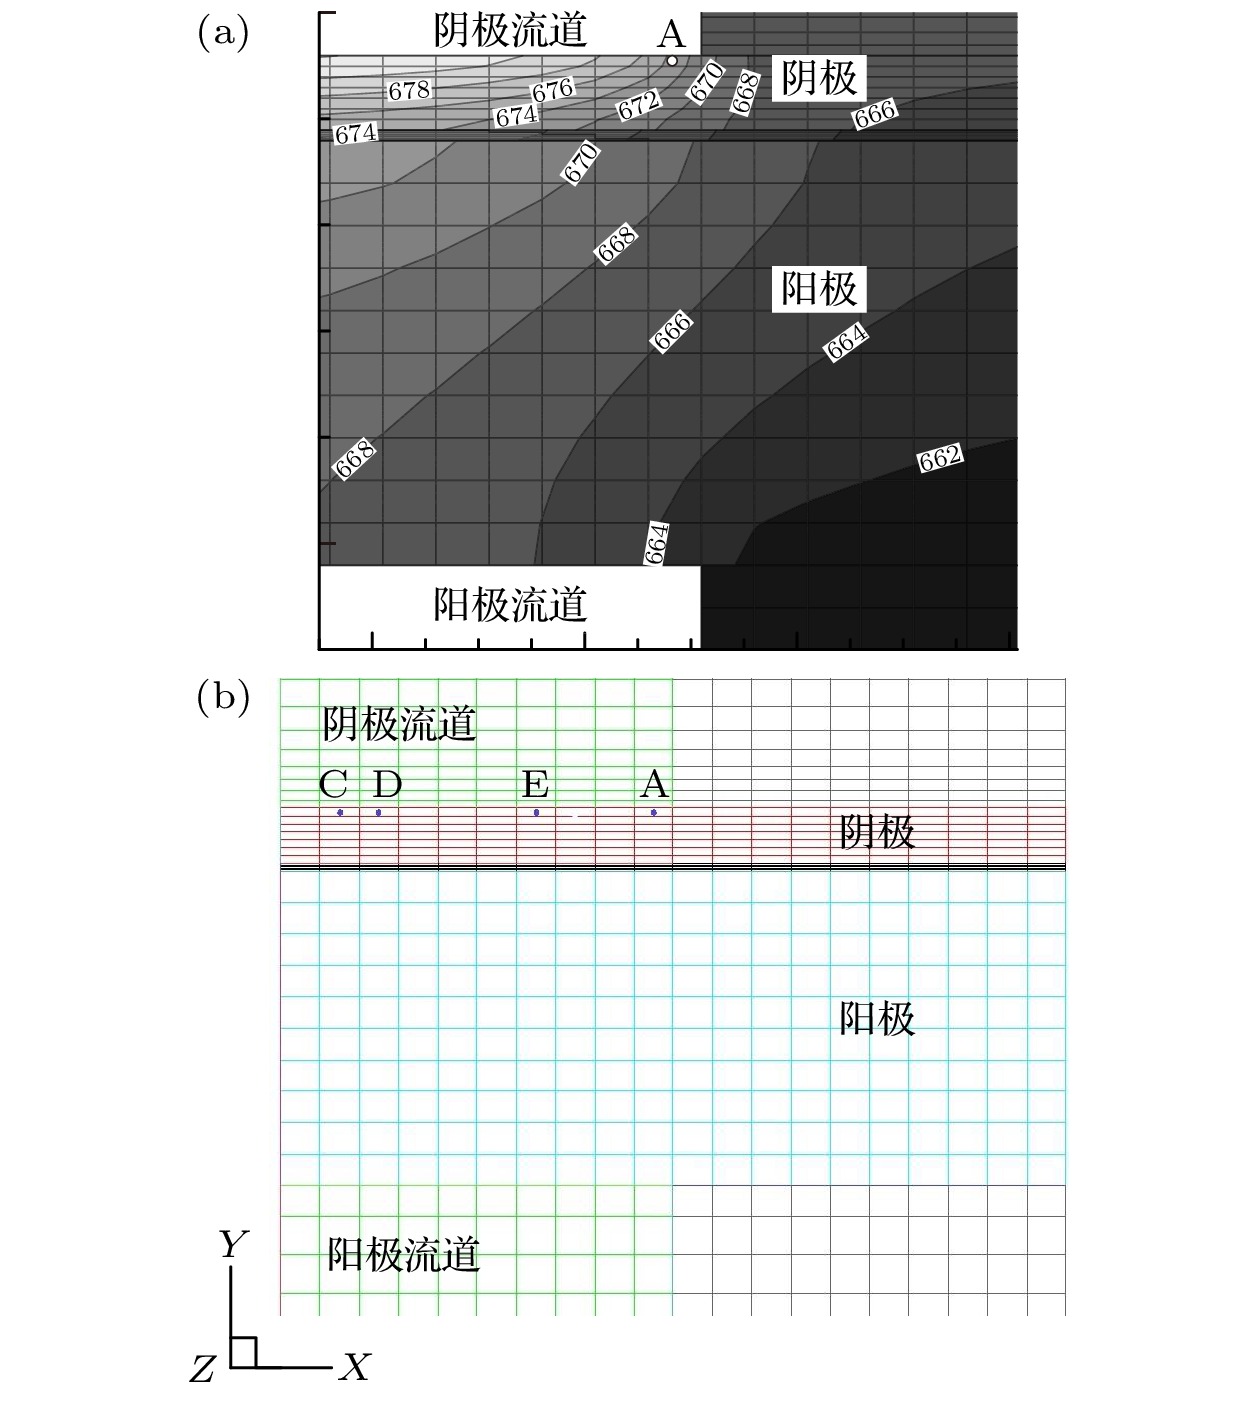
图 4 加热气体不同升温速率(a)和不同入口速度(b)时SOFC内最大温度梯度位置示意图((a) 1 K/s升温600 s后阴极入口横截面处的温度分布, 图中温度单位为K)
Fig. 4. The location of maximum temperature gradient in SOFC under different temperature rise rate (a) and inlet velocity (b) (Figure (a) is the temperature distribution of the cathode inlet section at 600 s with a 1 K/s increasing rate, temperature unit is K)
表 1 SOFC结构几何参数
Table 1. The geometry parameter of SOFC in this study
参数 值 流道高/mm 1.0 流道宽/mm 1.0 脊宽/mm 0.5 阳极厚度/mm 0.4 电解质厚度/mm 0.01 阴极厚度/mm 0.07 流道长度/mm 100 表 2 SOFC各部分结构物性参数[15]
Table 2. The physical parameters for each component of SOFC
-
[1] 衣宝廉 2003 燃料电池——原理·技术·应用 (北京: 化学工业出版社)
Yi B L 2003 Fuel Cells: Theory, Technology and Appliction (Beijing: Chemical Industry Press) (in Chinese)
[2] Singhal S C, Kendall K 2003 High-temperature Solid Oxide Fuel Cells: Fundamentals, Design and Applications (Amsterdam: ELSEVIER)
[3] Lymperopoulos N, Tsimis D, Aguilo-Rullan A, et al. 2019 ECS Trans. 91 9
 Google Scholar
[4] Vora S D, Jesionowski G, Williams M C 2019 ECS Trans. 91 27
 Google Scholar
[5] Yokokawa H, Suzuki M, Yoda M, et al. 2019 Fuel Cells 19 311
[6] Hayun H, Wolf R, Barad C, et al. 2020 J. Alloy. Compd. 821 153490
 Google Scholar
[7] Xu M, Li T S, Yang M, et al. 2016 Int. J. Hydrogen Energy 41 14927
 Google Scholar
[8] Xie J M, Hao W Q, Wang F H 2019 Int. J. Energy Res. 43 3020
 Google Scholar
[9] 樊鹏飞, 张兄文, 李国君等 2012 西安交通大学学报 46 75
Fan P F, Zhang X, Li G et al. 2012 J. Xi'an Jiaotong Univ. 46 75
[10] Hanasaki M, Uryu C, Taniguchi S, et al. 2013 ECS Trans. 57 691
 Google Scholar
[11] Bujalski W, Dikwal C M, Kendall K 2007 J. Power Sources 171 96
 Google Scholar
[12] Apfel H, Rzepka M, Tu H, et al. 2006 J. Power Sources 154 370
 Google Scholar
[13] Mirahmadi A, Valefi K 2011 J. Fuel Cell Sci. Technol. 8 061008
 Google Scholar
[14] Selimovic A, Kemm M, Torisson T, et al. 2005 J. Power Sources 145 463
 Google Scholar
[15] Damm D L, Fedorov A G 2006 J. Power Sources 159 956
 Google Scholar
[16] Colpan C O, Hamdullahpur F, Dincer I 2010 J. Power Sources 195 3579
 Google Scholar
[17] Chen M H, Jiang T L 2011 Int. J. Hydrogen Energy 36 6882
 Google Scholar
[18] Yuan P, Liu S F 2016 Int. J. Hydrogen Energy 41 12377
 Google Scholar
[19] Peksen M 2015 Int. J. Hydrogen Energy 40 12362
 Google Scholar
[20] Peksen M 2018 Int. J. Hydrogen Energy 43 354
 Google Scholar
[21] Peksen M, Al-Masri A, Blum L, et al. 2013 Int. J. Hydrogen Energy 38 4099
 Google Scholar
[22] Zheng K, Kuang Y, Rao Z, et al. 2019 J. Renewable Sustainable Energy 11 014301
 Google Scholar
[23] Atkinson A, Sun B 2007 Mater. Sci. Technol. 23 1135
 Google Scholar
[24] Sun B, Rudkin R A, Atkinson A 2009 Fuel Cells 9 805
 Google Scholar
[25] Zhang Y, Xia C 2010 J. Power Sources 195 6611
[26] Dikwal C M, Bujalski W, Kendall K 2009 J. Power Sources 193 241
[27] Aguiar P, Adjiman C S, Brandon N P 2005 J. Power Sources 147 136
 Google Scholar
[28] Kakac S, Pramuanjaroenkij A, Zhou X Y 2007 Int. J. Hydrogen Energy 32 761
 Google Scholar
[29] Beale S B, Andersson M, Boigues-Muñoz C, et al. 2021 Prog. Energy Combust. Sci. 85 100902
 Google Scholar
[30] Chen M H, Jiang T L 2012 J. Power Sources 220 331
 Google Scholar
[31] Gamrat G, Favre-Marinet M, Asendrych D 2005 Int. J. Heat Mass Transfer 48 2943
 Google Scholar
计量
- 文章访问数: 5667
- PDF下载量: 124
- 被引次数: 0


 下载:
下载:
