


-
Ostwald ripening behaviors of bubbles in porous medium are observed commonly in various fields, including CO2 geological storage, preparation of porous materials, and fuel cells. A three-dimensional pore network model based on concentration coupling calculation has been developed to investigate the ripening characteristics of bubbles in porous medium on a pore scale. This model takes into account the shape of bubble, the structure of porous medium, and mass transfer between gas and liquid. By solving the gas phase concentration of each pore body in the three-dimensional pore network, the model can track the evolution process of each bubble. A microfluidic chip with a four-pore structure is used to validate the reliability of the model through visual experiments. To analyze the effect of porous medium heterogeneity on the bubble ripening process, two different three-dimensional pore network structures with varying pore sizes are constructed and the ripening processes of bubbles in two regions are simulated numerically. The results show that the initial distribution of bubbles can affect the ripening process of porous medium. When bubbles are uniformly distributed, in the ripening process, they exhibit regular and systematic changes in their spacing. However, in the case of uneven bubble distribution, as the bubbles transfer from smaller pore region to larger pore region, they also undergo individual mass transfer towards the larger bubble region in their respective areas. Consequently, the remaining bubbles no longer maintain a spaced distribution pattern. Additionally, the differences in initial size among bubbles can accelerate the ripening process, resulting in a significantly shorter ripening time than that in a uniform distribution. The choice of pore number has a significant influence on continuous-scale equivalent parameters, such as average capillary pressure and saturation. As the number of pores increases, the capillary pressure and saturation exhibit a more regular, nonlinear variation. A relationship between capillary pressure and saturation in the small pore region and in the large pore region are established, which deviate from the assumptions made in the existing literature. This result provides important guidance for constructing the continuous-scale ripening model that can be used to predict the evolution process of CO2 during geological storage and provide guidance for studying the influence mechanism of heterogeneity during long-term CO2 storage.
-
Keywords:
- porous media /
- bubbles /
- Ostwald ripening /
- pore network model
[1] Chang F M, Sheng Y J, Cheng S L, Tsao H K 2008 Appl. Phys. Lett. 92 264102
 Google Scholar
[2] 宋保维, 任峰, 胡海豹, 郭云鹤 2014 63 054708
Google Scholar
Song B W, Ren F, Hu H B, Guo Y H 2014 Acta Phys. Sin. 63 054708
Google Scholar
[3] Feng L, Zhang Z Y, Mai Z H, Ma Y M, Liu B Q, Jiang L, Zhu D B 2004 Angew. Chem. Int. Ed. 43 2012
Google Scholar
[4] Lautze N C, Sisson T W, Mangan M T, Grove T L 2010 Contrib. Mineral Petrol. 161 331
Google Scholar
[5] Masotta M, Ni H, Keppler H 2014 Contrib. Mineral. Petrol. 167 976
Google Scholar
[6] Huang Z D, Su M, Yang Q, Li Z, Chen S R, Li Y F, Zhou X, Li F Y, Song Y L 2017 Nat. Commun. 8 14110
Google Scholar
[7] 严达利, 李申予, 刘士余, 竺云 2015 64 137104
Google Scholar
Yan D L, Li S Y, Liu S Y, Zhu Y 2015 Acta Phys. Sin. 64 137104
Google Scholar
[8] Bachu S 2008 Prog. Energy Combust. Sci. 34 254
Google Scholar
[9] Singh D, Friis H A, Jettestuen E, Helland J O 2022 Transport Porous Med. 145 441
Google Scholar
[10] Iglauer S, Pentland C H, Busch A 2015 Water Resour Res. 51 729
Google Scholar
[11] Rahman T, Lebedev M, Barifcani A, Iglauer S 2016 J. Colloid Interface Sci. 469 63
Google Scholar
[12] Lifshitz I M, Slyozov V V 1961 J. Phys. Chem. Solids. 19 35
Google Scholar
[13] Voorhees P W 1992 Annu. Rev. Mater. Sci. 22 197
Google Scholar
[14] Burlakov V M 2006 Phys. Rev. Lett. 97 155703
Google Scholar
[15] Schmelzer J, Schweitzer F 1987 J. Non-Equilib. Thermodyn. 12 255
Google Scholar
[16] Xu R N, Li R, Huang F, Jiang P X 2017 Sci. Bull. 62 795
Google Scholar
[17] Xu K, Liang T B, Zhu P X, Qi P P, Lu J, Huh C, Balhoff M 2017 Lab. Chip. 17 640
Google Scholar
[18] Li Y, Garing C, Benson S M 2020 J. Fluid Mech. 889 A14
Google Scholar
[19] Blunt M J, Bijeljic B, Dong H, Gharbi O, Iglauer S, Mostaghimi P, Paluszny A, Pentland C 2013 Adv. Water Resour. 51 197
Google Scholar
[20] Golparvar A, Zhou Y, Wu K, Ma J, Yu Z 2018 Adv. Geo. Energy Res. 2 418
Google Scholar
[21] Kohanpur A H, Valocchi A J 2020 Transport. Porous Med. 135 659
Google Scholar
[22] Xu K, Mehmani Y, Shang L, Xiong Q 2019 Geophy. Res. Lett. 46 13804
Google Scholar
[23] Xu K, Bonnecaze R, Balhoff M 2017 Phys. Rev. Lett. 119 264502
Google Scholar
[24] Mehmani Y, Xu K 2022 J. Comput. Phys. 457 111041
Google Scholar
[25] de Chalendar J A, Garing C, Benson S M 2017 Energy Procedia. 114 4857
Google Scholar
[26] Vorst H A 1992 SIAM J. Sci. Stat. Comput. 13 631
Google Scholar
[27] Pallas N R, Pethica B A 1983 Colloid Surface 6 221
Google Scholar
[28] Versteeg G F, Van Swaaij W P M 1988 J. Chem. Eng. Data. 33 29
Google Scholar
[29] 周志毅, 王进卿, 王广鑫, 池作和, 翁煜侃 2022 化工进展 41 1265
Google Scholar
Zhou Z Y, Wang J Q, Wang G X, Chi Z H, Weng Y K 2022 Chem. Ind. Eng. Prog. 41 1265
Google Scholar
[30] Blunt M J 2022 Phys. Rev. E 106 045103
Google Scholar
[31] McClure J E, Berrill M A, Gray W G, Miller C T 2016 Phys. Rev. E 94 033102
Google Scholar
-

图 1 双气泡系统传质过程
Figure 1. Two-bubble system mass transfer process.
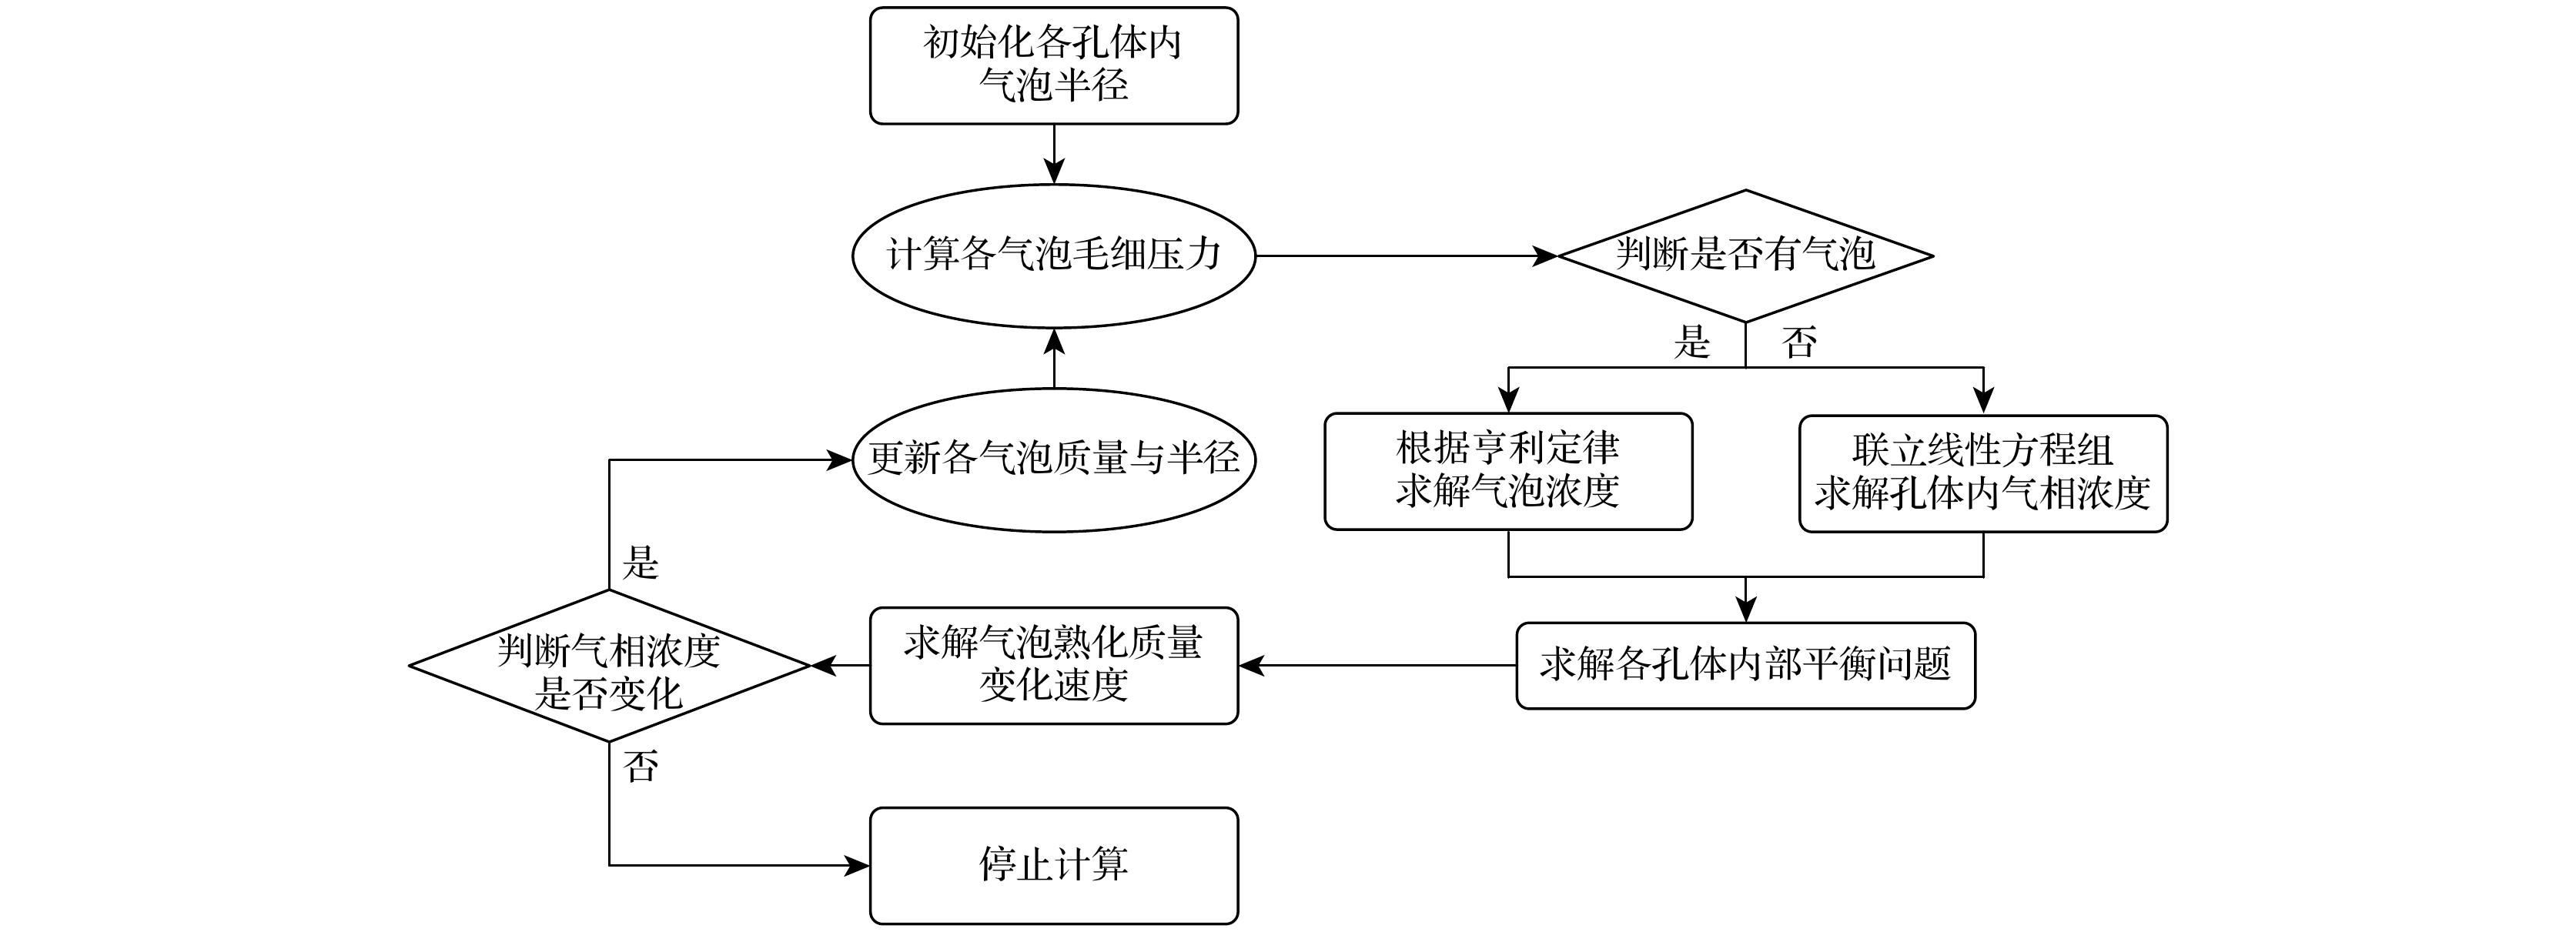
图 2 计算程序算法流程图
Figure 2. Flow chart for the calculation algorithm.
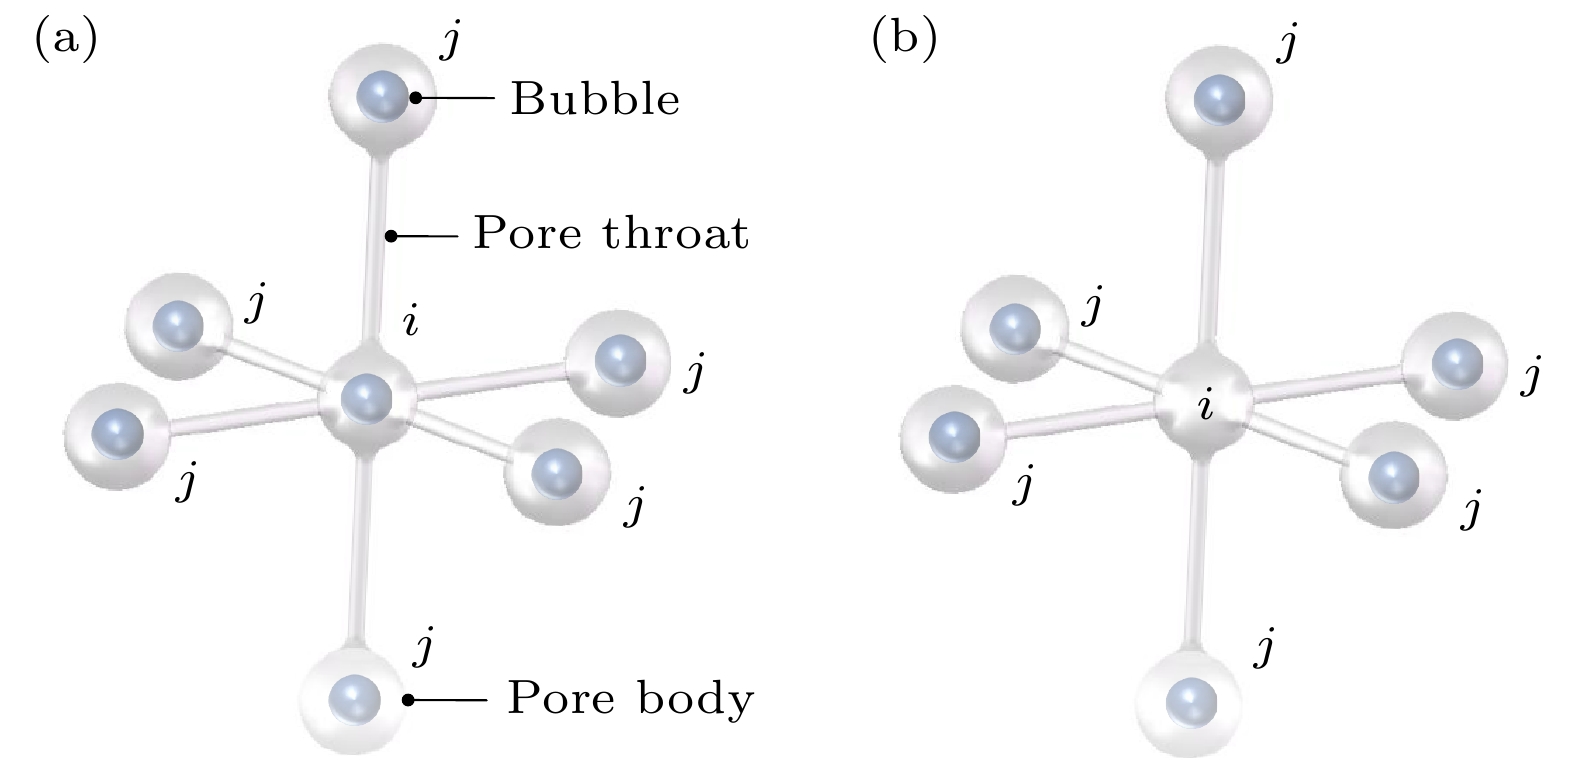
图 3 数值计算模型 (a)孔体i内为气泡; (b)孔体i内为液相
Figure 3. Numerical calculation model: (a) Pore body i with a bubble; (b) pore body i filled with liquid phase.
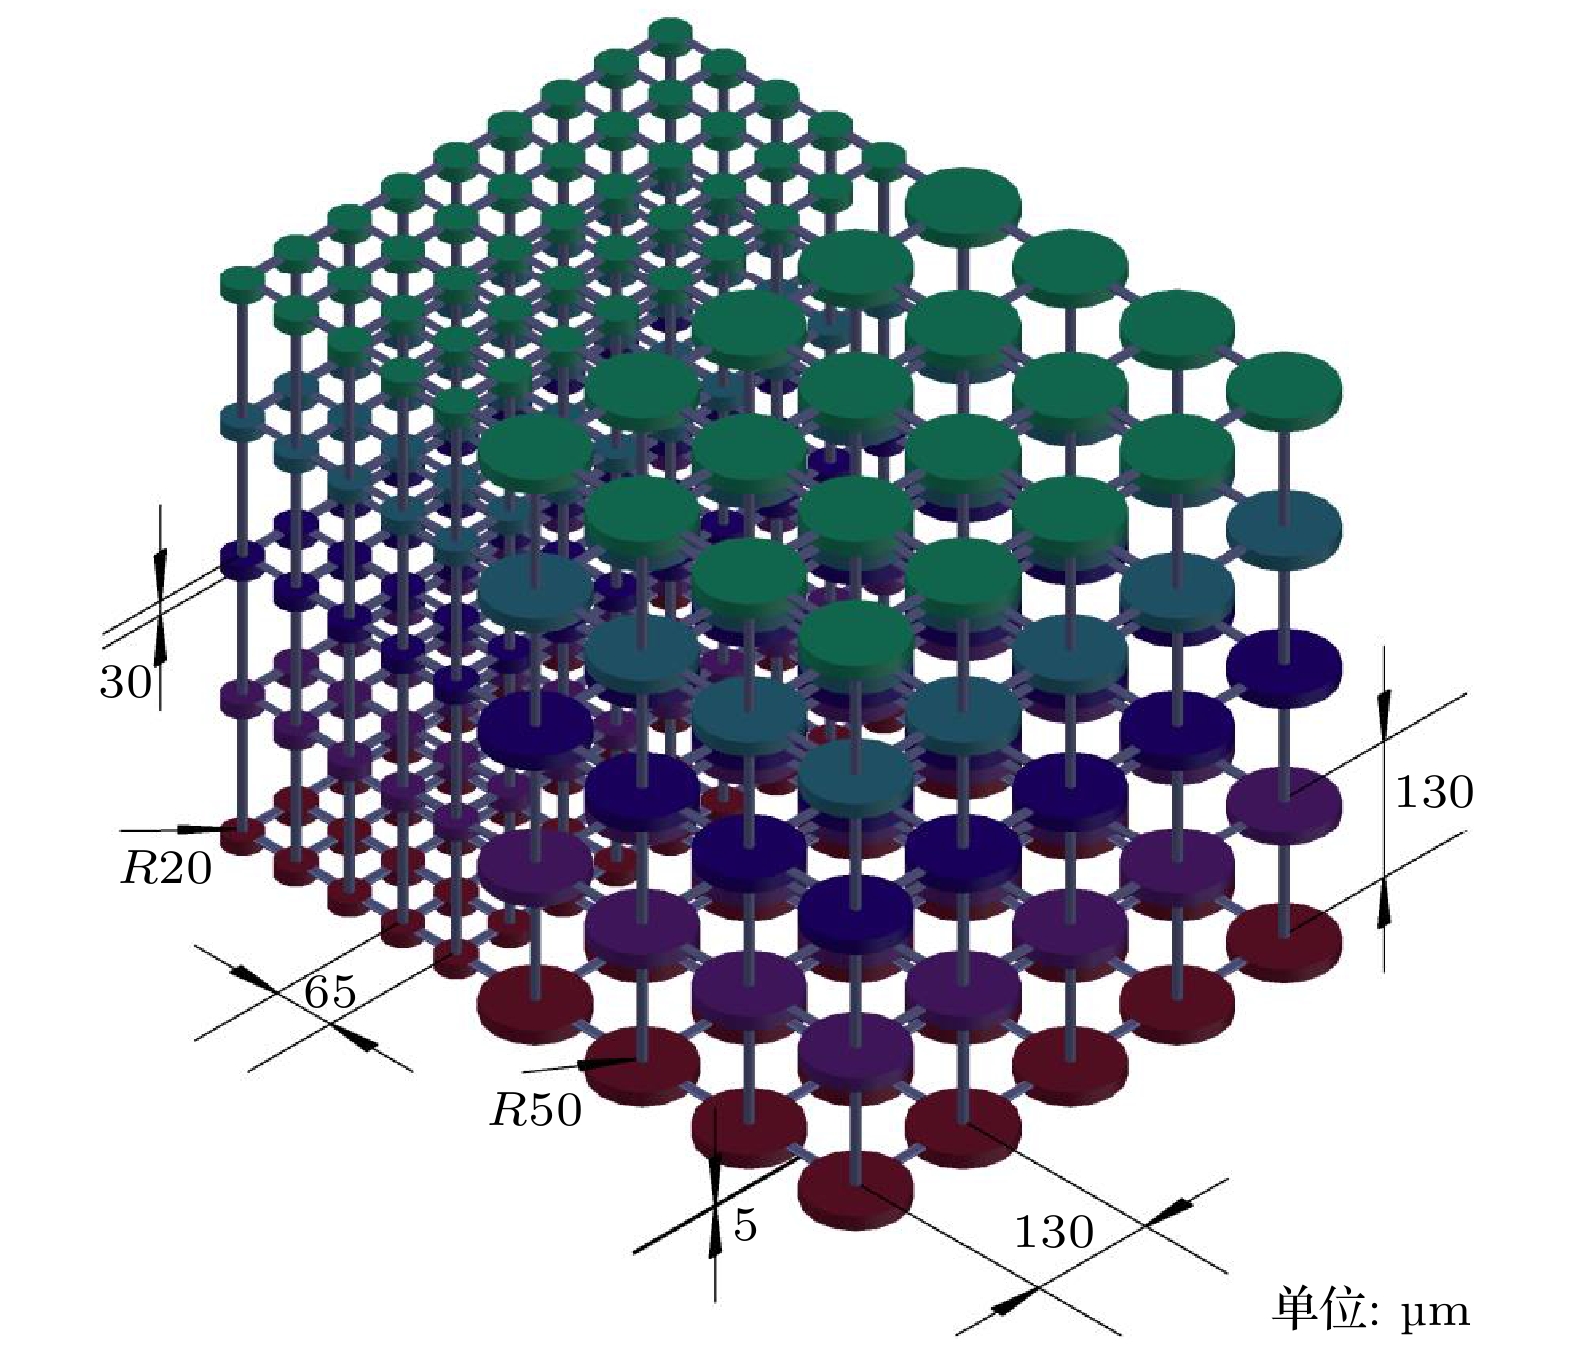
图 4 多孔隙结构熟化模型
Figure 4. Multi bubble ripening model.
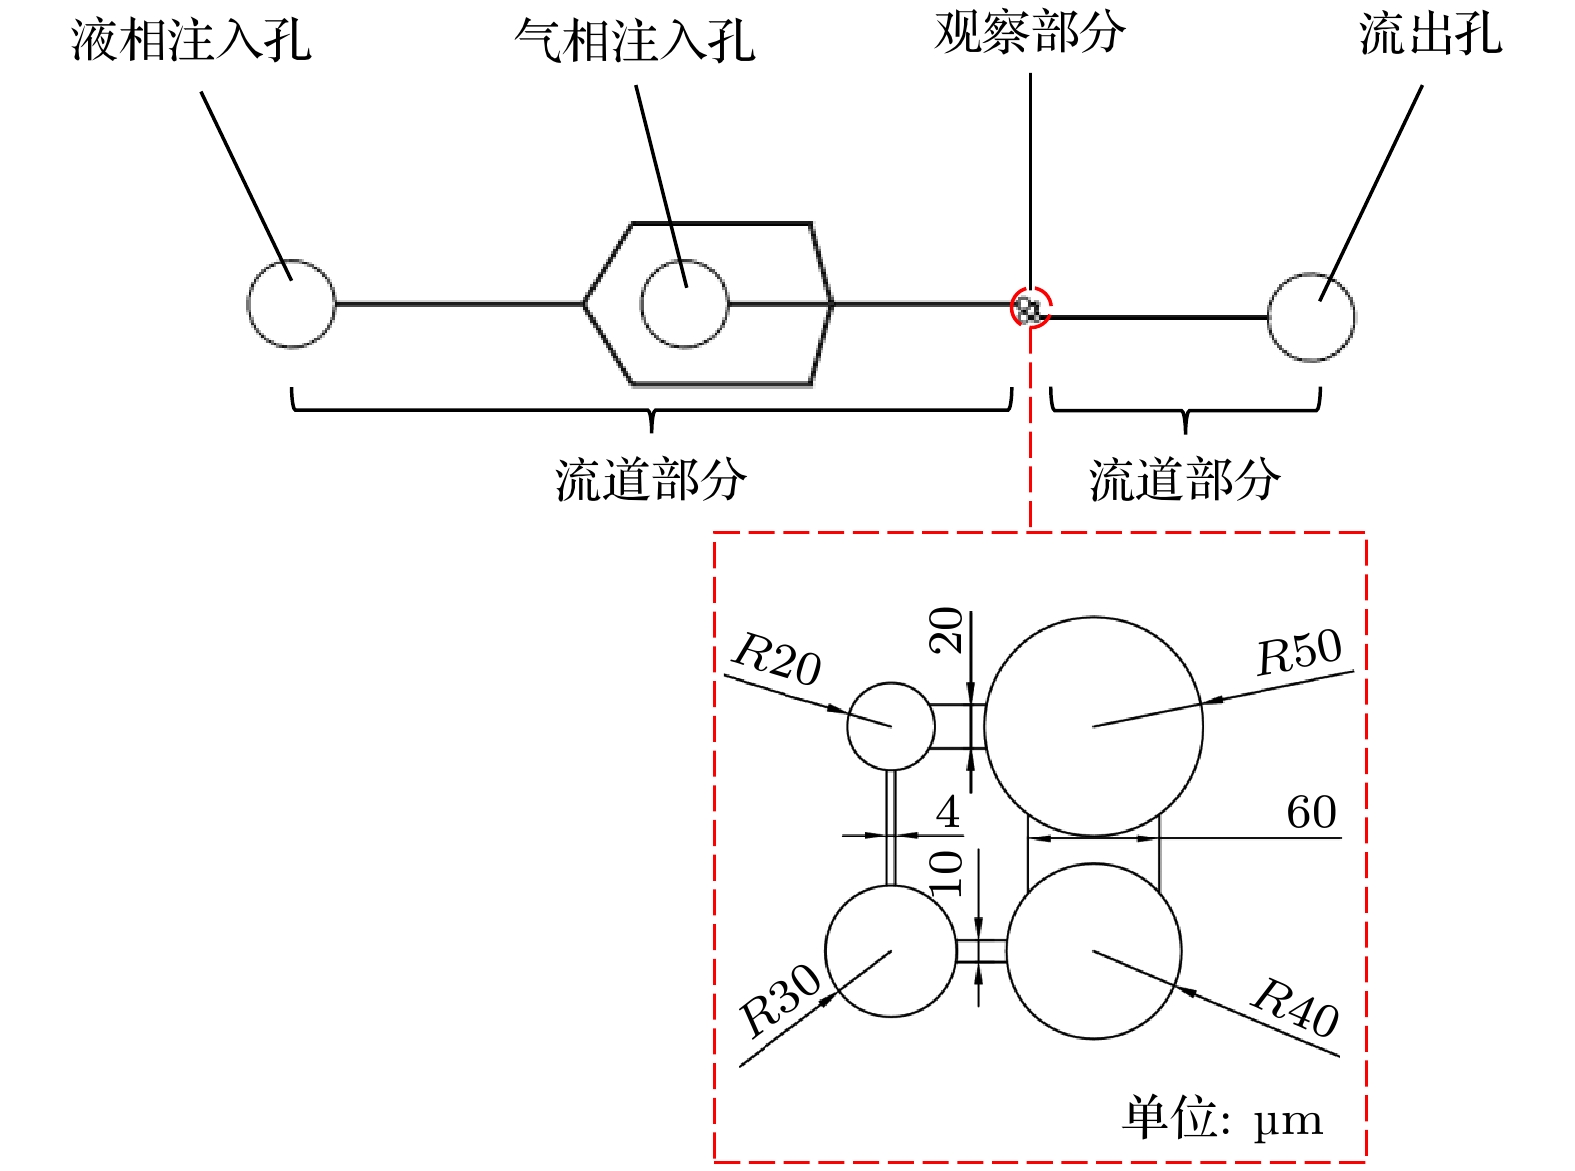
图 5 微流控芯片内部结构
Figure 5. Internal structure of microfluidic chip.
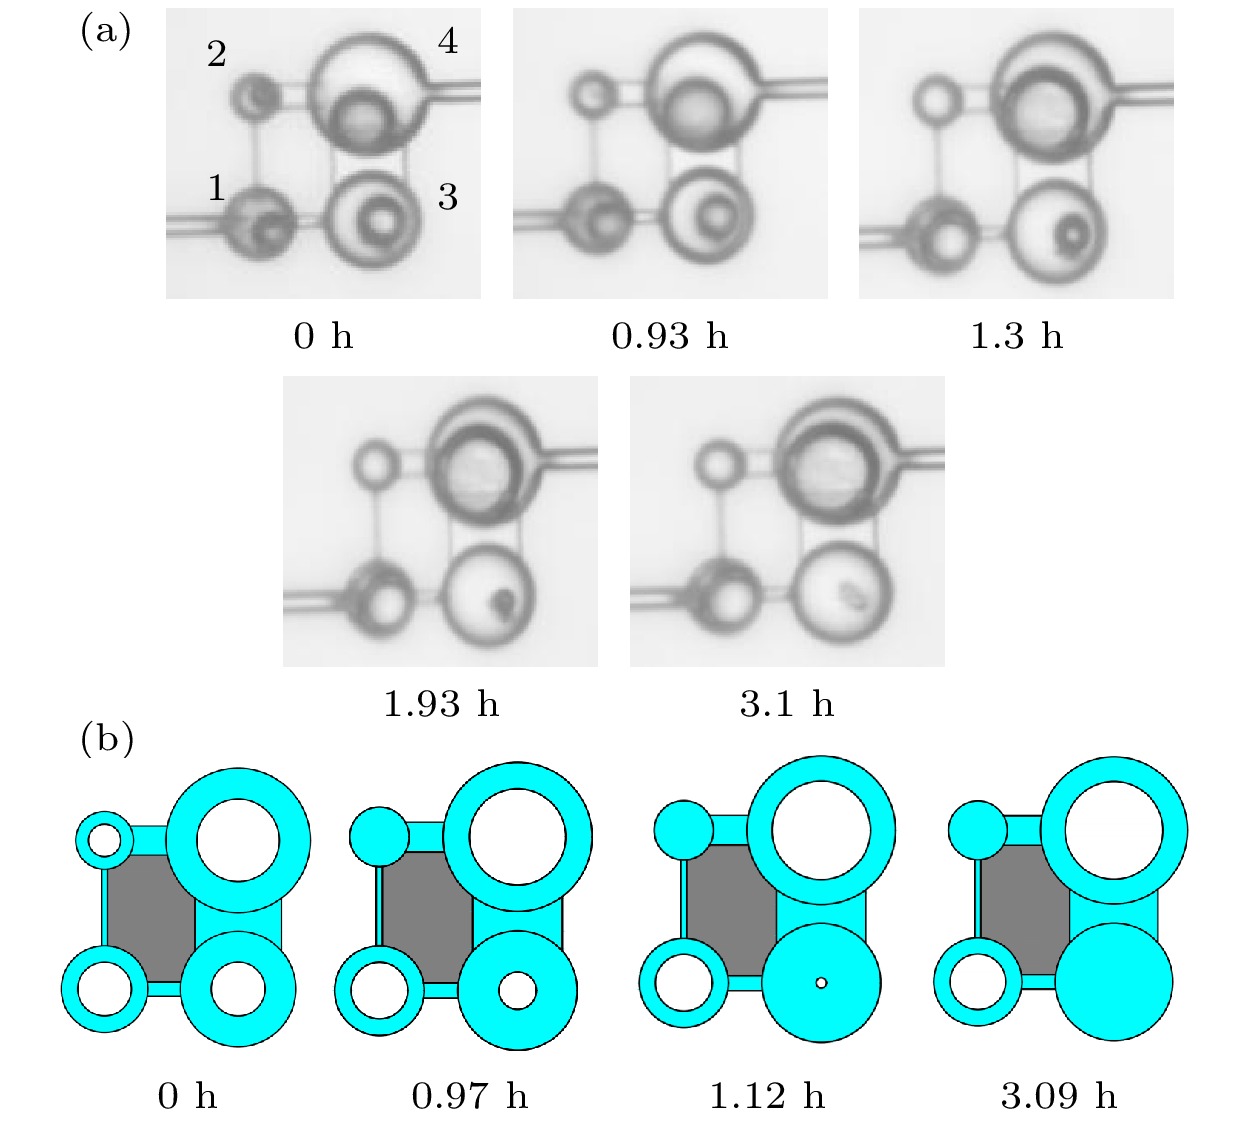
图 6 四孔隙结构气泡熟化过程 (a)实验过程; (b)模拟过程
Figure 6. Four bubble ripening system: (a) Experiments process; (b) simulations process.

图 7 四孔隙结构气泡半径随时间变化
Figure 7. Evolution of curvature radius in four bubble ripening system.

图 8 工况1#模拟结果 (a)气泡演化过程, 其中白色区域为CO2气泡, 蓝色区域为去离子水, 灰色区域为硅颗粒; (b) CO2气泡曲率半径变化图
Figure 8. Simulation results of condition 1#: (a) Bubble evolution process, where the white regions are CO2 bubble, blue regions are filled with DI water, and the gray regions are silicon grains; (b) curvature radius variation diagram of each CO2 bubble.
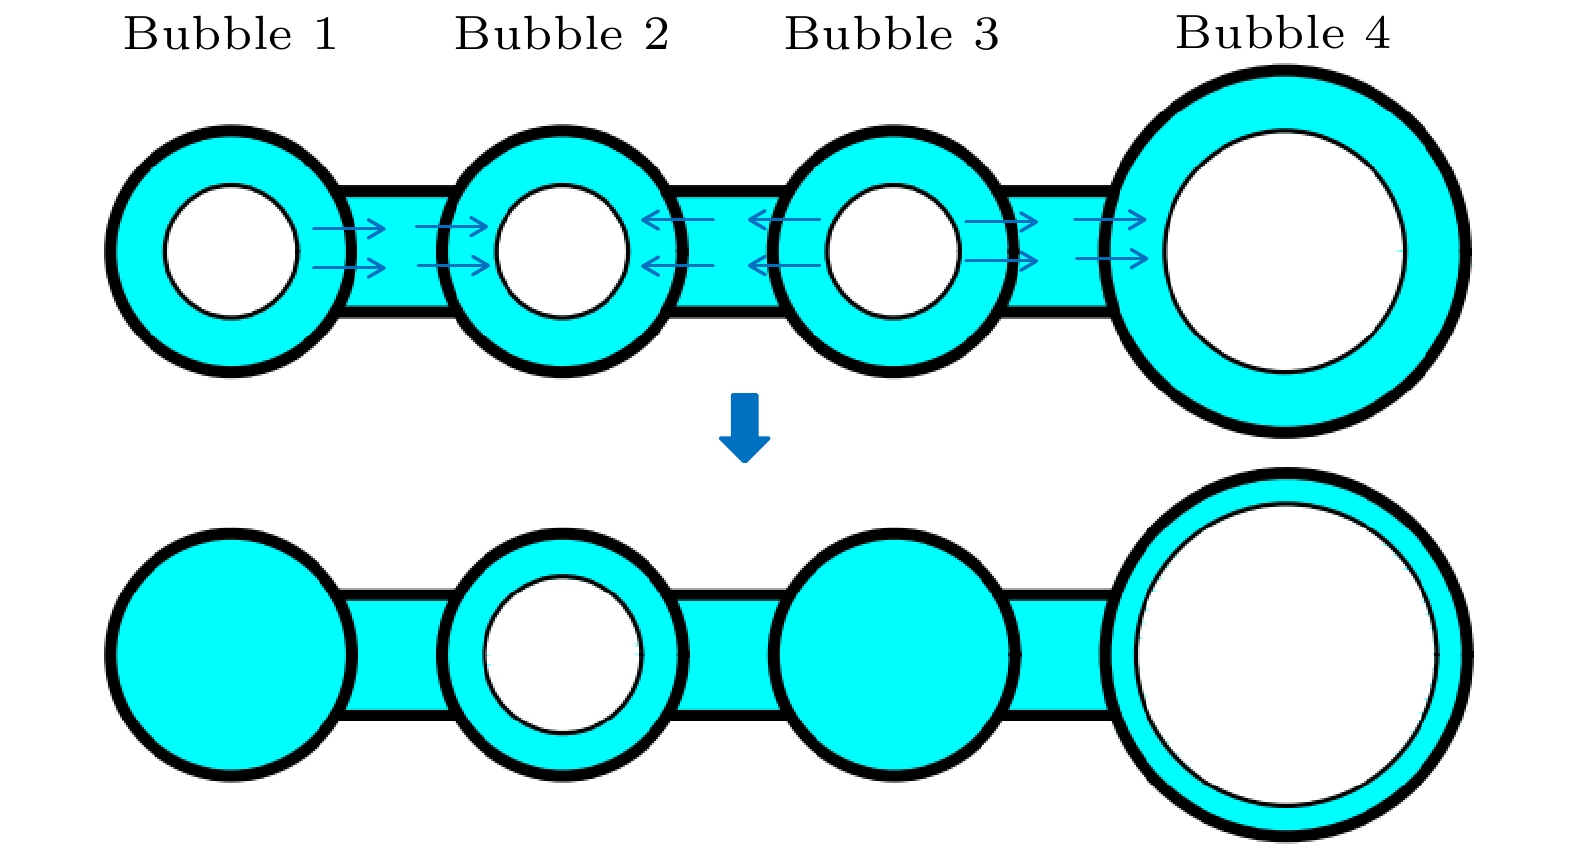
图 9 一维孔隙结构气泡熟化过程
Figure 9. Bubble evolution process of one-dimensional structure.
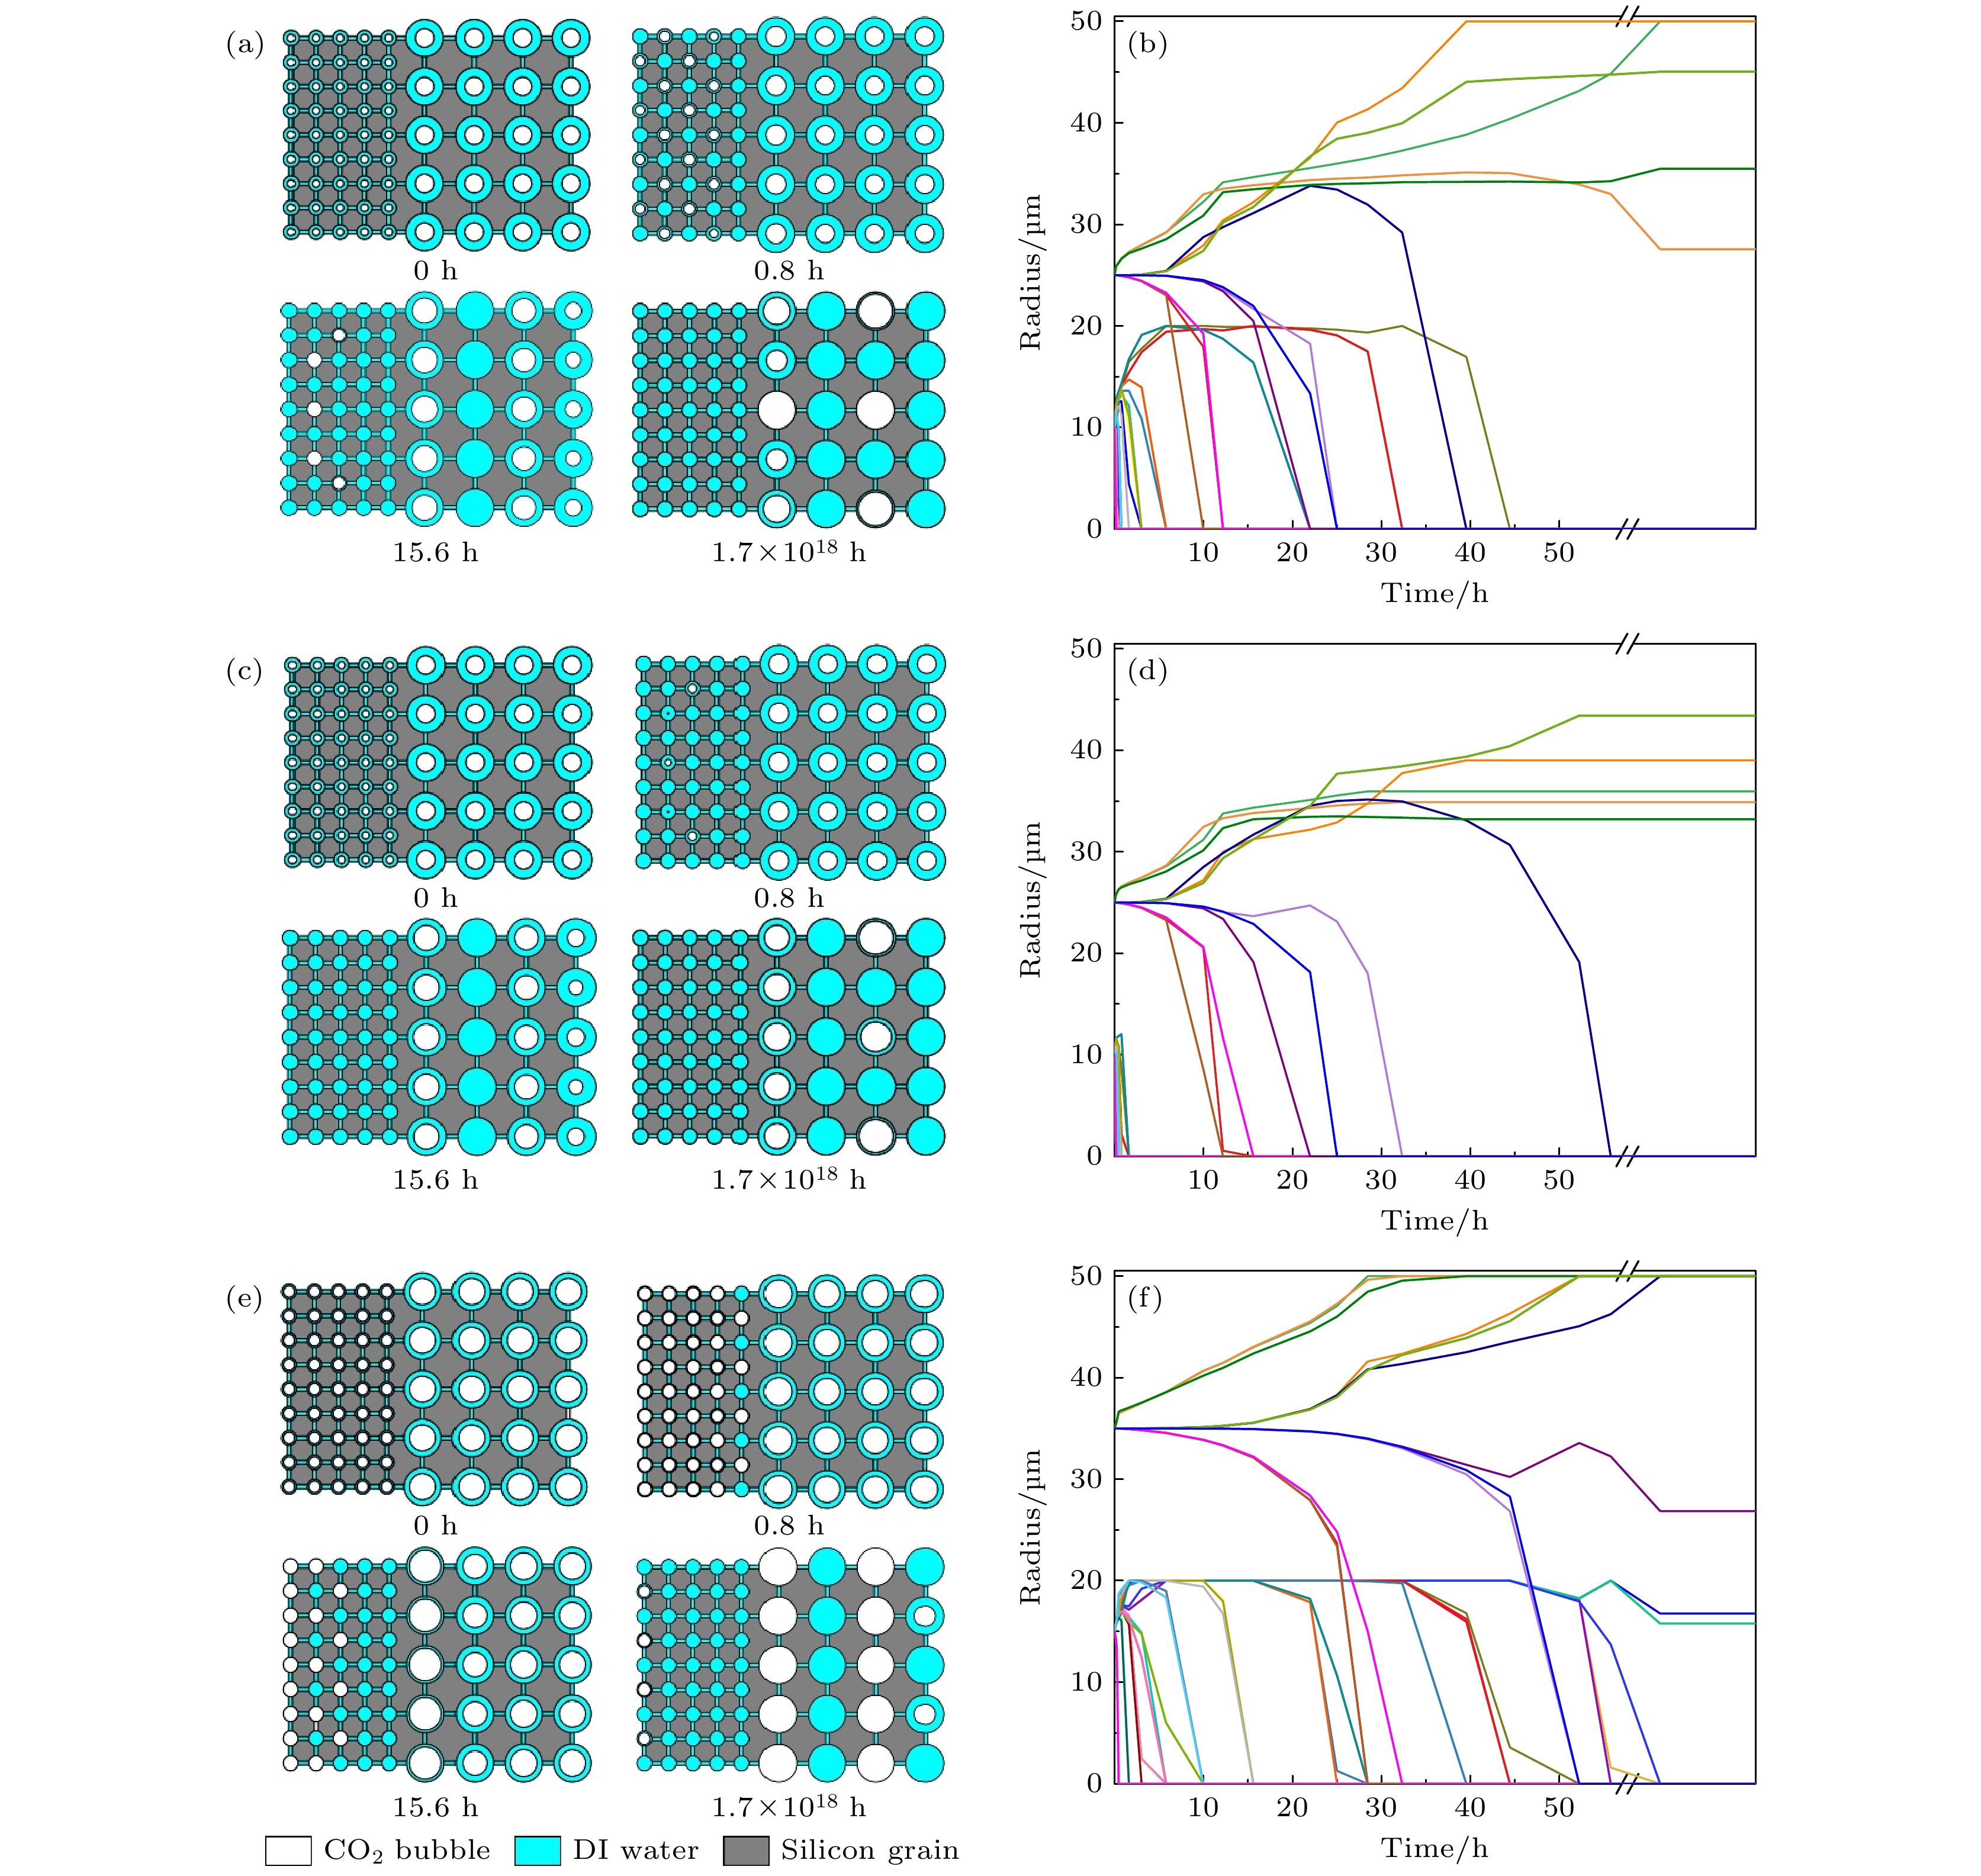
图 10 工况2#模拟结果 (a)第1层和第5层气泡演化过程; (b)第1层和第5层CO2气泡曲率半径变化; (c)第2层和第4层气泡演化过程; (d)第2层和第4层CO2气泡曲率半径变化; (e)第3层气泡演化过程; (f)第3层CO2气泡曲率半径变化
Figure 10. Simulation results of condition 2#: (a) Bubble evolution process in layers 1 and 5; (b) curvature radius variation of each CO2 bubble in layers 1 and 5; (c) bubble evolution process in layers 2 and 4; (d) curvature radius variation of each CO2 bubble in layers 2 and 4; (e) bubble evolution process in layer 3; (f) curvature radius variation of each CO2 bubble in layer 3.

图 11 CO2气泡各参数变化图 (a)毛细力; (b) CO2饱和度
Figure 11. Variation diagram of CO2 bubble parameters: (a) Capillary pressure; (b) CO2 saturation.
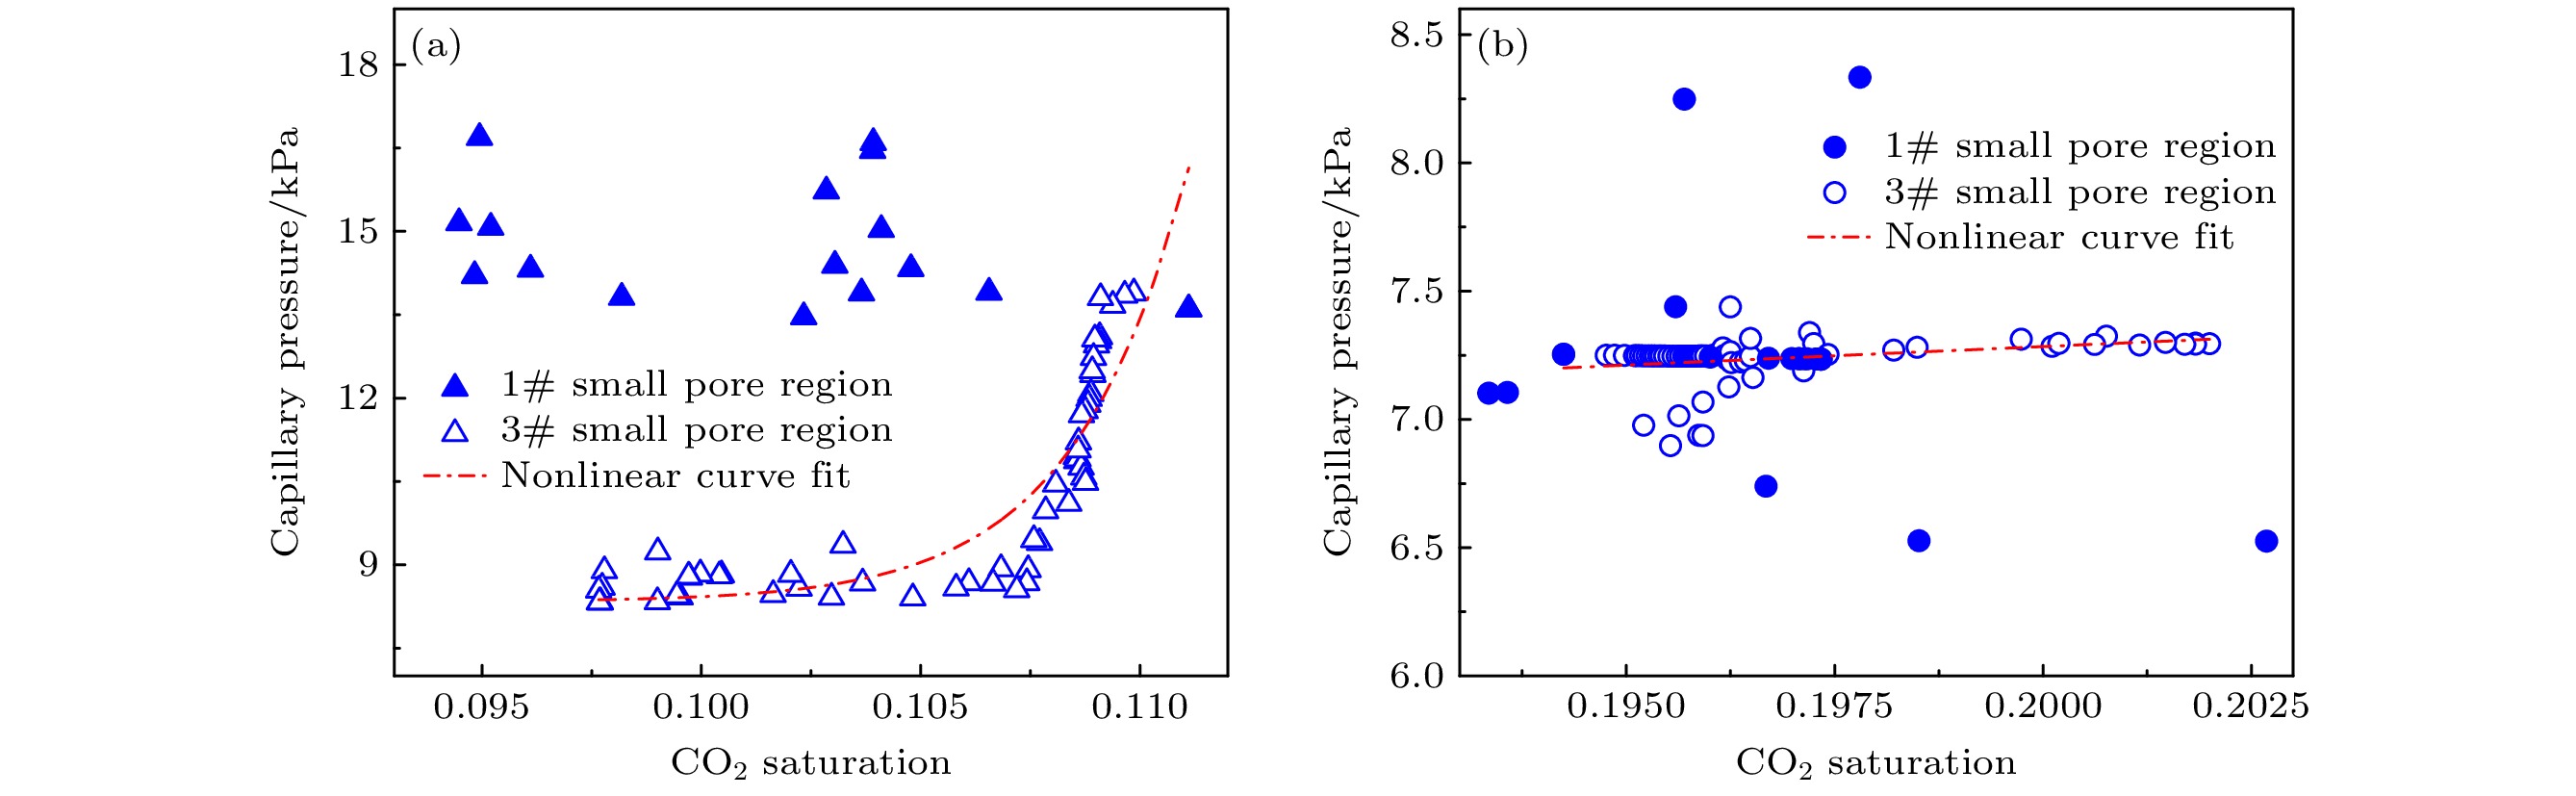
图 12 气泡毛细力与CO2饱和度关系对比图 (a)小孔隙区域; (b)大孔隙区域
Figure 12. Comparison of capillary pressure with CO2 saturation curves: (a) Small pore region; (b) large pore region.
表 1 模拟工况参数
Table 1. Simulation parameters of three conditions.
工况 行数 列数 层数 孔体总数 各层气泡初始半径 R/μm 1, 2 3 4, 5 1# 大孔隙区域 5 4 5 100 25 25 25 小孔隙区域 9 5 5 225 10 10 10 2# 大孔隙区域 5 4 5 100 25 35 25 小孔隙区域 9 5 5 225 10 15 10 3# 大孔隙区域 10 32 10 3200 25 25 25 小孔隙区域 19 40 10 7600 10 10 10  DownLoad: CSV
表 2 四孔隙及多孔隙结构气泡熟化模拟参数
Table 2. Simulation parameters of four bubble and muti bubble ripening system.
DownLoad: CSV
-
[1] Chang F M, Sheng Y J, Cheng S L, Tsao H K 2008 Appl. Phys. Lett. 92 264102
Google Scholar
[2] 宋保维, 任峰, 胡海豹, 郭云鹤 2014 63 054708
Google Scholar
Song B W, Ren F, Hu H B, Guo Y H 2014 Acta Phys. Sin. 63 054708
Google Scholar
[3] Feng L, Zhang Z Y, Mai Z H, Ma Y M, Liu B Q, Jiang L, Zhu D B 2004 Angew. Chem. Int. Ed. 43 2012
Google Scholar
[4] Lautze N C, Sisson T W, Mangan M T, Grove T L 2010 Contrib. Mineral Petrol. 161 331
Google Scholar
[5] Masotta M, Ni H, Keppler H 2014 Contrib. Mineral. Petrol. 167 976
Google Scholar
[6] Huang Z D, Su M, Yang Q, Li Z, Chen S R, Li Y F, Zhou X, Li F Y, Song Y L 2017 Nat. Commun. 8 14110
Google Scholar
[7] 严达利, 李申予, 刘士余, 竺云 2015 64 137104
Google Scholar
Yan D L, Li S Y, Liu S Y, Zhu Y 2015 Acta Phys. Sin. 64 137104
Google Scholar
[8] Bachu S 2008 Prog. Energy Combust. Sci. 34 254
Google Scholar
[9] Singh D, Friis H A, Jettestuen E, Helland J O 2022 Transport Porous Med. 145 441
Google Scholar
[10] Iglauer S, Pentland C H, Busch A 2015 Water Resour Res. 51 729
Google Scholar
[11] Rahman T, Lebedev M, Barifcani A, Iglauer S 2016 J. Colloid Interface Sci. 469 63
Google Scholar
[12] Lifshitz I M, Slyozov V V 1961 J. Phys. Chem. Solids. 19 35
Google Scholar
[13] Voorhees P W 1992 Annu. Rev. Mater. Sci. 22 197
Google Scholar
[14] Burlakov V M 2006 Phys. Rev. Lett. 97 155703
Google Scholar
[15] Schmelzer J, Schweitzer F 1987 J. Non-Equilib. Thermodyn. 12 255
Google Scholar
[16] Xu R N, Li R, Huang F, Jiang P X 2017 Sci. Bull. 62 795
Google Scholar
[17] Xu K, Liang T B, Zhu P X, Qi P P, Lu J, Huh C, Balhoff M 2017 Lab. Chip. 17 640
Google Scholar
[18] Li Y, Garing C, Benson S M 2020 J. Fluid Mech. 889 A14
Google Scholar
[19] Blunt M J, Bijeljic B, Dong H, Gharbi O, Iglauer S, Mostaghimi P, Paluszny A, Pentland C 2013 Adv. Water Resour. 51 197
Google Scholar
[20] Golparvar A, Zhou Y, Wu K, Ma J, Yu Z 2018 Adv. Geo. Energy Res. 2 418
Google Scholar
[21] Kohanpur A H, Valocchi A J 2020 Transport. Porous Med. 135 659
Google Scholar
[22] Xu K, Mehmani Y, Shang L, Xiong Q 2019 Geophy. Res. Lett. 46 13804
Google Scholar
[23] Xu K, Bonnecaze R, Balhoff M 2017 Phys. Rev. Lett. 119 264502
Google Scholar
[24] Mehmani Y, Xu K 2022 J. Comput. Phys. 457 111041
Google Scholar
[25] de Chalendar J A, Garing C, Benson S M 2017 Energy Procedia. 114 4857
Google Scholar
[26] Vorst H A 1992 SIAM J. Sci. Stat. Comput. 13 631
Google Scholar
[27] Pallas N R, Pethica B A 1983 Colloid Surface 6 221
Google Scholar
[28] Versteeg G F, Van Swaaij W P M 1988 J. Chem. Eng. Data. 33 29
Google Scholar
[29] 周志毅, 王进卿, 王广鑫, 池作和, 翁煜侃 2022 化工进展 41 1265
Google Scholar
Zhou Z Y, Wang J Q, Wang G X, Chi Z H, Weng Y K 2022 Chem. Ind. Eng. Prog. 41 1265
Google Scholar
[30] Blunt M J 2022 Phys. Rev. E 106 045103
Google Scholar
[31] McClure J E, Berrill M A, Gray W G, Miller C T 2016 Phys. Rev. E 94 033102
Google Scholar


 DownLoad:


Catalog
Metrics
- Abstract views: 7767
- PDF Downloads: 115
- Cited By: 0
