-
Precision measurement is an important direction of today’s frontier scientific research. Using lasers to achieve high-precision target measurement has become an important way to improve measurement accuracy, which can be used in various fields. However, for a certain application, the measurement accuracy will directly depend on the noise level of the laser source. Most of applications require that the measurement frequency band is concentrated in the audio frequency band. In order to obtain a low-noise laser source with shot noise limited in the applied frequency band, active and/or passive noise reduction is usually an option, i.e. active feedback control or filter cavity technique, etc. Therefore, noise analysis and suppression techniques are the main concern of the precision measurement. The optical filter cavity acts as an optical low-pass filter, which can effectively suppress high-frequency noise beyond its linewidth. In this work, we find that the intensity noise of the output field of an optical filter cavity is higher than the noise floor of the laser. The main sources of noise are analyzed experimentally, showing that 1) excess noise is introduced by cavity length locking, and 2) laser phase and pointing noises are coupled to the intensity one by the cavity. To cancel the excess noise as much as possible, we optimize the feedback control loop by measuring the open-loop and closed-loop transfer functions of the mode cleaner (MC), combined with the critical proportionality method. All the control loops are homemade, and the proportional-integral-derivative (PID) is designed with a field programmable gate array board for expediently achieving a noise reduction up to 30 dB at the audio frequency. Then the control loop is optimized to the best condition without introducing the excess noise. Compared with the free-running laser, MC filters out the high-frequency noise, meanwhile converts the phase noise and pointing noise of input field into the intensity noise of the output field. Therefore, the power noise spectrum in the audio band is still higher than that of the input optical field itself. In the future, an active control loop will be used to suppress the noise power. The experimental results provide the basic means for application research such as feedback control loop noise analysis, which will promote the development of precision measurement toward higher measurement accuracy.
-
Keywords:
- optical filter cavity /
- audio frequency /
- intensity noise /
- feedback control loop /
- transfer function
[1] Abbott B P, et al. (LIGO Scientific Collaboration and Virgo Collaboration) 2016 Phys. Rev. Lett. 116 061102
[2] Abbott B P, et al. (LIGO Scientific Collaboration and Virgo Collaboration) 2016 Phys. Rev. Lett. 116 241103
[3] Lough J, Schreiber E, Bergamin F, et al. 2021 Phys. Rev. Lett. 126 041102
 Google Scholar
[4] 李庆回, 李卫, 孙瑜, 王雅君, 田龙, 陈立荣, 张鹏飞, 郑耀辉 2022 71 164203
 Google Scholar
Li Q H, Li W, Sun Y, Wang Y J, Tian L, Chen L R, Zhang P F, Zheng Y H 2022 Acta Phys. Sin. 71 164203
 Google Scholar
[5] Taylor M A, Janousek J, Daria V, Knittel J, Hage B, Bachor H A, Bowen W P 2013 Nat. Photonics. 7 229
 Google Scholar
[6] Casacio C A, Madsen L S, Terrasson A, Waleed M, Barnscheidt K, Hage B, Taylor M A, Bowen W P 2021 Nature 594 201
 Google Scholar
[7] Brito R, Ghosh S, Barausse E, Berti E, Cardoso E, Dvorkin I, Klein A, Pain P 2017 Phys. Rev. D 96 064050
 Google Scholar
[8] Armano M, Audley H, Baird J, et al. 2018 Phys. Rev. Lett. 120 061101
 Google Scholar
[9] Kaufer S, Kasprzack M, Frolov V, Willke B 2017 Classical and Quantum Gravity. 34 145001
 Google Scholar
[10] Junker J, Oppermann P 2017 Opt. Lett. 42 755
 Google Scholar
[11] Kaufer S, Willke B 2019 Opt. Lett. 44 1916
 Google Scholar
[12] 王俊萍, 张文慧, 李瑞鑫, 田龙, 王雅君, 郑耀辉 2020 69 234204
 Google Scholar
Wang J P, Zhang W H, Li R X, Tian L, Wang Y J, Zheng Y H 2020 Acta Phys. Sin. 69 234204
 Google Scholar
[13] 王雅君, 王俊萍, 张文慧, 李瑞鑫, 田龙, 郑耀辉 2021 70 204202
 Google Scholar
Wang Y J, Wang J P, Zhang W H, Li R X, Tian L, Zheng Y H 2021 Acta Phys. Sin. 70 204202
 Google Scholar
[14] 马亚云, 冯晋霞, 万振菊, 高英豪, 张宽收 2017 66 244205
 Google Scholar
Ma Y Y, Feng J X, Wan Z J, Gao Y H, Zhang K S 2017 Acta Phys. Sin. 66 244205
 Google Scholar
[15] 聂丹丹, 冯晋霞, 戚蒙, 李渊骥, 张宽收 2020 69 094205
 Google Scholar
Nie D D, Feng J X, Qi M, Li Y J, Zhang K S 2020 Acta Phys. Sin. 69 094205
 Google Scholar
[16] Black E D 2001 American J. Phys. 69 79
 Google Scholar
[17] Ziegler J G, Nichols N B 1942 Trans. ASME. 64 759
[18] Richard C Dorf, Bishop R H 2008 Modern Control Systems (New York: PEARSON) p257
[19] Li Z X, Ma W G, Yang W H, et al. 2016 Opt. Lett. 41 3331
 Google Scholar
[20] Li Z X, Tian Y H, Wang Y J, Ma W G, Zheng Y H 2019 Opt. Express. 27 7064
 Google Scholar
[21] Wang Y J, Zhang W H, Li R X, Tian L, Zheng Y H 2021 Appl. Phys. Lett. 118 134001
 Google Scholar
[22] Zhang W H, Jiao N J, Li R X, Tian L, Wang Y J, Zheng Y H 2021 Opt. Express. 29 24315
 Google Scholar
[23] Chen C Y, Li Z X, Jin X L, Zheng Y H 2016 Rev. Sci. Instru. 87 103114
 Google Scholar
[24] Chen C Y, Shi S P, Zheng Y H 2017 Rev. Sci. Instru. 88 103101
 Google Scholar
[25] Jiao N J, Li R X, Wang Y J, Zhang W H, Zhang C Q, Tian L, Zheng Y H 2022 Optics & Laser Technol. 154 108303
[26] Seifert F 2010 Ph. D. Dissertation (Hanover: Wilhelm Leibniz University)
-
图 1 反馈控制系统框图(
$ G\left(\omega \right) $ 是被控对象的传递函数,$ H\left(\omega \right) $ 是控制器的传递函数,$ X\left(\omega \right) $ 是输入信号,$ Y\left(\omega \right) $ 是系统的输出信号,$ E\left(\omega \right) $ 是驱动信号)Figure 1. Block diagram of feedback control system. G (ω) is the transfer function of the controlled object, H (ω) is the transfer function of the controller, X (ω) is the input signal, Y (ω) is the output signal of the system, and E (ω) is the driving signal.
图 2 光学滤波腔输出场音频段噪声特性分析实验装置图 (OI, 光学隔离器; EOM, 电光相位调制器; BS, 分束镜; PBS, 偏振分束器; MC, 模式清洁器; PD1—3, 光电探测器; HV, 高压放大器; SA, 频谱分析仪; ADC, 模拟数字转换; DAC, 数字模拟转换; FPGA, 现场可编程门阵列)
Figure 2. Experimental setup for analyzing the noise characteristics of the output field of the optical filter cavity (OI, optical isolator; EOM, electro-optic phase modulator; BS, beam splitter; PBS, polarizing beam splitter; MC, mode cleaner; PD1–3, photodetector; HV, high voltage amplifier; SA, spectrum analyzer; ADC, analog to digital conversion; DAC, digital to analog conversion; FPGA, field programmable gate array).
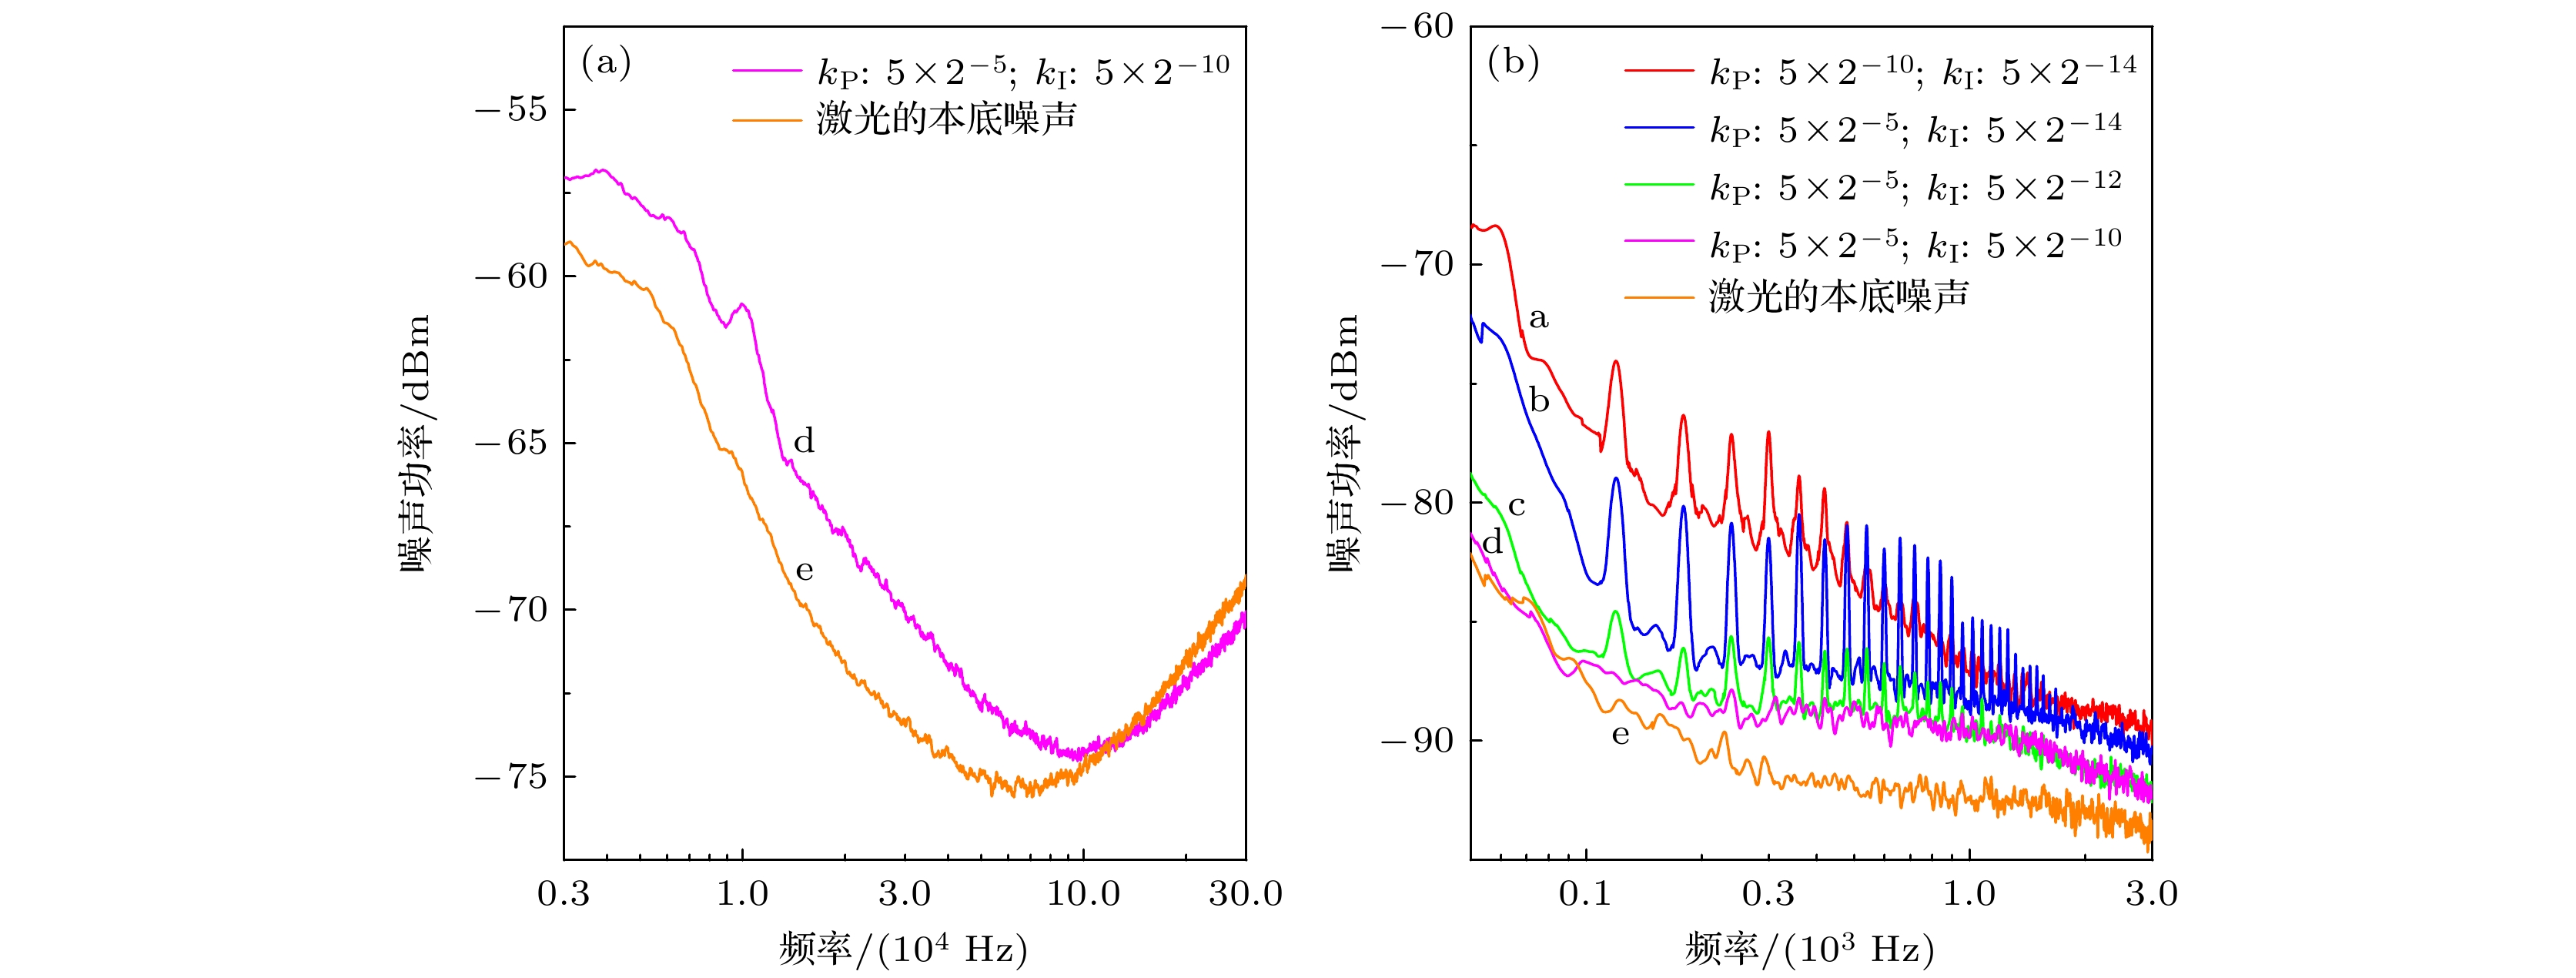
图 3 激光的本底强度噪声(橙色曲线)和MC腔长锁定后输出光场的强度噪声(其他颜色曲线) (a) 频率3—300 kHz范围内的功率噪声谱(分辨率带宽为10 kHz; 视频带宽为50 Hz); (b) 频率小于3 kHz范围内的功率噪声谱(分辨率带宽为10 Hz; 视频带宽为1 Hz )
Figure 3. Background intensity noise of the laser (orange curve) and the intensity noise of the output light field after the MC cavity length is locked (other color curves): (a) Power noise spectrum in the frequency range of 3–300 kHz (Resolution bandwidth (RBW) is 10 kHz, video bandwidth (VBW) is 50 Hz); (b) power noise spectrum in the frequency range less than 3 kHz (RBW is 10 Hz, VBW is 1 Hz).
表 1 实验参数
Table 1. Parameters of the experiment.
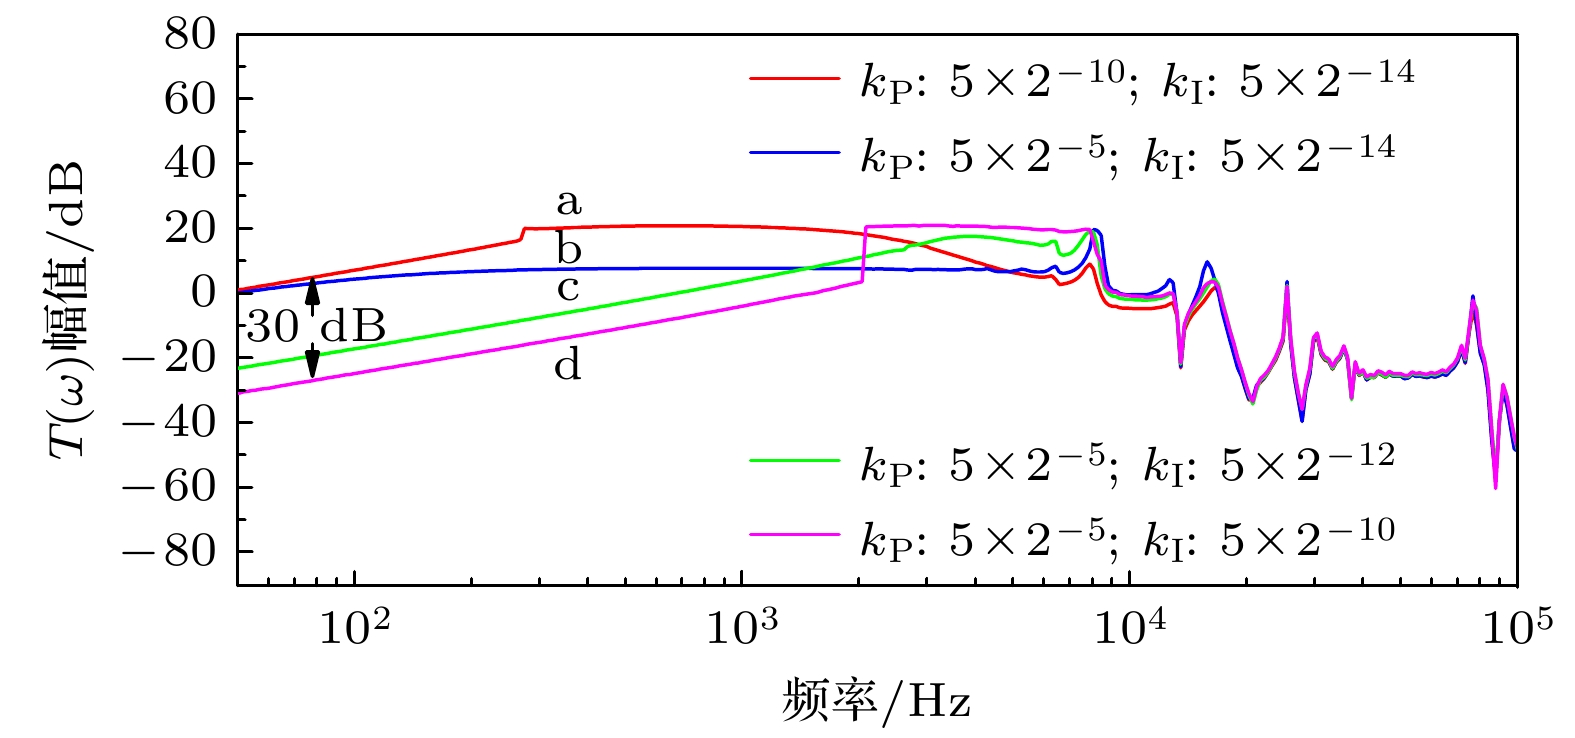
编号 a b c d kP 5×2–10 5×2–5 5×2–5 5×2–5 kI 5×2–14 5×2–14 5×2–12 5×2–10 带宽/kHz 0.29 0.75 1.30 2.00 相位裕度/(°) 225 270 200 190 开环传递函数起始幅值/dB 19 19 40 46 闭环传递函数起始幅值/dB 1.5 0.3 –23 –30 -
[1] Abbott B P, et al. (LIGO Scientific Collaboration and Virgo Collaboration) 2016 Phys. Rev. Lett. 116 061102
[2] Abbott B P, et al. (LIGO Scientific Collaboration and Virgo Collaboration) 2016 Phys. Rev. Lett. 116 241103
[3] Lough J, Schreiber E, Bergamin F, et al. 2021 Phys. Rev. Lett. 126 041102
 Google Scholar
[4] 李庆回, 李卫, 孙瑜, 王雅君, 田龙, 陈立荣, 张鹏飞, 郑耀辉 2022 71 164203
 Google Scholar
Li Q H, Li W, Sun Y, Wang Y J, Tian L, Chen L R, Zhang P F, Zheng Y H 2022 Acta Phys. Sin. 71 164203
 Google Scholar
[5] Taylor M A, Janousek J, Daria V, Knittel J, Hage B, Bachor H A, Bowen W P 2013 Nat. Photonics. 7 229
 Google Scholar
[6] Casacio C A, Madsen L S, Terrasson A, Waleed M, Barnscheidt K, Hage B, Taylor M A, Bowen W P 2021 Nature 594 201
 Google Scholar
[7] Brito R, Ghosh S, Barausse E, Berti E, Cardoso E, Dvorkin I, Klein A, Pain P 2017 Phys. Rev. D 96 064050
 Google Scholar
[8] Armano M, Audley H, Baird J, et al. 2018 Phys. Rev. Lett. 120 061101
 Google Scholar
[9] Kaufer S, Kasprzack M, Frolov V, Willke B 2017 Classical and Quantum Gravity. 34 145001
 Google Scholar
[10] Junker J, Oppermann P 2017 Opt. Lett. 42 755
 Google Scholar
[11] Kaufer S, Willke B 2019 Opt. Lett. 44 1916
 Google Scholar
[12] 王俊萍, 张文慧, 李瑞鑫, 田龙, 王雅君, 郑耀辉 2020 69 234204
 Google Scholar
Wang J P, Zhang W H, Li R X, Tian L, Wang Y J, Zheng Y H 2020 Acta Phys. Sin. 69 234204
 Google Scholar
[13] 王雅君, 王俊萍, 张文慧, 李瑞鑫, 田龙, 郑耀辉 2021 70 204202
 Google Scholar
Wang Y J, Wang J P, Zhang W H, Li R X, Tian L, Zheng Y H 2021 Acta Phys. Sin. 70 204202
 Google Scholar
[14] 马亚云, 冯晋霞, 万振菊, 高英豪, 张宽收 2017 66 244205
 Google Scholar
Ma Y Y, Feng J X, Wan Z J, Gao Y H, Zhang K S 2017 Acta Phys. Sin. 66 244205
 Google Scholar
[15] 聂丹丹, 冯晋霞, 戚蒙, 李渊骥, 张宽收 2020 69 094205
 Google Scholar
Nie D D, Feng J X, Qi M, Li Y J, Zhang K S 2020 Acta Phys. Sin. 69 094205
 Google Scholar
[16] Black E D 2001 American J. Phys. 69 79
 Google Scholar
[17] Ziegler J G, Nichols N B 1942 Trans. ASME. 64 759
[18] Richard C Dorf, Bishop R H 2008 Modern Control Systems (New York: PEARSON) p257
[19] Li Z X, Ma W G, Yang W H, et al. 2016 Opt. Lett. 41 3331
 Google Scholar
[20] Li Z X, Tian Y H, Wang Y J, Ma W G, Zheng Y H 2019 Opt. Express. 27 7064
 Google Scholar
[21] Wang Y J, Zhang W H, Li R X, Tian L, Zheng Y H 2021 Appl. Phys. Lett. 118 134001
 Google Scholar
[22] Zhang W H, Jiao N J, Li R X, Tian L, Wang Y J, Zheng Y H 2021 Opt. Express. 29 24315
 Google Scholar
[23] Chen C Y, Li Z X, Jin X L, Zheng Y H 2016 Rev. Sci. Instru. 87 103114
 Google Scholar
[24] Chen C Y, Shi S P, Zheng Y H 2017 Rev. Sci. Instru. 88 103101
 Google Scholar
[25] Jiao N J, Li R X, Wang Y J, Zhang W H, Zhang C Q, Tian L, Zheng Y H 2022 Optics & Laser Technol. 154 108303
[26] Seifert F 2010 Ph. D. Dissertation (Hanover: Wilhelm Leibniz University)
Catalog
Metrics
- Abstract views: 5137
- PDF Downloads: 100
- Cited By: 0


 DownLoad:


