-
For the physical phenomenon of high-speed car following in the road traffic flow, all the vehicles with small spacing do not run at low speed. The speeds of the vehicles are significantly higher than those they normally should be when they are in this vehicles’s density. There are more than 7% of high-speed following vehicles in the measured data. At present, the traditional traffic flow model cannot simulate the phenomenon of high-speed car following, so a new nonlinear dynamic mathematical model is needed to describe and analyze the physical phenomenon. In order to study the physical phenomenon of high-speed car following in road traffic, a traffic flow dynamics model for simulating the phenomena is proposed, which combines with the prospect theory and takes into account some factors such as driver’s decision-making behavior and randomization. It is called HCCA (high-speed car following celluar automat) model. In the model, the prospect theory is used to analyze the driver’s lane changing behavior under the uncertain conditions. Combined with the characteristics of the radical driver, the dynamic prediction speed is considered for the front car followed by the radical driver, and the HCCA dynamics rules of high-speed following traffic flow mechanics are defined. By the computer numerical simulation, the evolution mechanism and the characteristics of high-speed car-following flow are studied. The results show that compared with the symmetric two-lane cellular automata (STCA) dynamic model, the HCCA dynamic model established in this paper can simulate abundant traffic physical phenomena, and reproduce complex traffic phenomena such as free flow, synchronous flow and wide-range motion congestion. Finally, the phenomenon of high-speed car following is simulated and the results of high-speed car following rate over 7% with small spacing are in good agreement with the measured results. It overcomes the shortage that traditional STCA model cannot simulate the synchronous flow. It is found that the larger the proportion of radical drivers, the larger the high-speed car following rate and traffic flow with small spacing are under the same road density. The high-speed car following traffic flow mechanics model proposed in this paper has a certain reference significance and practical value for analyzing the physical phenomenon of high-speed car following and enriching the traffic flow theory.
-
Keywords:
- traffic flow /
- high speed car-following /
- dynamic model /
- cellular automata
[1] Wolfram S 1983 Rev. Mod. Phys. 55 601
 Google Scholar
[2] 陈永, 贺红, 张薇, 周宁 2018 力学学报 50 1219
 Google Scholar
Chen Y, He H, Zhang W, Zhou N 2018 Chin. J. Theor. Appl. Mech. 50 1219
 Google Scholar
[3] 方辉, 薛桦, 汤倩玉, 张庆宇, 潘诗琰, 朱鸣芳 2019 68 048102
 Google Scholar
Fang H, Xue H, Tang Q Y, Zhang Q Y, Pan S Y, Zhu M F 2019 Acta Phys. Sin. 68 048102
 Google Scholar
[4] Souvik R 2019 Physica A 515 600
 Google Scholar
[5] 金辉, 郭仁拥 2019 68 020501
 Google Scholar
Jin H, Guo R Y 2019 Acta Phys. Sin. 68 020501
 Google Scholar
[6] Li Y, Chen M, Dou Z, Zheng X P, Cheng Y 2019 Physica A 526 120752
 Google Scholar
[7] 候磊, 刘建国, 潘雪, 郭强, 汪秉宏 2014 63 178902
 Google Scholar
Hou L, Liu J G, Pan X, Guo Q, Wang B H 2014 Acta Phys. Sin. 63 178902
 Google Scholar
[8] Mu R, Toshiyuki Y 2019 Transp. Res. A 124 217
[9] Xue S Q, Jia B, Jiang R, Li X G, Shan J J 2017 Physica A 487 164
 Google Scholar
[10] Pang M B, Ren B N 2017 Chin. Phys. B 26 108901
 Google Scholar
[11] Sun Y Q, Ge H X, Cheng R J 2019 Physica A 527 121426
 Google Scholar
[12] 张稷, 李艳芳, 董力耕 2018 67 240503
 Google Scholar
Zhang J, Wei Y F, Dong L G 2018 Acta Phys. Sin. 67 240503
 Google Scholar
[13] Echab H, Ez-Zahraouy H 2017 Int. J. Mod. Phys. C 28 1750134
 Google Scholar
[14] Nagel K, Schreckenberg M 1992 J. Phys. I France 2 2221
[15] Chowdhury D, Wolf D E, Schreckenberg M 1997 Physica A 235 417
 Google Scholar
[16] 彭莉娟, 康瑞 2009 58 830
 Google Scholar
Peng L J, Kang R 2009 Acta Phys. Sin. 58 830
 Google Scholar
[17] 董长印, 王昊, 王炜, 李烨, 华雪东 2018 67 144501
 Google Scholar
Dong C Y, Wang H, Wang W, Li Y, Hua X D 2018 Acta Phys. Sin. 67 144501
 Google Scholar
[18] Deng J H, Feng H H 2019 Physica A 529 121545
 Google Scholar
[19] 郑亮, 马寿峰, 贾宁 2010 59 4490
 Google Scholar
Zheng L, Ma S F, Jia N 2010 Acta Phys. Sin. 59 4490
 Google Scholar
[20] 张柠溪, 祝会兵, 林亨, 黄梦圆 2015 64 024501
 Google Scholar
Zheng N X, Zhu H B, Lin H, Huang M Y 2015 Acta Phys. Sin. 64 024501
 Google Scholar
[21] Krzysztof M 2018 J. Comput. Sci. 28 32
 Google Scholar
[22] Damian N, Dailisan, May T 2019 Physica A 521 715
 Google Scholar
[23] Zhao H T, Liu X R, Chen X X, Lu J C 2018 Physica A 494 40
 Google Scholar
[24] 吴胜春, 郑贤清, 郭明昊, 吴正 2011 中国科学: 物理学 力学 天文学 41 791
 Google Scholar
Wu S C, Zheng X Q, Guo M M, Wu Z 2011 Sci. Phys. Mech. Astron. 41 791
 Google Scholar
[25] Tversky A, Kahneman D 1992 J. Risk Uncertainty 5 297
 Google Scholar
[26] Kahneman D 2003 Am. Econ. Rev. 93 1449
 Google Scholar
[27] 郑贤清 2011 博士学位论文 (上海: 复旦大学)
Zheng X Q 2011 Ph. D. Dissertation (Shanghai: Fudan University) (in Chinese)
-
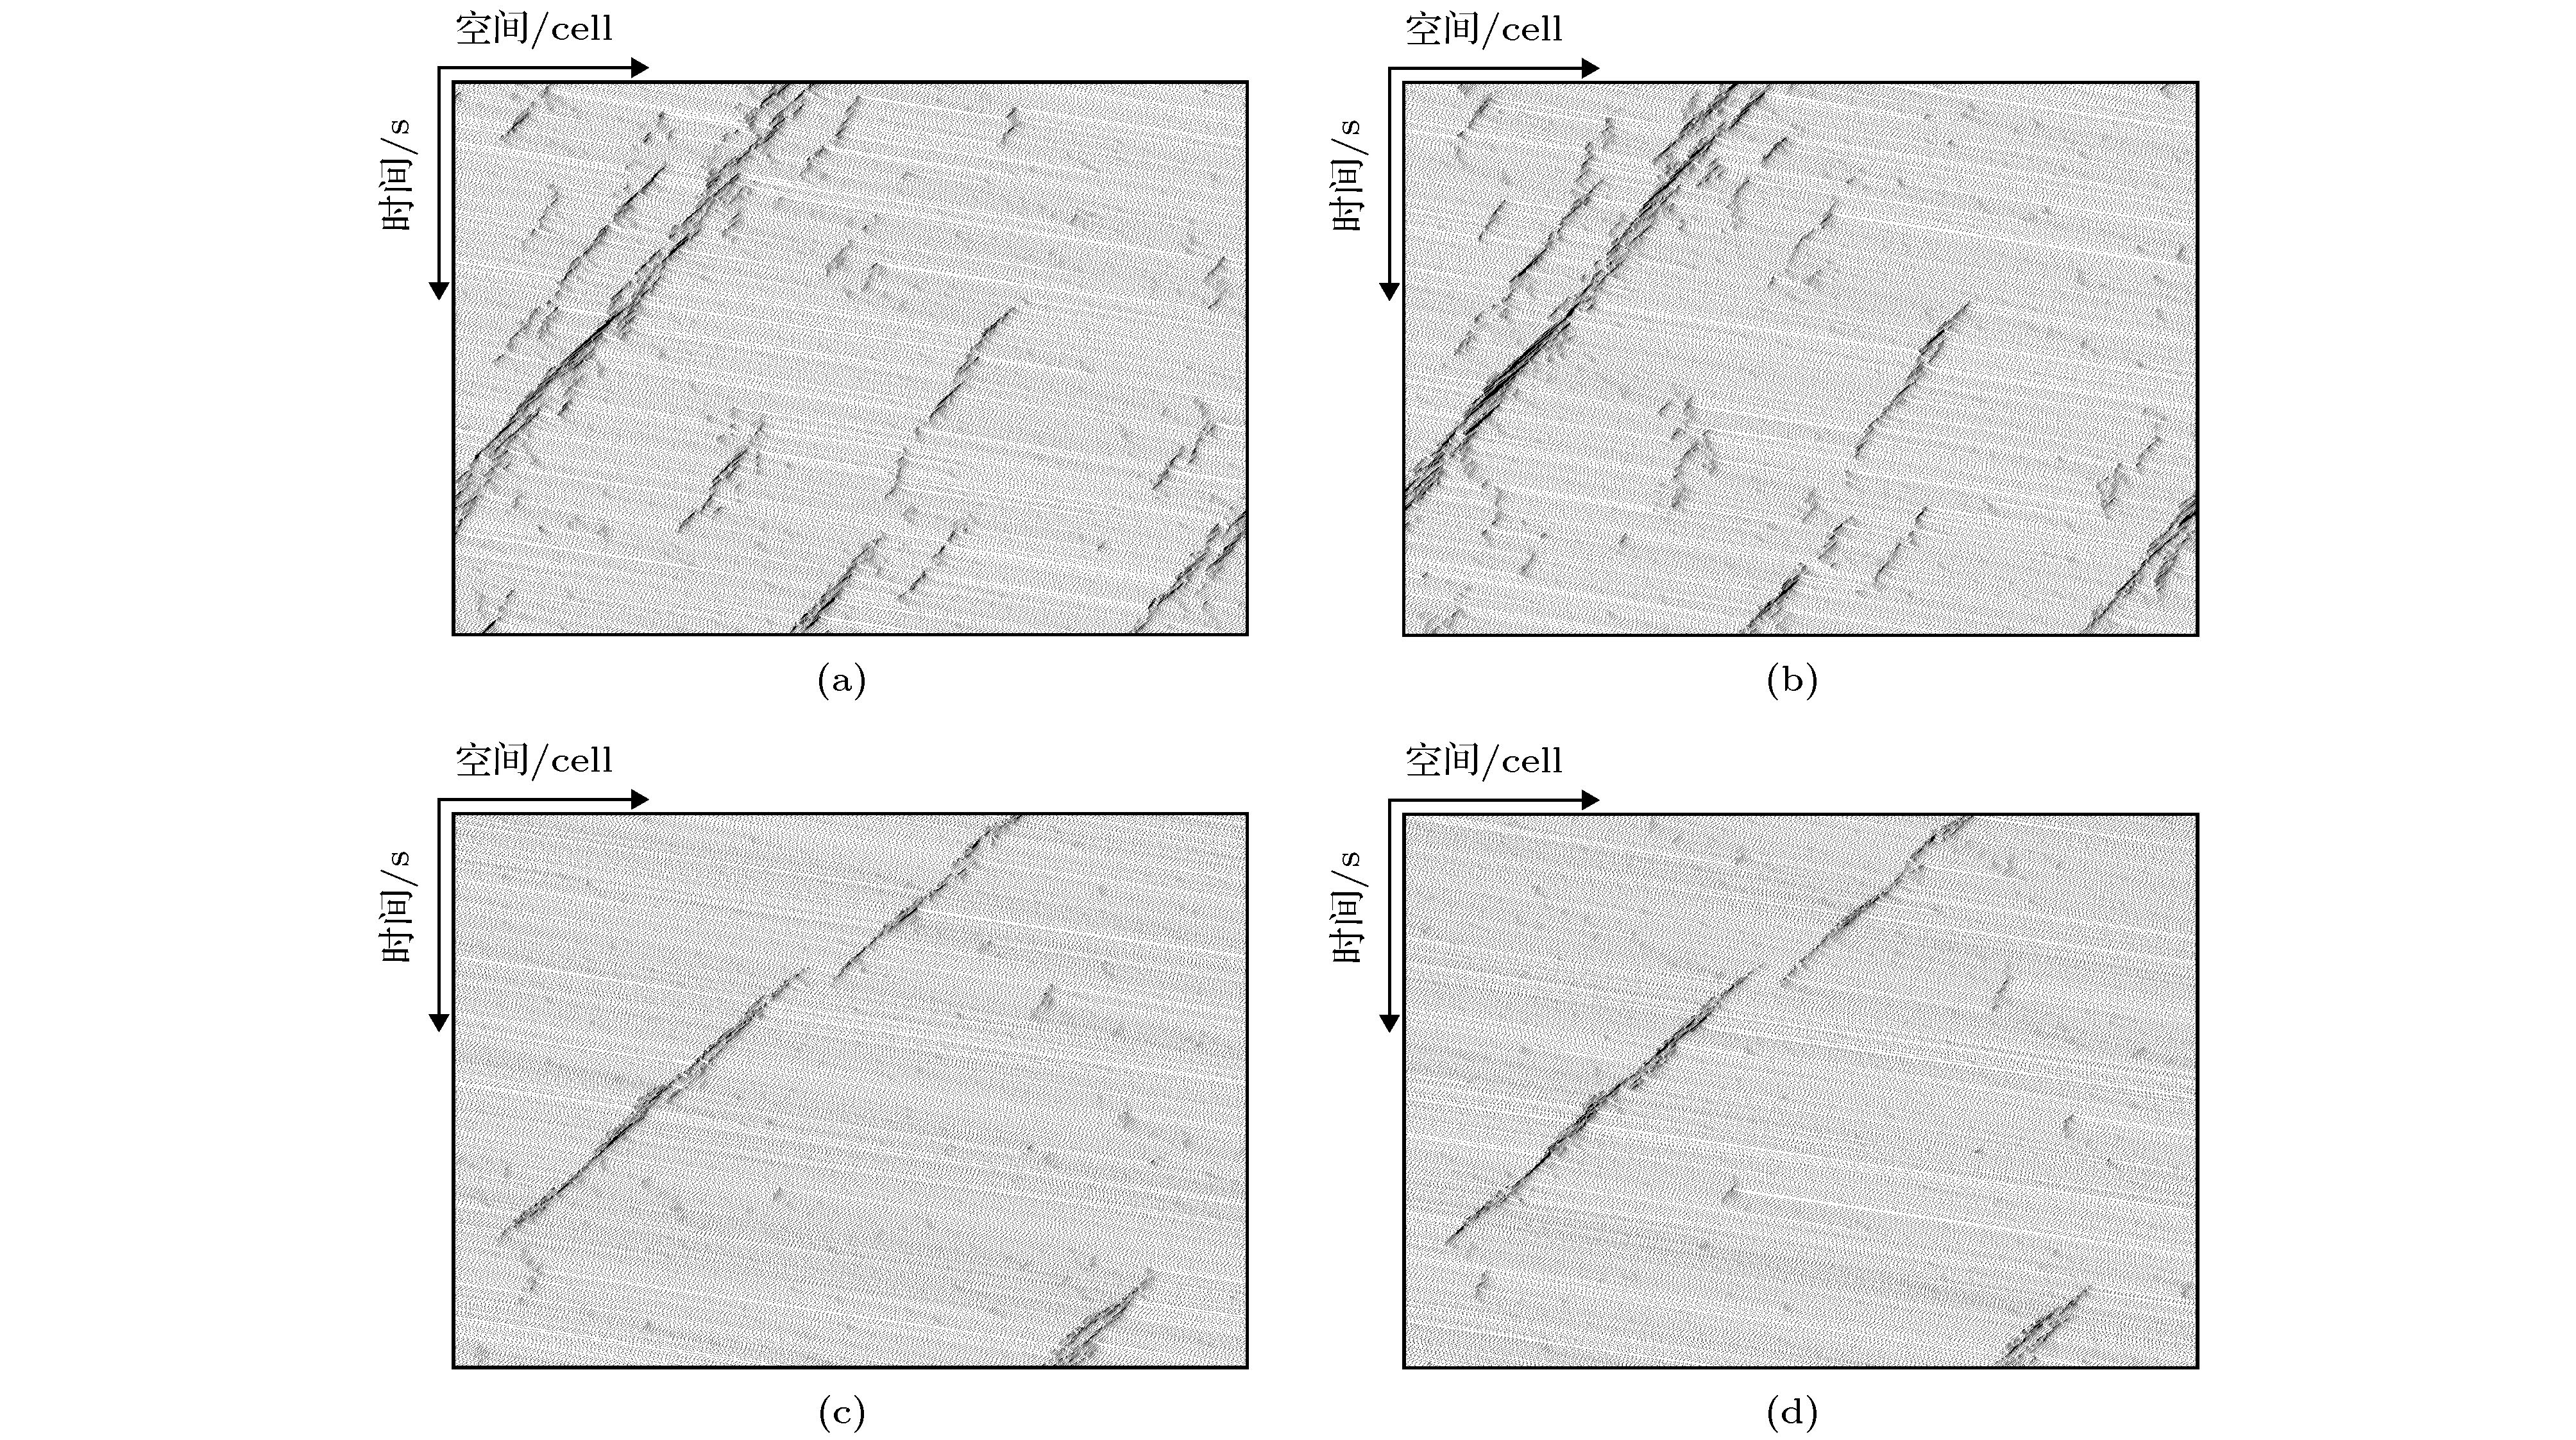
图 3 ρ1 = 0.2, ρ2 = 0.1, 不同车道时空图 (a) STCA演化左车道; (b) STCA演化右车道; (c) HCCA演化左车道; (d) HCCA演化右车道
Figure 3. Space-time diagrams of different lanes under the condition of ρ1 = 0.2 and ρ2 = 0.1: (a) Left lane evolution with STCA rules; (b) right lane evolution with STCA rules; (c) left lane evolution with HCCA rules; (d) right lane evolution with HCCA rules.
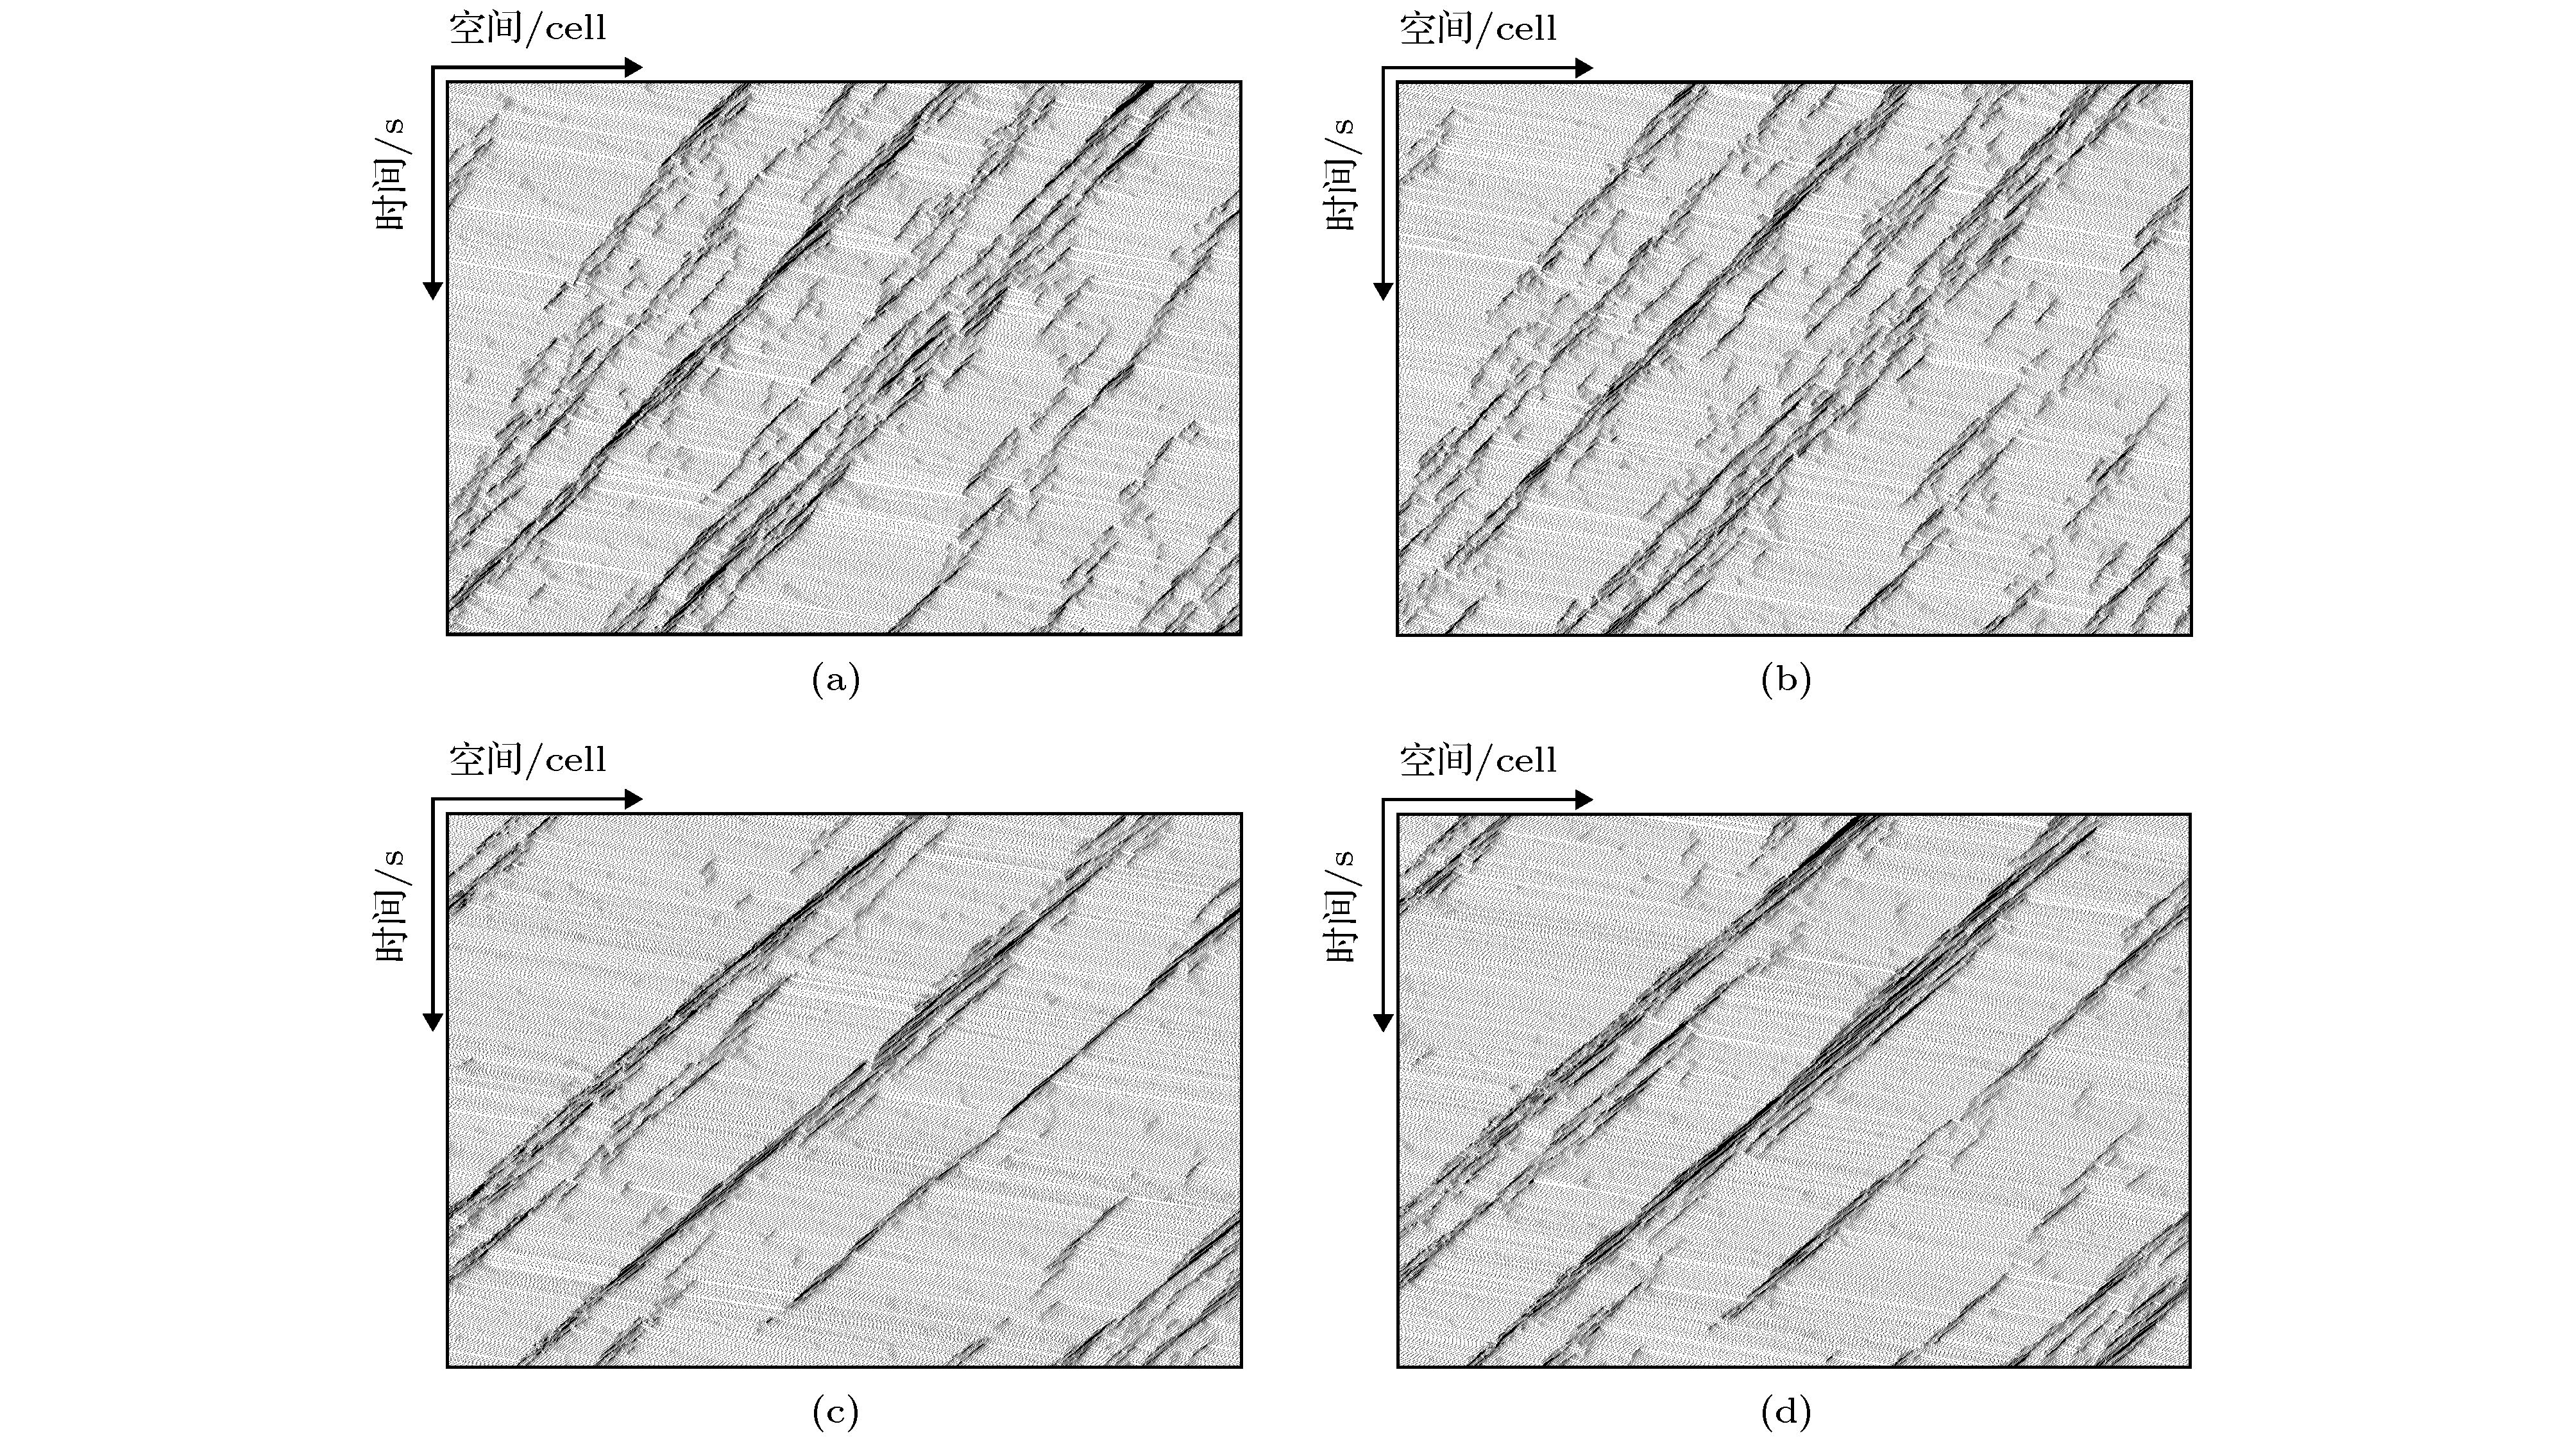
图 5 ρ1 = 0.3, ρ2 = 0.2, 不同车道时空图 (a) STCA演化左车道; (b) STCA演化右车道; (c) HCCA演化左车道; (d) HCCA演化右车道
Figure 5. Space-time diagrams of different lanes under the condition of ρ1 = 0.3 and ρ2 = 0.2: (a) Left lane evolution with STCA rules; (b) right lane evolution with STCA rules; (c) left lane evolution with HCCA rules; (d) right lane evolution with HCCA rules.
图 4 ρ1 = 0.3, ρ2 = 0.1, 不同车道时空图 (a) STCA演化左车道; (b) STCA演化右车道; (c) HCCA演化左车道; (d) HCCA演化右车道
Figure 4. Space-time diagrams of different lanes under the condition of ρ1 = 0.3 and ρ2 = 0.1: (a) Left lane evolution with STCA rules; (b) right lane evolution with STCA rules; (c) left lane evolution with HCCA rules; (d) right lane evolution with HCCA rules.
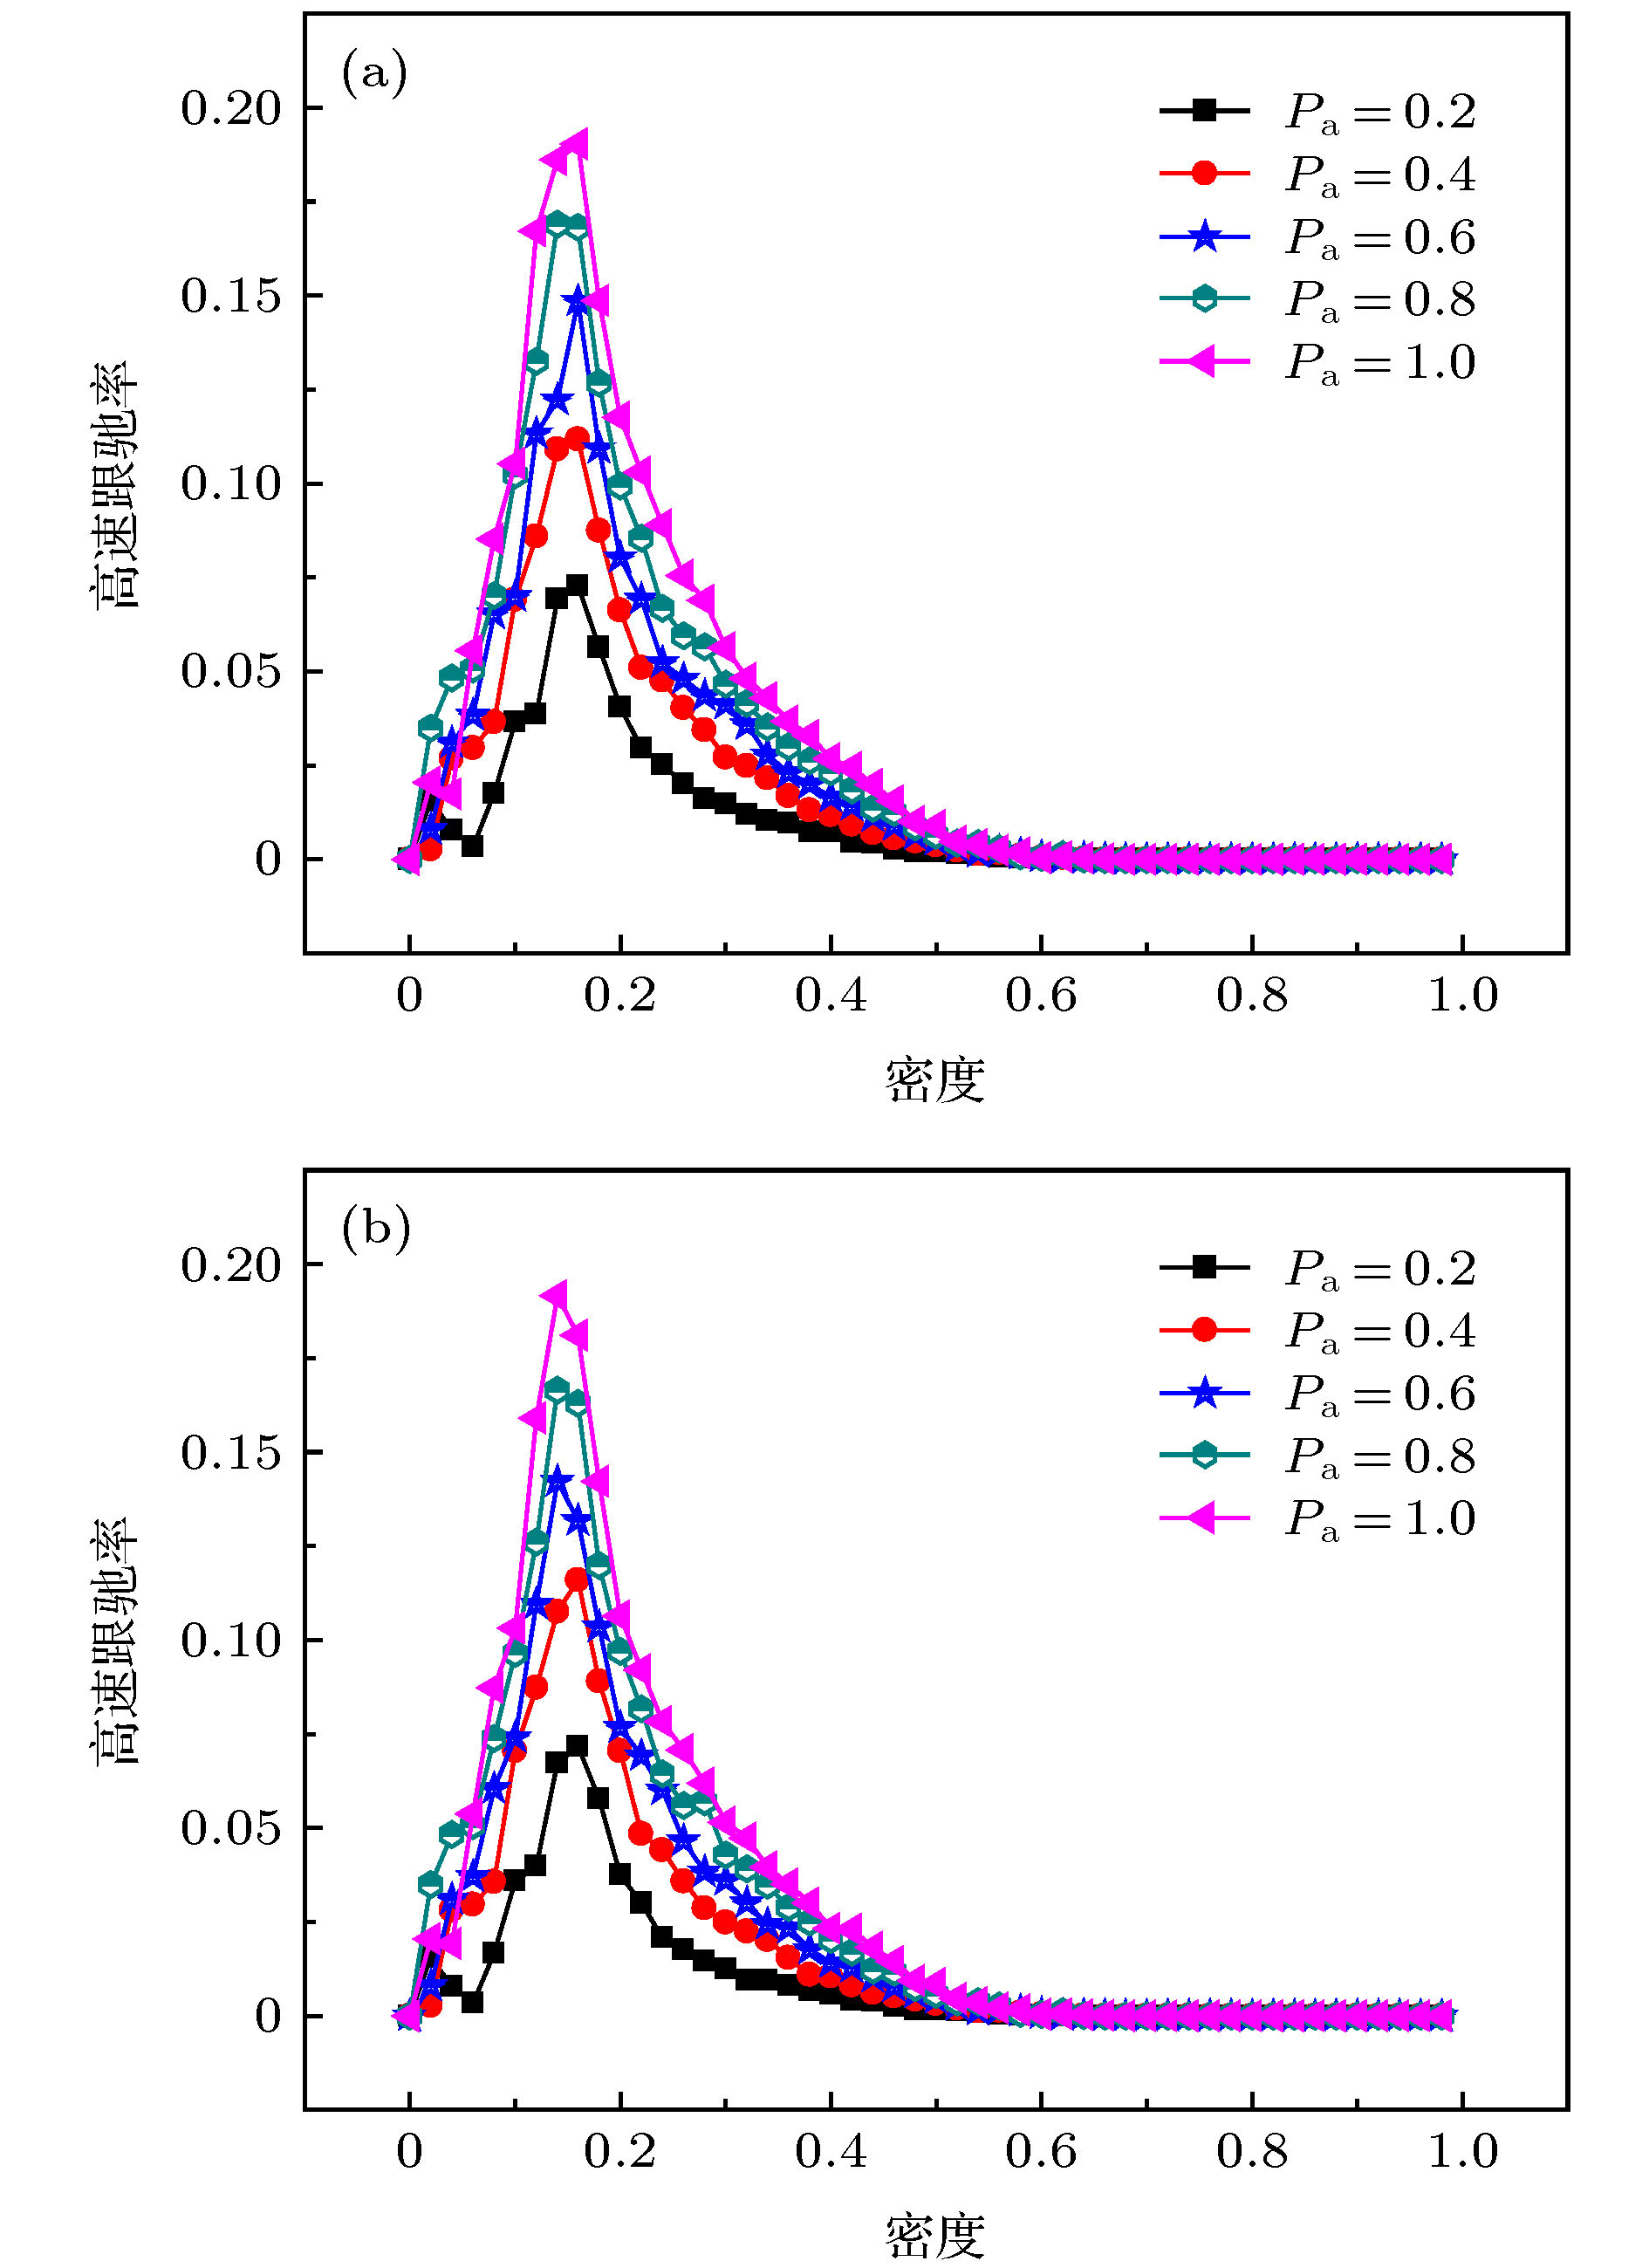
图 6 ρ1 = 0.08, ρ2 = 0.08, 速度分布图 (a) STCA演化左车道; (b) STCA演化右车道; (c) HCCA演化左车道; (d) HCCA演化右车道
Figure 6. Velocity distribution diagram of different lanes under the condition of ρ1 = 0.08 and ρ2 = 0.08: (a) Left lane evolution with STCA rules; (b) right lane evolution with STCA rules; (c) left lane evolution with HCCA rules; (d) right lane evolution with HCCA rules.
图 7 ρ1 = 0.14, ρ2 = 0.14, 速度分布图 (a) STCA演化左车道; (b) STCA演化右车道; (c) HCCA演化左车道; (d) HCCA演化右车道
Figure 7. Velocity distribution diagram of different lanes under the condition of ρ1 = 0.14 and ρ2 = 0.14: (a) Left lane evolution with STCA rules; (b) right lane evolution with STCA rules; (c) left lane evolution with HCCA rules; (d) right lane evolution with HCCA rules.
表 1 不同速度密度关系计算的误差比较
Table 1. Comparison of calculation errors of different velocity-denisty models.
速度密度计算模型 高峰时段误差 普通时段误差 雪天误差 Greenshields模型 –0.24 –0.11 –0.28 Greenberg模型 0.51 0.56 0.29 Underwood模型 0.26 0.49 0.22 本文HCCA模型 –0.02 0.03 –0.07 -
[1] Wolfram S 1983 Rev. Mod. Phys. 55 601
 Google Scholar
[2] 陈永, 贺红, 张薇, 周宁 2018 力学学报 50 1219
 Google Scholar
Chen Y, He H, Zhang W, Zhou N 2018 Chin. J. Theor. Appl. Mech. 50 1219
 Google Scholar
[3] 方辉, 薛桦, 汤倩玉, 张庆宇, 潘诗琰, 朱鸣芳 2019 68 048102
 Google Scholar
Fang H, Xue H, Tang Q Y, Zhang Q Y, Pan S Y, Zhu M F 2019 Acta Phys. Sin. 68 048102
 Google Scholar
[4] Souvik R 2019 Physica A 515 600
 Google Scholar
[5] 金辉, 郭仁拥 2019 68 020501
 Google Scholar
Jin H, Guo R Y 2019 Acta Phys. Sin. 68 020501
 Google Scholar
[6] Li Y, Chen M, Dou Z, Zheng X P, Cheng Y 2019 Physica A 526 120752
 Google Scholar
[7] 候磊, 刘建国, 潘雪, 郭强, 汪秉宏 2014 63 178902
 Google Scholar
Hou L, Liu J G, Pan X, Guo Q, Wang B H 2014 Acta Phys. Sin. 63 178902
 Google Scholar
[8] Mu R, Toshiyuki Y 2019 Transp. Res. A 124 217
[9] Xue S Q, Jia B, Jiang R, Li X G, Shan J J 2017 Physica A 487 164
 Google Scholar
[10] Pang M B, Ren B N 2017 Chin. Phys. B 26 108901
 Google Scholar
[11] Sun Y Q, Ge H X, Cheng R J 2019 Physica A 527 121426
 Google Scholar
[12] 张稷, 李艳芳, 董力耕 2018 67 240503
 Google Scholar
Zhang J, Wei Y F, Dong L G 2018 Acta Phys. Sin. 67 240503
 Google Scholar
[13] Echab H, Ez-Zahraouy H 2017 Int. J. Mod. Phys. C 28 1750134
 Google Scholar
[14] Nagel K, Schreckenberg M 1992 J. Phys. I France 2 2221
[15] Chowdhury D, Wolf D E, Schreckenberg M 1997 Physica A 235 417
 Google Scholar
[16] 彭莉娟, 康瑞 2009 58 830
 Google Scholar
Peng L J, Kang R 2009 Acta Phys. Sin. 58 830
 Google Scholar
[17] 董长印, 王昊, 王炜, 李烨, 华雪东 2018 67 144501
 Google Scholar
Dong C Y, Wang H, Wang W, Li Y, Hua X D 2018 Acta Phys. Sin. 67 144501
 Google Scholar
[18] Deng J H, Feng H H 2019 Physica A 529 121545
 Google Scholar
[19] 郑亮, 马寿峰, 贾宁 2010 59 4490
 Google Scholar
Zheng L, Ma S F, Jia N 2010 Acta Phys. Sin. 59 4490
 Google Scholar
[20] 张柠溪, 祝会兵, 林亨, 黄梦圆 2015 64 024501
 Google Scholar
Zheng N X, Zhu H B, Lin H, Huang M Y 2015 Acta Phys. Sin. 64 024501
 Google Scholar
[21] Krzysztof M 2018 J. Comput. Sci. 28 32
 Google Scholar
[22] Damian N, Dailisan, May T 2019 Physica A 521 715
 Google Scholar
[23] Zhao H T, Liu X R, Chen X X, Lu J C 2018 Physica A 494 40
 Google Scholar
[24] 吴胜春, 郑贤清, 郭明昊, 吴正 2011 中国科学: 物理学 力学 天文学 41 791
 Google Scholar
Wu S C, Zheng X Q, Guo M M, Wu Z 2011 Sci. Phys. Mech. Astron. 41 791
 Google Scholar
[25] Tversky A, Kahneman D 1992 J. Risk Uncertainty 5 297
 Google Scholar
[26] Kahneman D 2003 Am. Econ. Rev. 93 1449
 Google Scholar
[27] 郑贤清 2011 博士学位论文 (上海: 复旦大学)
Zheng X Q 2011 Ph. D. Dissertation (Shanghai: Fudan University) (in Chinese)
Catalog
Metrics
- Abstract views: 13684
- PDF Downloads: 198
- Cited By: 0


 DownLoad:


