-
本文建立了一种全新的将动力学Monte-Carlo粒子模拟与基于归一化Gauss函数基组的质量密度场空间粗粒化模型耦合的杂化模拟算法. 采用该杂化模拟算法, 系统对比研究了4种Cr原子含量分别为12.8%, 20.0%, 30.0%和40.0%的Fe-Cr合金中Cr相在温度为673 K下的时效析出动力学机制, 及其时效不同阶段微观组织形貌的演变规律. 研究得出Fe-Cr (12.8%)合金富Cr相时效组织形貌呈现孤立颗粒状空间分布形态, 时效机制属于形核-长大 (NG)机制; 对于Fe-Cr (30.0%)和Fe-Cr (40.0%), 富Cr相时效形貌在形核-生长及熟化阶段均呈现为三维蠕虫状空间分布特征, 时效机制属于条幅分解 (SD)机制; 对于Fe-Cr (20.0%)合金, 其富Cr相组织演化特征介于NG和SD机制之间. 研究进一步发现Cr原子短程序参量可用来分析富Cr相形核-生长阶段Fe-Cr合金原子尺度结构的演变, 但对于时效熟化阶段微观结构组织变化不敏感. 基于空间粗粒化后Fe-Cr合金微观组织形貌, 进一步分析了4种Cr原子含量下Fe-Cr合金相变动力学参数如富Cr相体积分数、平均粒径及相颗粒数密度随时效时间演变. 本文建立的质量密度场耦合动力学Monte-Carlo模拟方法, 为开发多尺度算法模拟合金时效动力学机制及微观组织形貌演变提供了新的思路和研究基础.
-
关键词:
- Fe-Cr合金 /
- 富Cr沉积 /
- 动力学Monte-Carlo模拟 /
- 粗粒化方法
The phase transformation kinetics and micro-structure evolutions of four different Fe-Cr binary alloys, i.e. Fe-Cr (12.8%), Fe-Cr (20.0%), Fe-Cr (30.0%) and Fe-Cr (40.0%) at 673 K, are investigated by using the kinetic Monte-Carlo simulation combined with spatial coarse-grained mass density field description. For all studied Fe-Cr alloys, it is found that the number density of Cr-rich precipitate undergoes a rather rapid increasing at the nucleation stage and then gradually decreases with the simulation time increasing in the coarsening stage during aging. Increasing the Cr concentration in Fe-Cr alloy can significantly reduce the duration of nucleation and the time interval between nucleation and coarsening. From the coarse-grained mass density field models of Cr-rich precipitates at different aging stages for the four Fe-Cr alloys, we discover that the Cr-rich phase shows the isolated spherical particle-like morphology for the aged Fe-Cr (12.8%) alloy, revealing the nucleation and growth (NG) mechanism. Meanwhile, the Cr-rich precipitates possess a characteristic three-dimensional interconnected microstructure, a signature of spinodal decomposition mechanism. Otherwise, the Cr-rich phase morphology in Fe-Cr (20.0%) exhibits the characteristics of both NG mechanism and SD mechanism. It is also found that the short-range order parameter of Cr atoms in Fe-Cr alloy is indeed very sensitive to the change of atomic structure at the early stage of aging or nucleation stage, which, however, is almost independent of the changing of morphology of Cr-precipitates in the later coarsening process. Finally, the phase transformation kinetics of Cr-rich precipitates during aging are analyzed by calculating the phase volume fraction, average diameter and number density, concluding that the Cr-rich phase growth kinetics in Fe-Cr (20.0%) alloy can be described by the well-known Lifshitz-Slyozov-Wagner law in the coarsening stage. However, the coarsening kinetics of Fe-Cr (12.8%), Fe-Cr (30.0%) and Fe-Cr (40.0%) alloys are not caused by the LSW mechanism.-
Keywords:
- Fe-Cr alloy /
- Cr-rich precipitate /
- kinetic Monte-Carlo simulation /
- coase-graining method
[1] Terentyev D A, Bonny G, Malerba L 2008 Acta Mater. 56 3229
 Google Scholar
[2] Zhou J, Odqvist J, Höglund L, Thuvander M, Barkar T, Hedström P 2014 Scr. Mater. 75 62
 Google Scholar
[3] 史佳庆, 薛飞, 彭群家, 沈耀 2020 材料研究学报 34 328
 Google Scholar
Shi J Q, Xue F, Peng Q J, Shen Y 2020 Chin. J. Mater. Res. 34 328
 Google Scholar
[4] Xu X, Westraadt J E, Odqvist J, Youngs T G A, King S M, Hedström P 2018 Acta Mater. 145 347
 Google Scholar
[5] Yan Z, Li Y, Zhou X, Zhang Y, Hu R 2017 J. Alloys Compd. 725 1035
 Google Scholar
[6] Eich S M, Beinke D, Schmitz G 2015 Comput. Mater. Sci. 104 185
 Google Scholar
[7] Martínez E, Senninger O, Fu C, Soisson F 2012 Phys. Rev. B Condens. Matter Mater. Phys. 86 224109
 Google Scholar
[8] Pareige C, Roussel M, Novy S, Kuksenko V, Olsson P, Domain C, Pareige P 2011 Acta Mater. 59 2404
 Google Scholar
[9] Guo W, Garfinkel D A, Tucker J D, Haley D, Young G A, Poplawsky J D 2016 Nanotechnology 27 254004
 Google Scholar
[10] Xu X, Odqvist J, Colliander M H, Thuvander M, Steuwer A, Westraadt J E, King S, Hedstrom P 2016 Metall. Mater. Trans. A 47 5942
 Google Scholar
[11] Bonny G, Terentyev D, Malerba L 2008 Comput. Mater. Sci. 42 107
 Google Scholar
[12] Erhart P, Caro A, Serrano De Caro M, Sadigh B 2008 Phys. Rev. B Condens. Matter Mater. Phys. 77 134206
 Google Scholar
[13] Nguyen-Manh D, Lavrentiev M Y, Dudarev S L 2008 C. R. Phys. 9 379
 Google Scholar
[14] Zhou J, Odqvist J, Ruban A, Thuvander M, Xiong W, Ågren J, Olson G B, Hedström P 2017 J. Mater. Sci. 52 326
 Google Scholar
[15] Mukherjee D, Forslund A, Höglund L, Ruban A, Larsson H, Odqvist J 2022 Comput. Mater. Sci. 202 110955
 Google Scholar
[16] Olsson P, Wallenius J, Domain C, Nordlund K, Malerba L 2005 Phys. Rev. B Condens. Matter. 72 214119
[17] Ackland G J, Mendelev M I, Srolovitz D J, Han S, Barashev A V 2004 J. Phys. Condens. Matter. 16 S2629
 Google Scholar
[18] Vineyard G H 1957 J. Phys. Chem. Solids 3 121
 Google Scholar
[19] Willard A P, Chandler D 2010 J. Phys. Chem. B 114 1954
 Google Scholar
[20] Mathon M H, de Carlan Y, Geoffroy G, Averty X, Alamo A, de Novion C H 2003 J. Nucl. Mater. 312 236
 Google Scholar
[21] Miller M K, Hyde J M, Hetherington M G, Cerezo A, Smith G D W, Elliott C M 1995 Acta Metall. Mater. 43 3385
 Google Scholar
[22] Huse D A 1986 Phys. Rev. B 34 7845
[23] Lifshitz I M, Slyozov V V 1961 J. Phys. Chem. Solids 19 35
 Google Scholar
[24] Wagner C 1961 Elektro. Chem. 65 581
[25] Lebowitz J L, Marro J, Kalos M H 1982 Acta Metall. Mater. 30 297
 Google Scholar
[26] Novy S, Pareige P, Pareige C 2009 J. Nucl. Mater. 384 96
 Google Scholar
-
图 1 673 K下kMC模拟1.28×10⁵个原子超晶胞计算得到的二元合金富Cr相平均粒径、不同粒径分布范围对应颗粒数密度, 以及总颗粒数密度随模拟总步长演变趋势曲线 (a) Fe-Cr (12.8%); (b) Fe-Cr (20.0%); (c) Fe-Cr (30.0%); (d) Fe-Cr (40.0%)
Fig. 1. Predicted average diameter and number density of precipitates of Fe-Cr alloys obtained by kMC simulations using a supercell model containing 1.28×10⁵ atoms, and the total number of density precipitates versus the kMC duration: (a) Fe-Cr (12.8%); (b) Fe-Cr (20.0%); (c) Fe-Cr (30.0%); (a) Fe-Cr (40.0%).
图 2 673 K下Fe-Cr合金kMC模拟演化总步长为2×10¹⁰步时其微观组织形貌 (a) Fe-Cr (12.8%); (b) Fe-Cr (20.0%); (c) Fe-Cr (30.0%); (d) Fe-Cr (40.0%). 图中Fe和Cr原子分别用黄色及蓝色表示
Fig. 2. Atomic structures are simulated by kMC in Fe-Cr alloys at 2×10¹⁰ steps at 673 K: (a) Fe-Cr (12.8%); (b) Fe-Cr (20.0%); (c) Fe-Cr (30.0%); (d) Fe-Cr (40.0%). Blue balls refer to Cr atoms and other yellow balls are Fe atoms.
图 3 质量密度场空间粗粒化参数Cth数值测试及其对Fe-Cr (12.8%)合金中富Cr相微观形貌分析结果的影响 (a), (b) kMC粒子模拟结果; (c), (d) Cth = 0.2Cmax; (e), (f) Cth = 0.4Cmax; (g), (h) Cth = 0.6Cmax
Fig. 3. Testing the effect of threshold Cth values for extracting the Cr-rich precipitates on the phase morphologies in Fe-Cr (12.8%) alloy using the spatial coarse-graining method: (a), (b) Atomic obtained from kMC simulation results; (c), (d) Cth = 0.2Cmax; (e), (f) Cth = 0.4Cmax; (g), (h) Cth = 0.6Cmax.
图 4 临界Cth取值不同时, Fe-Cr (12.8%)合金粗粒化计算结果与kMC模拟结果的比较 (a)富Cr相总粒子数密度和平均粒径; (b)相体积分数
Fig. 4. Comparison of Cr rich phase calculated from coarsening of Fe-Cr (12.8%) alloy with kMC simulation results at different critical Cth values: (a) Total particle density, average particle size; (b) phase volume fraction.
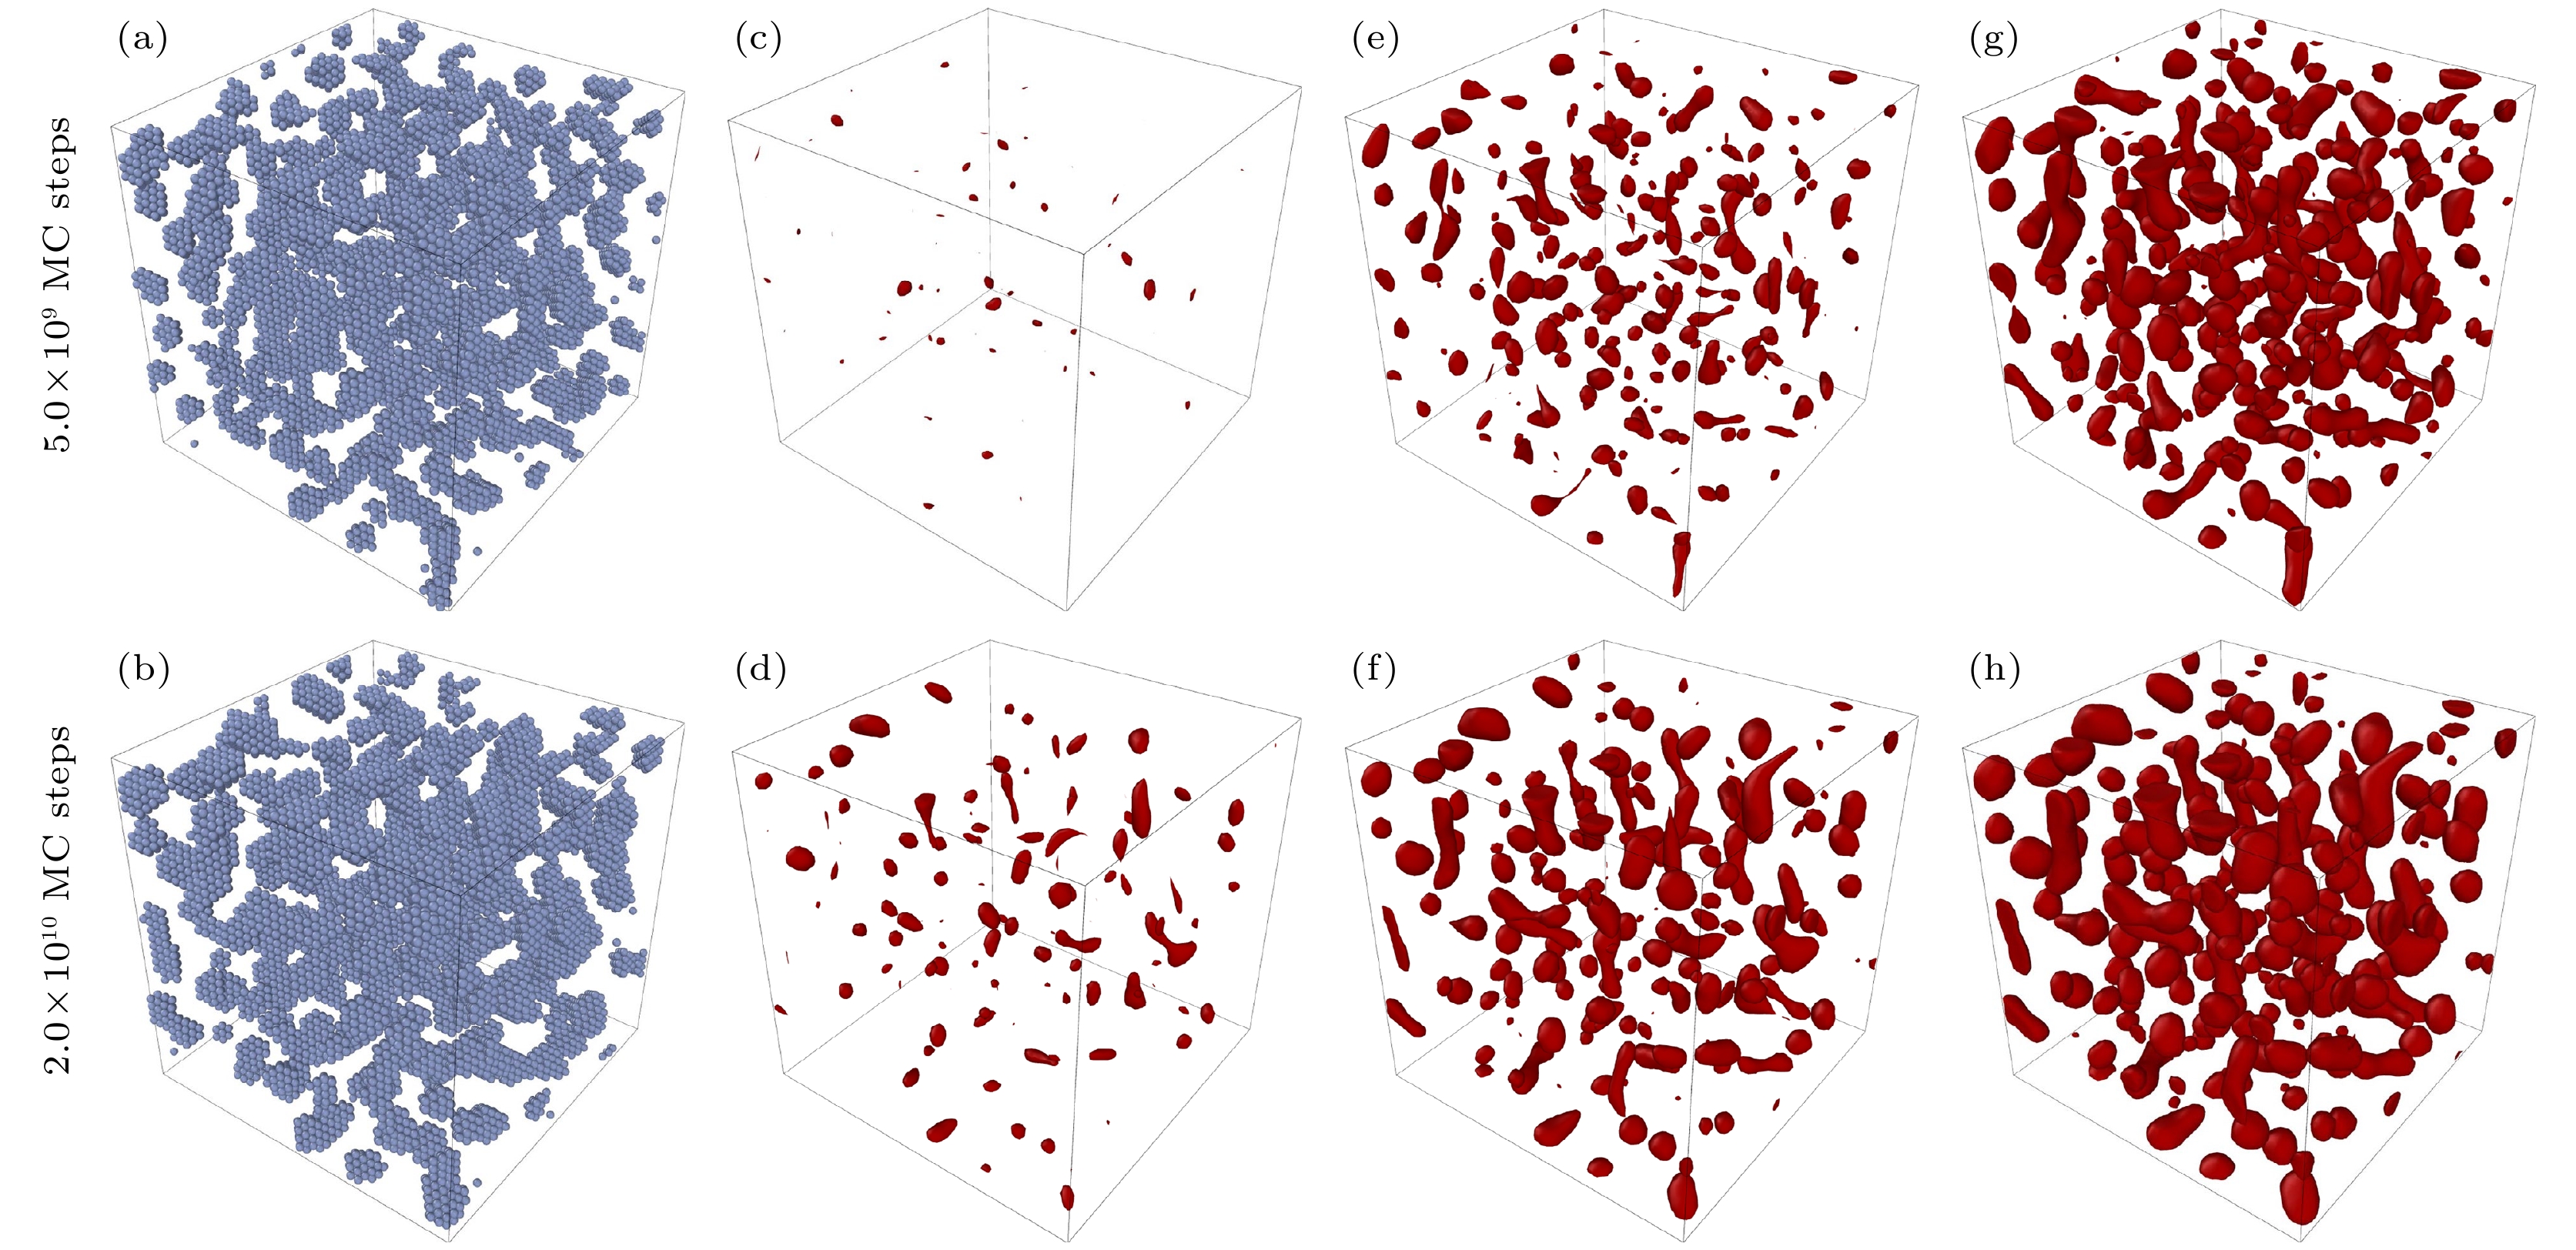
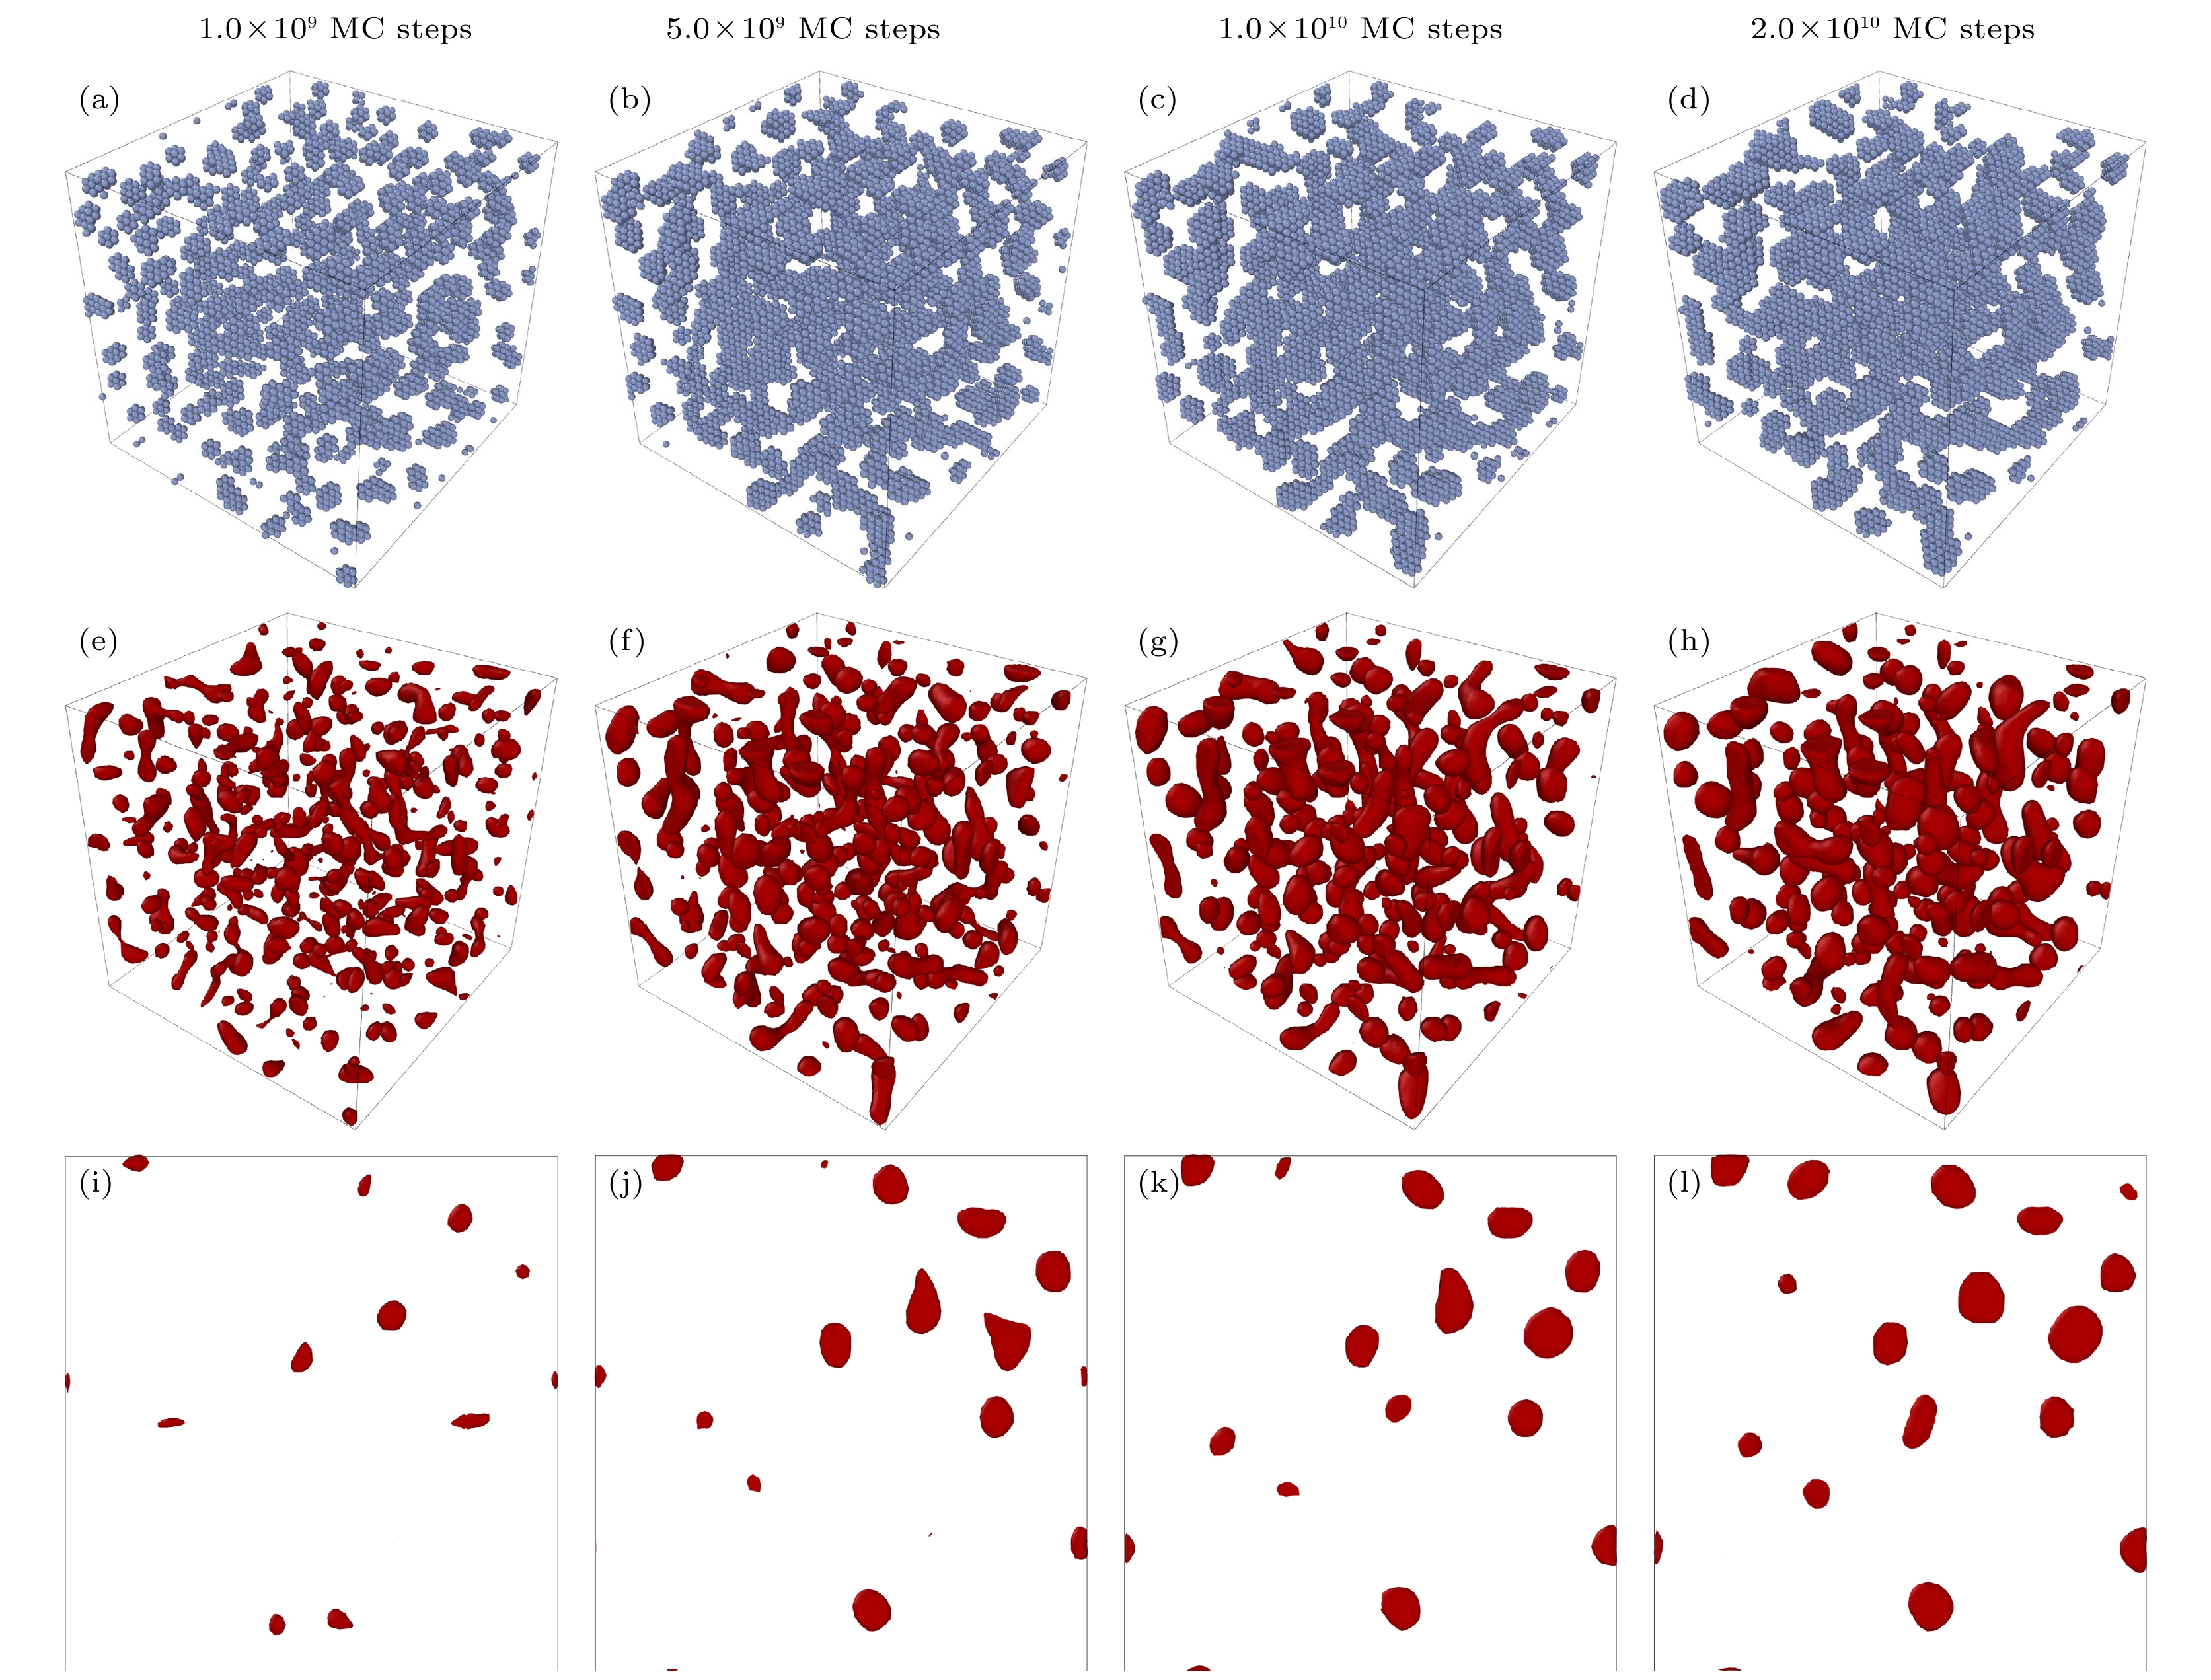
图 5 富Cr相在Fe-Cr (12.8%)合金中kMC模拟1.28×10⁵个原子晶胞 (a)—(d)不同时效阶段原子尺度晶体结构; (e)—(h)对应质量密度场空间粗粒化形貌分析三维空间分布图; (i)—(l)典型二维截面图
Fig. 5. Cr-rich phase is simulated by kMC in Fe-Cr (12.8%) alloy with 1.28×10⁵ atoms: (a)–(d) Atomic structures obtained from kMC at different kMC steps; (e)–(h) 3D phase morphologies of Cr-rich precipitates in ferrite matrix; (i)–(l) phase morphologies illustrated on 2D slices.
图 6 富Cr相在Fe-Cr (20.0%)合金中kMC模拟1.28×10⁵个原子晶胞 (a)—(d)在不同时效阶段原子尺度晶体结构; (e)—(h)对应质量密度场空间粗粒化形貌分析三维空间分布图; (i)—(l)典型二维截面图
Fig. 6. Cr-rich phase is simulated by kMC in Fe-Cr (20.0%) alloy with 1.28×10⁵ atoms: (a)–(d) Atomic structures obtained from kMC at different kMC steps; (e)–(h) 3D phase morphologies of Cr-rich precipitates in ferrite matrix; (i)–(l) phase morphologies illustrated on 2D slices.
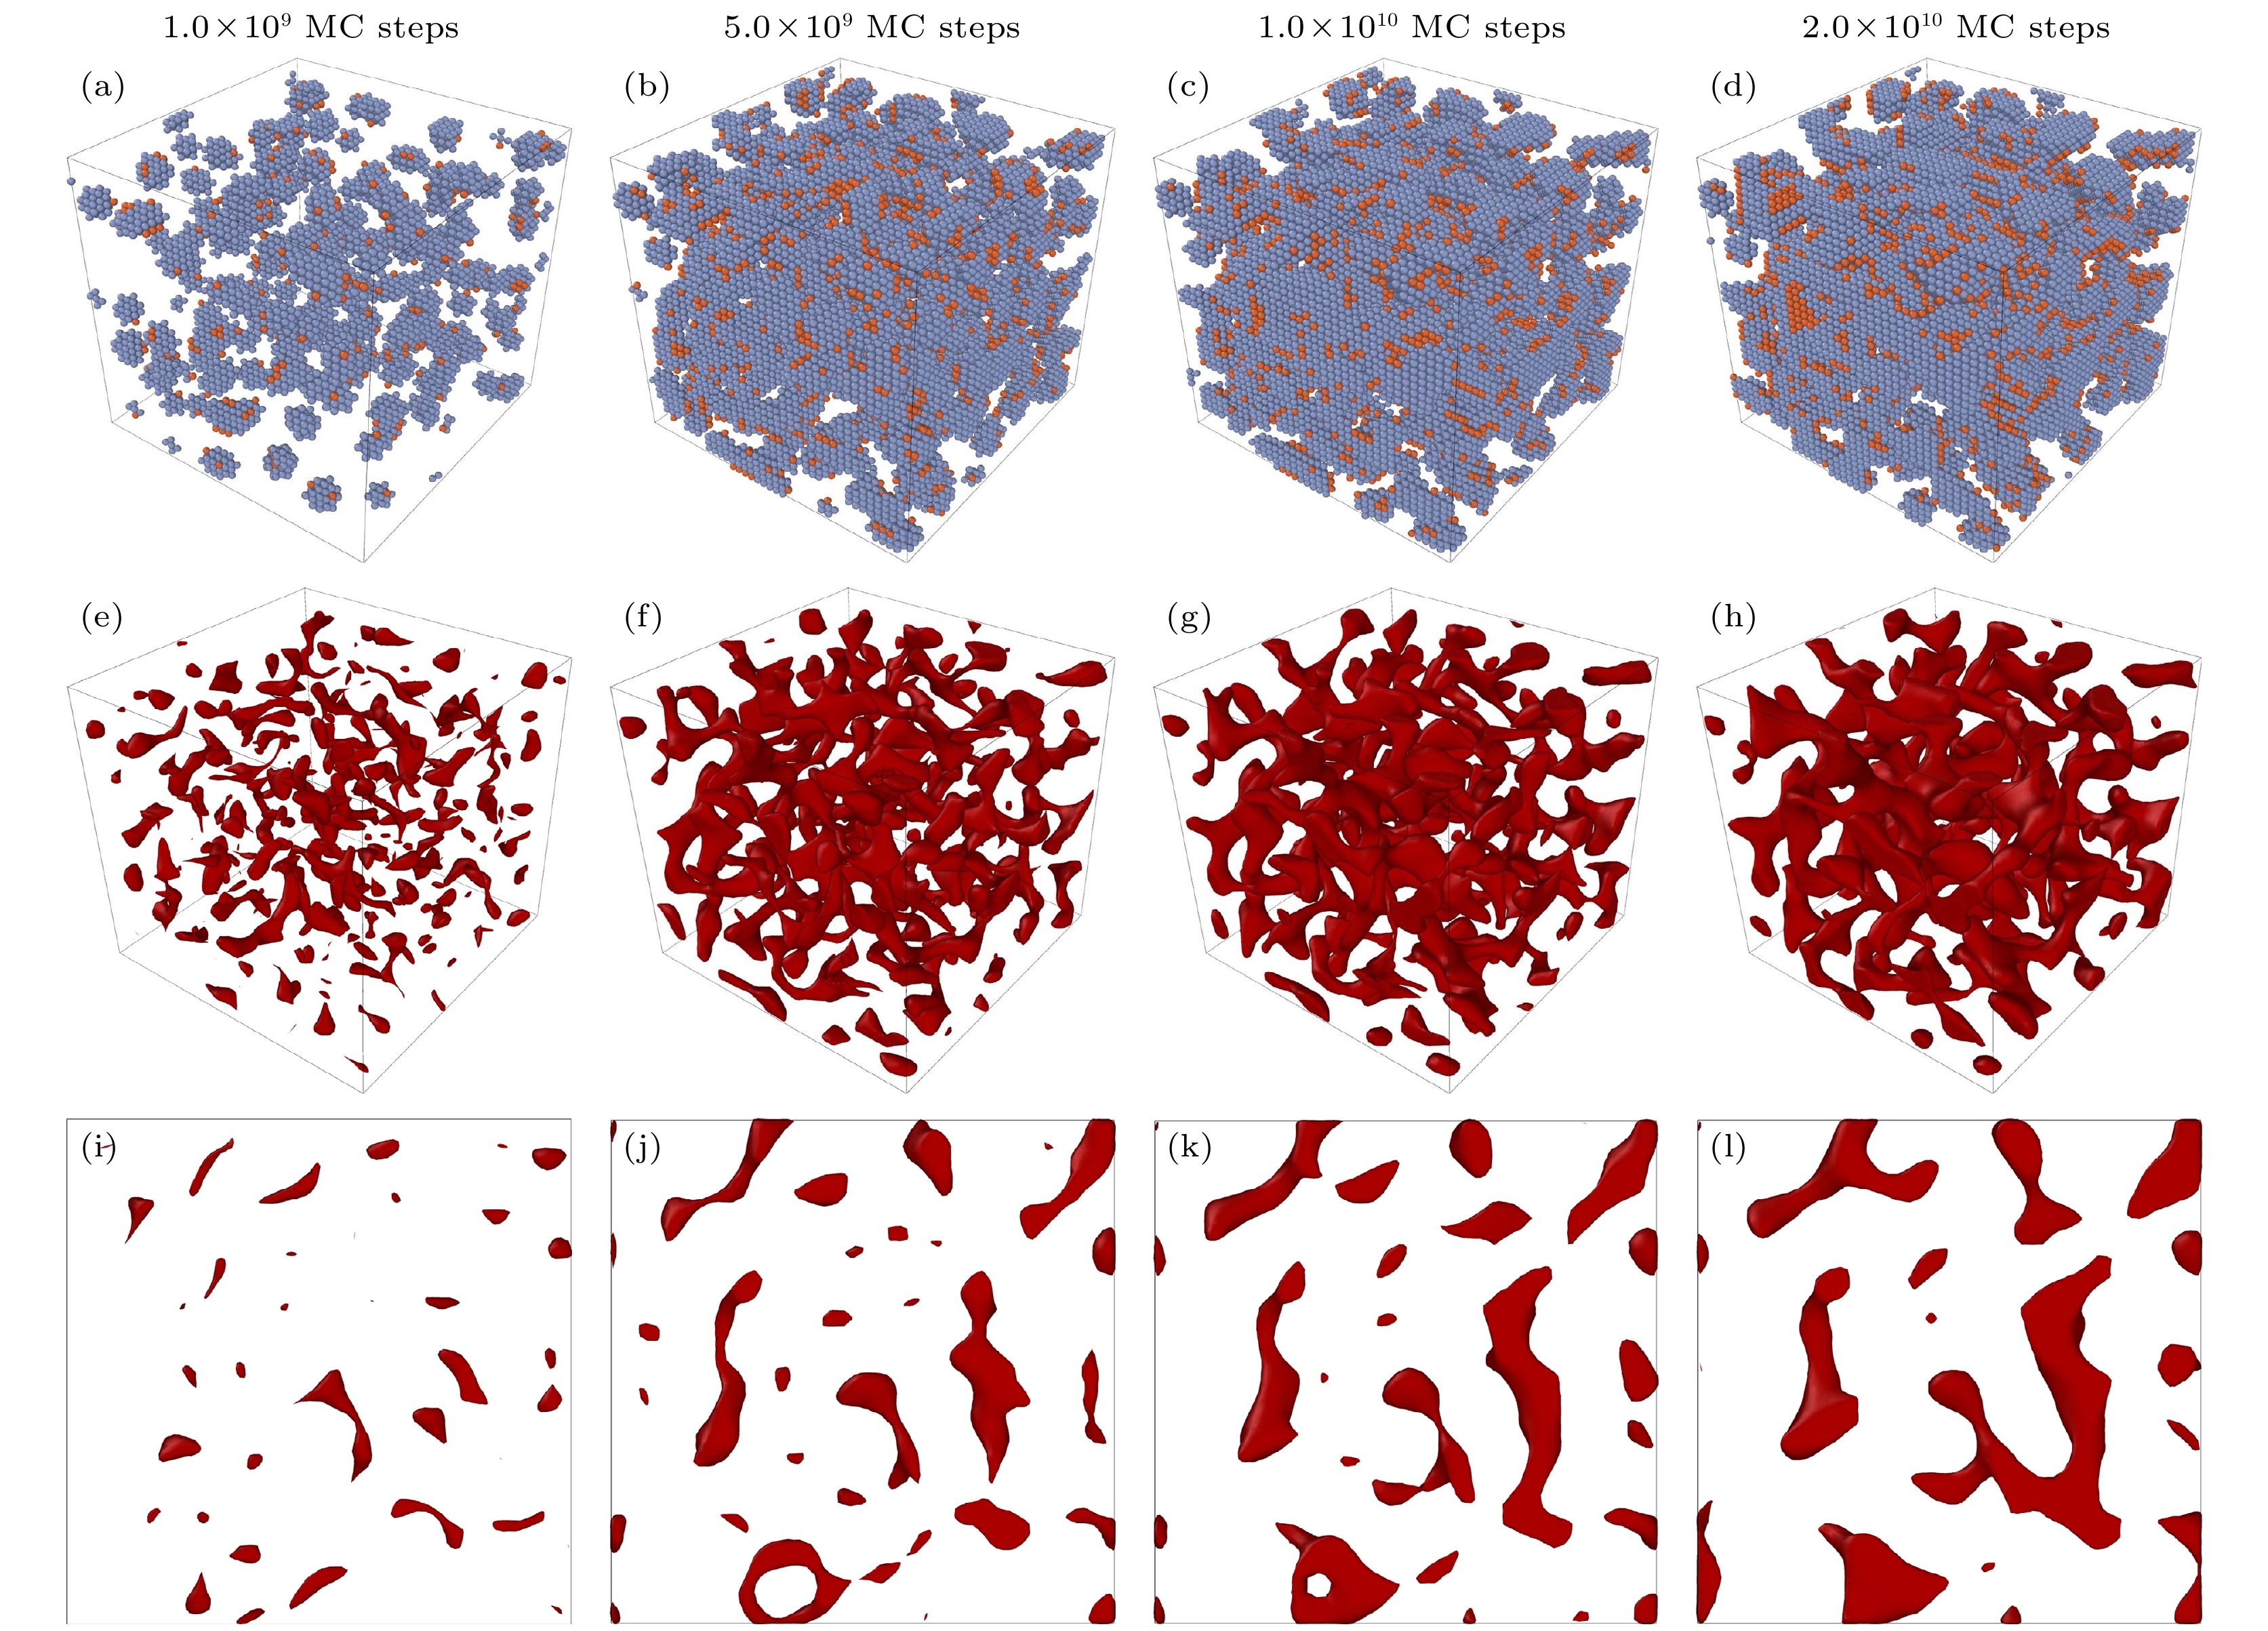
图 7 富Cr相在Fe-Cr (20.0%)合金中kMC模拟1.28×10⁵个原子晶胞 (a)—(d) 在不同时效阶段原子尺度晶体结构; (e)—(h) 对应质量密度场空间粗粒化形貌分析三维空间分布图; (i)—(l)典型二维截面图
Fig. 7. Cr-rich phase is simulated by kMC in Fe-Cr (20.0%) alloy with 1.28×10⁵ atoms: (a)–(d) Atomic structures obtained from kMC at different kMC steps; (e)–(h) 3D phase morphologies of Cr-rich precipitates in ferrite matrix; (i)–(l) phase morphologies illustrated on 2D slices.
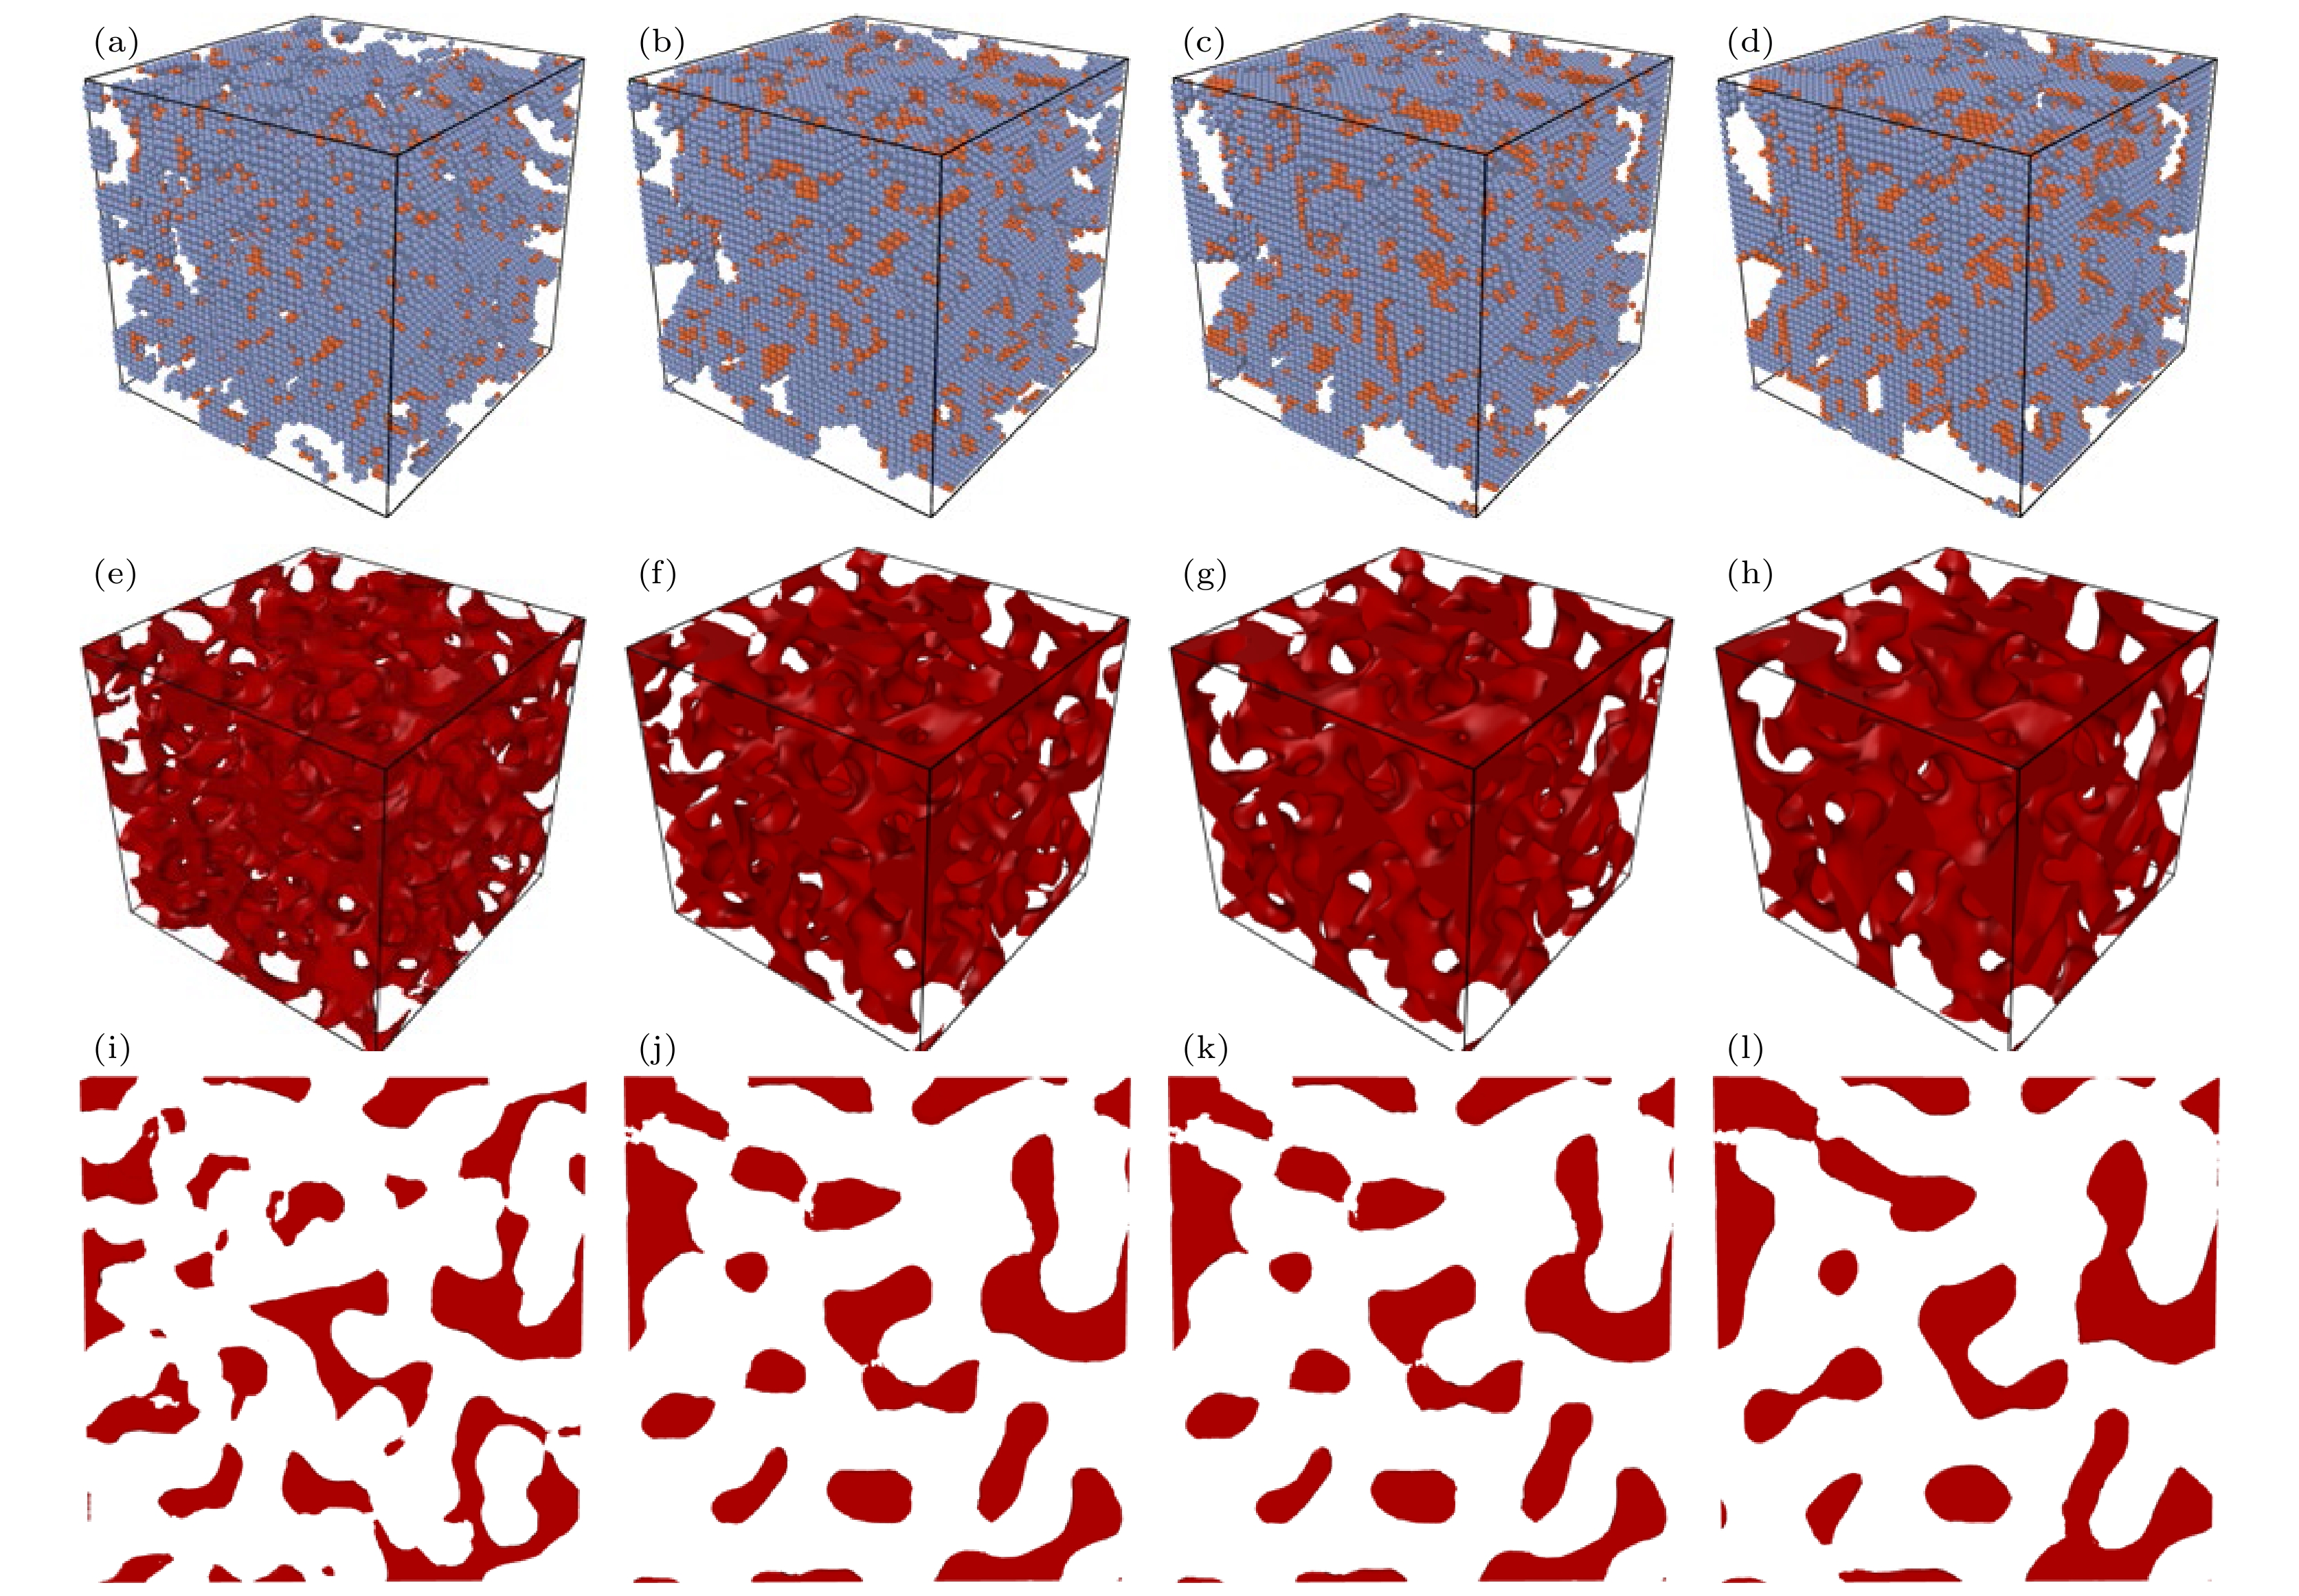
图 8 富Cr相在Fe-Cr (40.0%)合金中kMC模拟1.28×10⁵个原子晶胞 (a)—(d)不同时效阶段原子尺度晶体结构; (e)—(h) 质量密度场空间粗粒化形貌分析三维空间分布图; (i)—(l)典型二维截面图
Fig. 8. Cr-rich phase is simulated by kMC in Fe-Cr (40.0%) alloy with 1.28×10⁵ atoms: (a)–(d) Atomic structures obtained from kMC at different kMC steps; (e)–(h) 3D phase morphologies of Cr-rich precipitates in ferrite matrix; (i)–(l) phase morphologies illustrated on 2D slices.
图 10 基于质量密度场空间粗粒化模型计算的Fe-Cr合金Cr原子含量空间分布ACF在kMC不同时效阶段曲线 (a) Fe-Cr (12.8%); (b) Fe-Cr (20.0%); (c) Fe-Cr (30.0%); (d) Fe-Cr (40.0%)
Fig. 10. Obtained Cr atomic concentration ACF profiles at different aging stages in kMC simulations for four Fe-Cr alloys: (a) Fe-Cr (12.8%); (b) Fe-Cr (20.0%); (c) Fe-Cr (30.0%); (d) Fe-Cr (40.0%).
图 11 基于空间粗粒化模型分析Fe-Cr合金时效富Cr相形成动力学参数随kMC总步长及时效时间变化曲线 (a)富Cr相体积分数; (b)平均粒径; (c)富Cr相颗粒数密度
Fig. 11. Variations of phase transformation kinetic parameters versus the total kMC simulation steps and physical aging time for the formation of Cr-rich precipitates in four different Fe-Cr binary alloys based on spatial coarse-grained mass density field description: (a) Volume fraction of Cr-rich phase; (b) average diameter of precipitates; (c) number of density of Cr-rich precipitates.
-
[1] Terentyev D A, Bonny G, Malerba L 2008 Acta Mater. 56 3229
 Google Scholar
[2] Zhou J, Odqvist J, Höglund L, Thuvander M, Barkar T, Hedström P 2014 Scr. Mater. 75 62
 Google Scholar
[3] 史佳庆, 薛飞, 彭群家, 沈耀 2020 材料研究学报 34 328
 Google Scholar
Shi J Q, Xue F, Peng Q J, Shen Y 2020 Chin. J. Mater. Res. 34 328
 Google Scholar
[4] Xu X, Westraadt J E, Odqvist J, Youngs T G A, King S M, Hedström P 2018 Acta Mater. 145 347
 Google Scholar
[5] Yan Z, Li Y, Zhou X, Zhang Y, Hu R 2017 J. Alloys Compd. 725 1035
 Google Scholar
[6] Eich S M, Beinke D, Schmitz G 2015 Comput. Mater. Sci. 104 185
 Google Scholar
[7] Martínez E, Senninger O, Fu C, Soisson F 2012 Phys. Rev. B Condens. Matter Mater. Phys. 86 224109
 Google Scholar
[8] Pareige C, Roussel M, Novy S, Kuksenko V, Olsson P, Domain C, Pareige P 2011 Acta Mater. 59 2404
 Google Scholar
[9] Guo W, Garfinkel D A, Tucker J D, Haley D, Young G A, Poplawsky J D 2016 Nanotechnology 27 254004
 Google Scholar
[10] Xu X, Odqvist J, Colliander M H, Thuvander M, Steuwer A, Westraadt J E, King S, Hedstrom P 2016 Metall. Mater. Trans. A 47 5942
 Google Scholar
[11] Bonny G, Terentyev D, Malerba L 2008 Comput. Mater. Sci. 42 107
 Google Scholar
[12] Erhart P, Caro A, Serrano De Caro M, Sadigh B 2008 Phys. Rev. B Condens. Matter Mater. Phys. 77 134206
 Google Scholar
[13] Nguyen-Manh D, Lavrentiev M Y, Dudarev S L 2008 C. R. Phys. 9 379
 Google Scholar
[14] Zhou J, Odqvist J, Ruban A, Thuvander M, Xiong W, Ågren J, Olson G B, Hedström P 2017 J. Mater. Sci. 52 326
 Google Scholar
[15] Mukherjee D, Forslund A, Höglund L, Ruban A, Larsson H, Odqvist J 2022 Comput. Mater. Sci. 202 110955
 Google Scholar
[16] Olsson P, Wallenius J, Domain C, Nordlund K, Malerba L 2005 Phys. Rev. B Condens. Matter. 72 214119
[17] Ackland G J, Mendelev M I, Srolovitz D J, Han S, Barashev A V 2004 J. Phys. Condens. Matter. 16 S2629
 Google Scholar
[18] Vineyard G H 1957 J. Phys. Chem. Solids 3 121
 Google Scholar
[19] Willard A P, Chandler D 2010 J. Phys. Chem. B 114 1954
 Google Scholar
[20] Mathon M H, de Carlan Y, Geoffroy G, Averty X, Alamo A, de Novion C H 2003 J. Nucl. Mater. 312 236
 Google Scholar
[21] Miller M K, Hyde J M, Hetherington M G, Cerezo A, Smith G D W, Elliott C M 1995 Acta Metall. Mater. 43 3385
 Google Scholar
[22] Huse D A 1986 Phys. Rev. B 34 7845
[23] Lifshitz I M, Slyozov V V 1961 J. Phys. Chem. Solids 19 35
 Google Scholar
[24] Wagner C 1961 Elektro. Chem. 65 581
[25] Lebowitz J L, Marro J, Kalos M H 1982 Acta Metall. Mater. 30 297
 Google Scholar
[26] Novy S, Pareige P, Pareige C 2009 J. Nucl. Mater. 384 96
 Google Scholar
计量
- 文章访问数: 7017
- PDF下载量: 116
- 被引次数: 0


 下载:
下载:


