


-
Based on the tested data of laser absorption spectra, a matrix slicing method is proposed to invert the absorption function of spectral lines by using the two parameters of laser modulation frequency and laser scanning range as well as transmitted wave signal and reference wave signal under the condition of slow uniform scanning wavelength and fast periodic modulation wavelength. When the modulation is single frequency sinusoidal modulation, an accurate contour of the spectral line absorption function can be obtained by using the matrix data consisting of the values of the transmitted wave signal by the reference wave signal through the minimum value of two slice integrals with the interval of half modulation period, and the amplitude of modulation can be estimated. When the fast modulation of the wavelength is distorted to the multi-frequency superposition modulation, the absorption function is also formed by using the complementarity of multiple slices. The method above is utilized for investigating a real absorption function inversion process involving multiple overlapping absorption lines in the range of the scanning wavelengths. Moreover, the scanning range of laser wavelength can be calibrated by the interval parameters of several spectral lines in the scanning wavelength range. The absorption function of CO at 4300.700 cm–1 and CO2 at 6336 cm–1 are successfully obtained by using this matrix slice method for experimental verification.
-
Keywords:
- wavelength modulation /
- wavelength scanning /
- absorption function /
- data matrix
[1] Werle P A 1998 Spectrochim. Acta. A 54 197
 Google Scholar
[2] Bain J R P, Johnstone W, Ruxton K, Stewart G, Lengden M, Duffin K 2011 J. Lightw. Technol. 29 987
Google Scholar
[3] Reid J, Labrie D 1981 Appl. Phys. B: Photophys. Laser Chem. 26 203
Google Scholar
[4] Rieker G B, Jeffffries J B, Hanson R K 2009 Appl. Optics. 48 5546
Google Scholar
[5] Wang Z H, Fu P F, Chao X 2019 Appl. Sci. 9 2723
Google Scholar
[6] Goldenstein C S, Strand C L, Schultz I A, Sun K, Jeffries J B, Hanson R K 2014 Appl. Opt. 53 356
Google Scholar
[7] Wang F, Jia S H, Wang Y L, Tang Z H 2019 Appl. Sci-Basel. 9 9142816
Google Scholar
[8] Stewart G, Johnstone W, Bain J R P, Ruxton K, Duffin K 2011 J. Lightw. Technol. 29 811
Google Scholar
[9] McGettrick J, Duffin K, Johnstone W, Stewart G, Moodie D G 2008 J. Lightw. Technol. 26 432
Google Scholar
[10] Duffin K, McGettrick A J, Johnstone W, Stewart G, Moodie D G 2007 J. Lightw. Technol. 25 3114
Google Scholar
[11] Sun K, Chao X, Sur R, Goldenstein C S, Jeffries J B, Hanson R K 2013 Meas. Sci. Technol. 24 125203
Google Scholar
[12] Peng Z M, Du Y J, Ding Y J 2020 Sensors. 20 681
Google Scholar
[13] Sun K, Chao X, Sur R, Jeffries J B, Hanson R K 2013 Appl. Phys. B 110 497
Google Scholar
[14] Peng Z M, Ding Y J, Che L, Yang Q S 2012 Opt. Express 20 11976
Google Scholar
[15] Du Y J, Peng Z M, Ding Y J 2018 Opt. Express 26 9263
Google Scholar
[16] Peng Z M, Du Y J, Ding Y J 2020 Sensors 20 616
Google Scholar
[17] Peng Z M, Ding Y J, Che L, Li X H, Zheng K J 2011 Opt. Express 19 23104
Google Scholar
[18] Tao B, Lei Q C, Ye J F, Zhang Z R, Hu Z Y, Fan W 2020 Appl. Phys. B: Lasers Opt. 126 31
Google Scholar
[19] Tian X, Cao Y, Chen J J, Liu K, Wang G S, Tan T, Mei J X, Chen W D, Gao X M 2019 Sens. 19 820
Google Scholar
[20] Li H J, Rieker G B, Liu X, Jeffries J B, Hanson R K 2006 Appl. Opt. 45 1052
Google Scholar
[21] Li J D, Du Y J, Peng Z M, Ding Y J 2019 J. Quant. Spectrosc. Ra. 224 197
Google Scholar
[22] Sur R, Sun K, Jeffries J B, Socha J G, Hanson R K 2015 Fuel 150 102
Google Scholar
[23] Rieker G B, Jeffries J B, Hanson R K 2009 Appl. Phys. B 94 51
Google Scholar
[24] Cai T D, Gao G Z, Wang M R, Wang G S, Liu Y, Gao X M 2007 J. Quant. Spectrosc. Radiat. Transfer. 201 136
Google Scholar
[25] Gordon I E, Rothman L S, Hill C, et al. 2017 J. Quant. Spectrosc. Ra. 203 3
Google Scholar
-

图 1 (a) 3个吸收谱线的吸收函数; (b) 利用波长的慢速均匀扫描和快速单频正弦调制得到的
$A\varphi$ 数据矩阵等高图像Figure 1. (a) Absorption function of three absorption lines; (b) the contour image of the data matrix for
${A}{\varphi }$ with a slow uniform scanning of the center wavelength and a fast sinusoidal modulation.
图 2 (a) 对应的两个间隔半个周期的吸收函数面积绝对值之差随调制时间的演化曲线; (b) 两个标准吸收函数曲线和调制时间偏置1/4周期对应的吸收函数曲线; (c) 图(b)中的两个标准吸收函数曲线和理论值的残值误差
Figure 2. (a) Evolution curve of the difference of the absolute values of the areas of two absorption function with a half-period interval; (b) the two standard absorption function curves and the absorption function curves with an offset of 1/4 period; (c) the residuals of the two standard absorption functions in panel (b) and theoretical values.
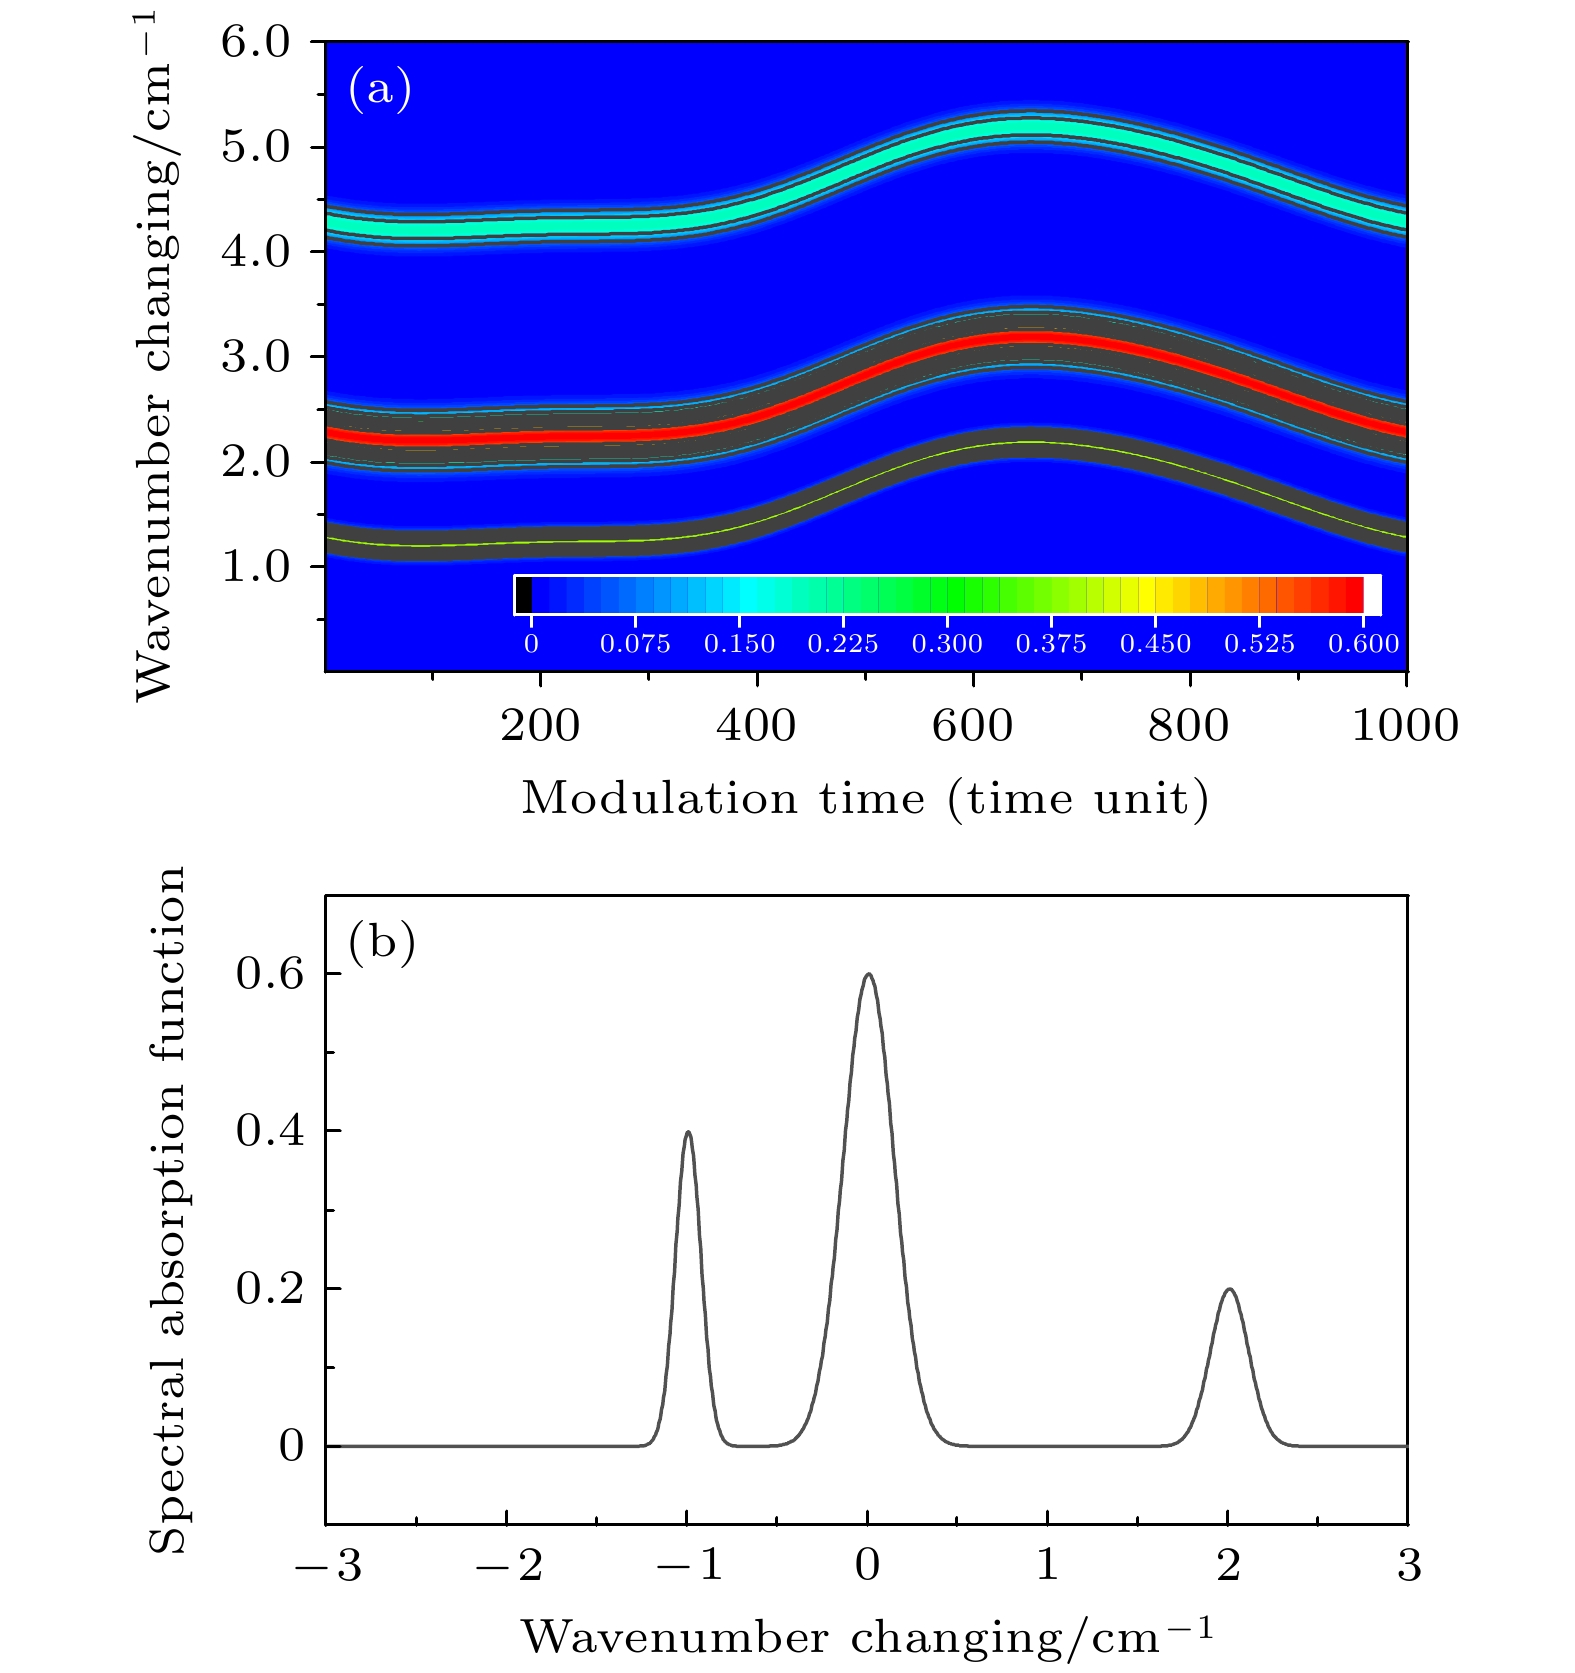
图 3 (a) 调制为3个频率的叠加时A
$\varphi$ 数据矩阵对应的等高吸收线图; (b) 利用等高吸收图得到的以吸收最大值出现在零波数点的吸收函数曲线Figure 3. (a) Contour absorption map of the data matrix for A
${\varphi }$ with a superposition modulation of three frequencies; (b) the absorption function curve obtained by using contour absorption graph where the absorption maximum is defined at the zero point of the wavenumber changing.
图 4 波长慢速均匀变化和快速调制激光吸收光谱实验装置
Figure 4. Experimental apparatus for laser absorption spectra with slow uniform wavelength scanning and fast wavelength modulation.

图 5 (a) CO和 (b) CO2波长扫描和调制的激光吸收光谱实验数据
Figure 5. Tested data of the laser absorption spectroscopy experiments for (a) CO and (b) CO2 with the slow scanning and fast modulation of the laser wavelength.
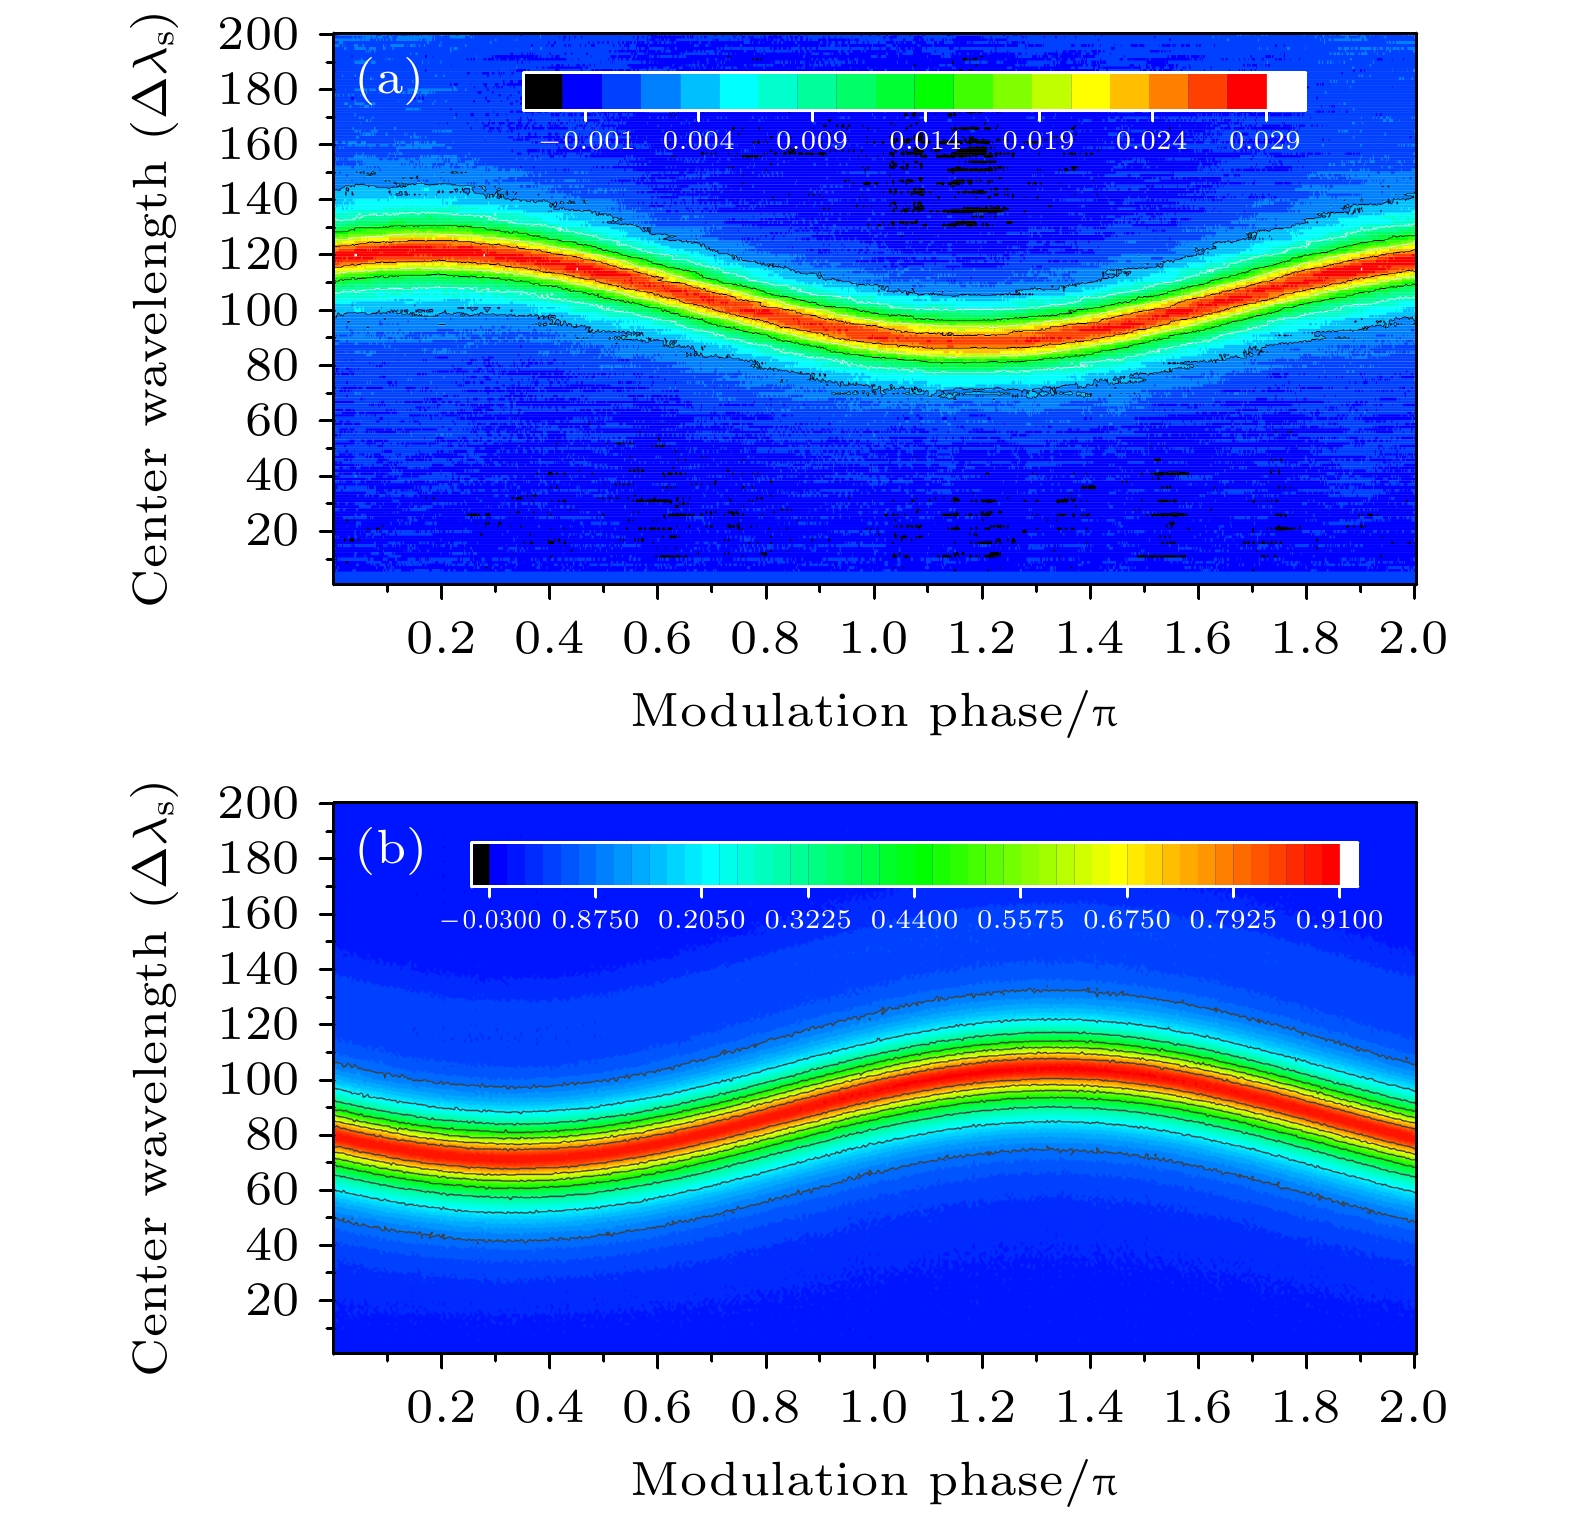
图 6 (a) CO和(b) CO2波长扫描和调制的激光吸收光谱实验数据对应的A
$\varphi$ 数据矩阵Figure 6. Contour image of the data matrix for A
${\varphi }$ from the laser absorption spectroscopy experiments for (a) CO and (b) CO2 with the slow scanning and fast modulation of the laser wavelength.
图 7 利用图6所示的实验得到的数据矩阵和时间间隔为半个调制周期的两个切片沿波长扫描方向积分值之差的最小绝对值得到的吸收光谱轮廓 (a) CO; (b) CO2
Figure 7. Absorption spectrum profiles for (a) CO and (b) CO2 by minimizing the absolute difference of the integral values along the center wavelength scanning direction between two slices with an interval of half a modulation period and based on the matrix data shown in Fig. 6.
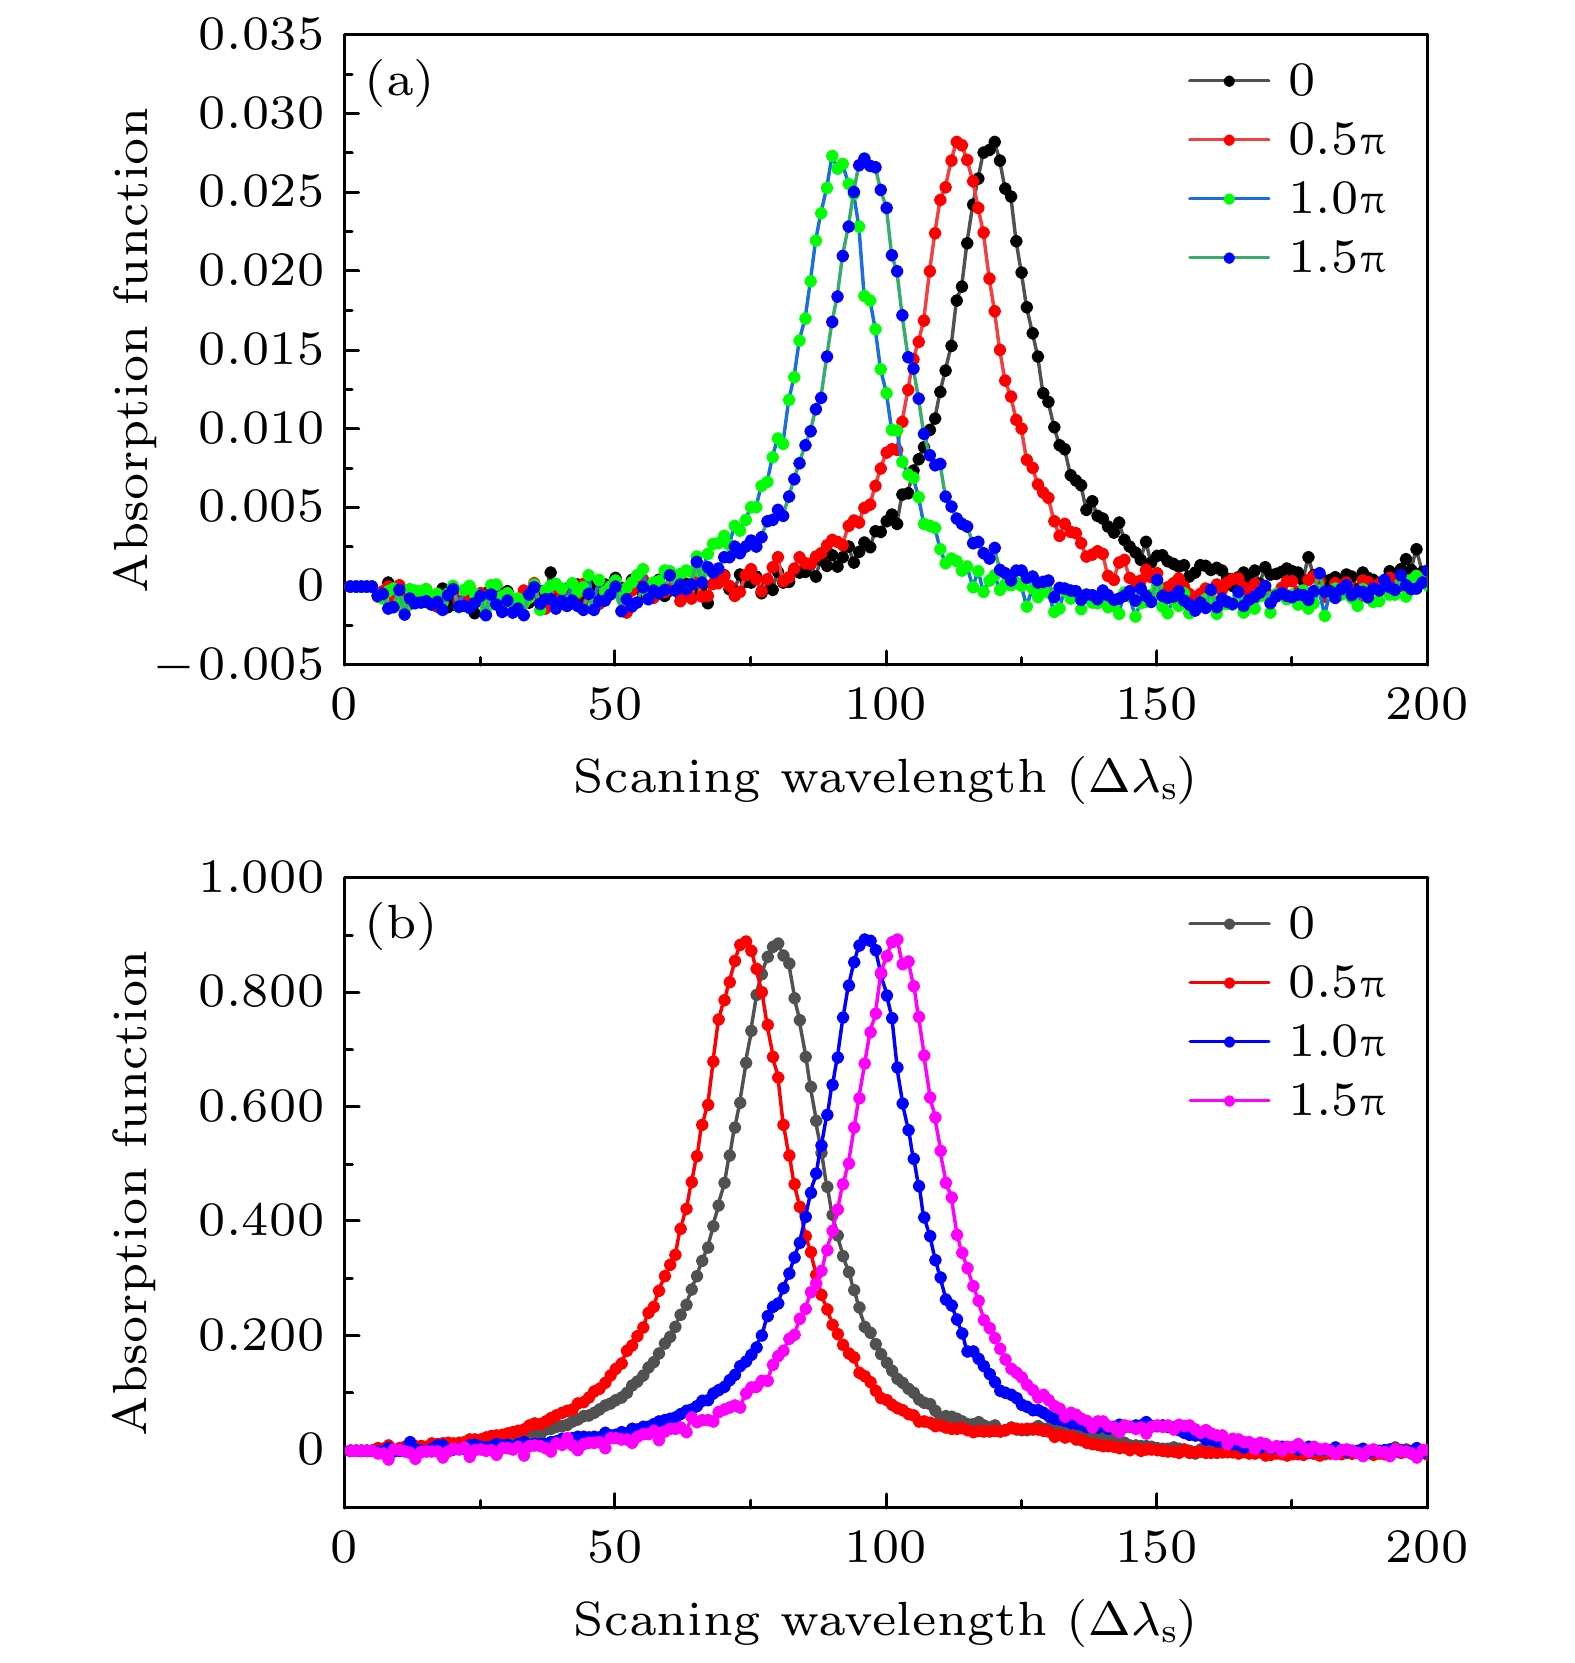
图 8 在两种测量中, 从对应的数据矩阵中选择不同波长调制相位处的数据切片轮廓所得到的气体吸收函数轮廓 (a) CO; (b) CO2
Figure 8. Spectral absorption function obtained by the data slice contours selected from the two tested data matrix with different wavelength modulation phases: (a) CO; (b) CO2.
-
[1] Werle P A 1998 Spectrochim. Acta. A 54 197
Google Scholar
[2] Bain J R P, Johnstone W, Ruxton K, Stewart G, Lengden M, Duffin K 2011 J. Lightw. Technol. 29 987
Google Scholar
[3] Reid J, Labrie D 1981 Appl. Phys. B: Photophys. Laser Chem. 26 203
Google Scholar
[4] Rieker G B, Jeffffries J B, Hanson R K 2009 Appl. Optics. 48 5546
Google Scholar
[5] Wang Z H, Fu P F, Chao X 2019 Appl. Sci. 9 2723
Google Scholar
[6] Goldenstein C S, Strand C L, Schultz I A, Sun K, Jeffries J B, Hanson R K 2014 Appl. Opt. 53 356
Google Scholar
[7] Wang F, Jia S H, Wang Y L, Tang Z H 2019 Appl. Sci-Basel. 9 9142816
Google Scholar
[8] Stewart G, Johnstone W, Bain J R P, Ruxton K, Duffin K 2011 J. Lightw. Technol. 29 811
Google Scholar
[9] McGettrick J, Duffin K, Johnstone W, Stewart G, Moodie D G 2008 J. Lightw. Technol. 26 432
Google Scholar
[10] Duffin K, McGettrick A J, Johnstone W, Stewart G, Moodie D G 2007 J. Lightw. Technol. 25 3114
Google Scholar
[11] Sun K, Chao X, Sur R, Goldenstein C S, Jeffries J B, Hanson R K 2013 Meas. Sci. Technol. 24 125203
Google Scholar
[12] Peng Z M, Du Y J, Ding Y J 2020 Sensors. 20 681
Google Scholar
[13] Sun K, Chao X, Sur R, Jeffries J B, Hanson R K 2013 Appl. Phys. B 110 497
Google Scholar
[14] Peng Z M, Ding Y J, Che L, Yang Q S 2012 Opt. Express 20 11976
Google Scholar
[15] Du Y J, Peng Z M, Ding Y J 2018 Opt. Express 26 9263
Google Scholar
[16] Peng Z M, Du Y J, Ding Y J 2020 Sensors 20 616
Google Scholar
[17] Peng Z M, Ding Y J, Che L, Li X H, Zheng K J 2011 Opt. Express 19 23104
Google Scholar
[18] Tao B, Lei Q C, Ye J F, Zhang Z R, Hu Z Y, Fan W 2020 Appl. Phys. B: Lasers Opt. 126 31
Google Scholar
[19] Tian X, Cao Y, Chen J J, Liu K, Wang G S, Tan T, Mei J X, Chen W D, Gao X M 2019 Sens. 19 820
Google Scholar
[20] Li H J, Rieker G B, Liu X, Jeffries J B, Hanson R K 2006 Appl. Opt. 45 1052
Google Scholar
[21] Li J D, Du Y J, Peng Z M, Ding Y J 2019 J. Quant. Spectrosc. Ra. 224 197
Google Scholar
[22] Sur R, Sun K, Jeffries J B, Socha J G, Hanson R K 2015 Fuel 150 102
Google Scholar
[23] Rieker G B, Jeffries J B, Hanson R K 2009 Appl. Phys. B 94 51
Google Scholar
[24] Cai T D, Gao G Z, Wang M R, Wang G S, Liu Y, Gao X M 2007 J. Quant. Spectrosc. Radiat. Transfer. 201 136
Google Scholar
[25] Gordon I E, Rothman L S, Hill C, et al. 2017 J. Quant. Spectrosc. Ra. 203 3
Google Scholar


 DownLoad:


Catalog
Metrics
- Abstract views: 4336
- PDF Downloads: 96
- Cited By: 0
