-
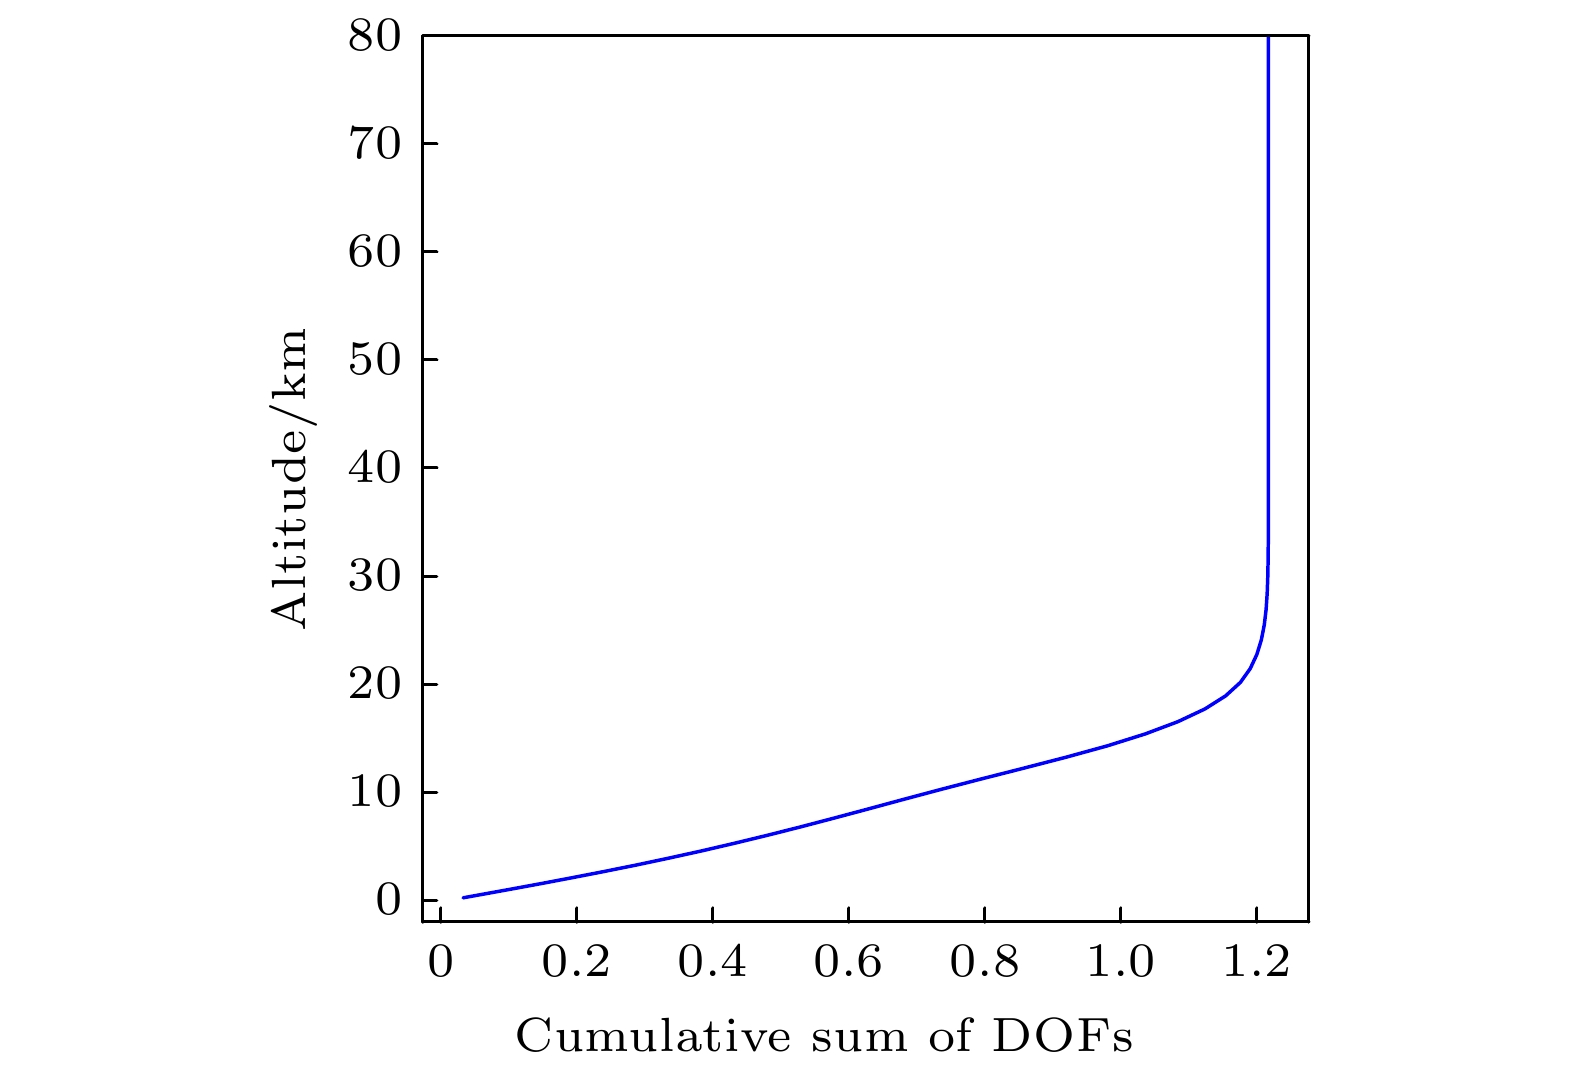
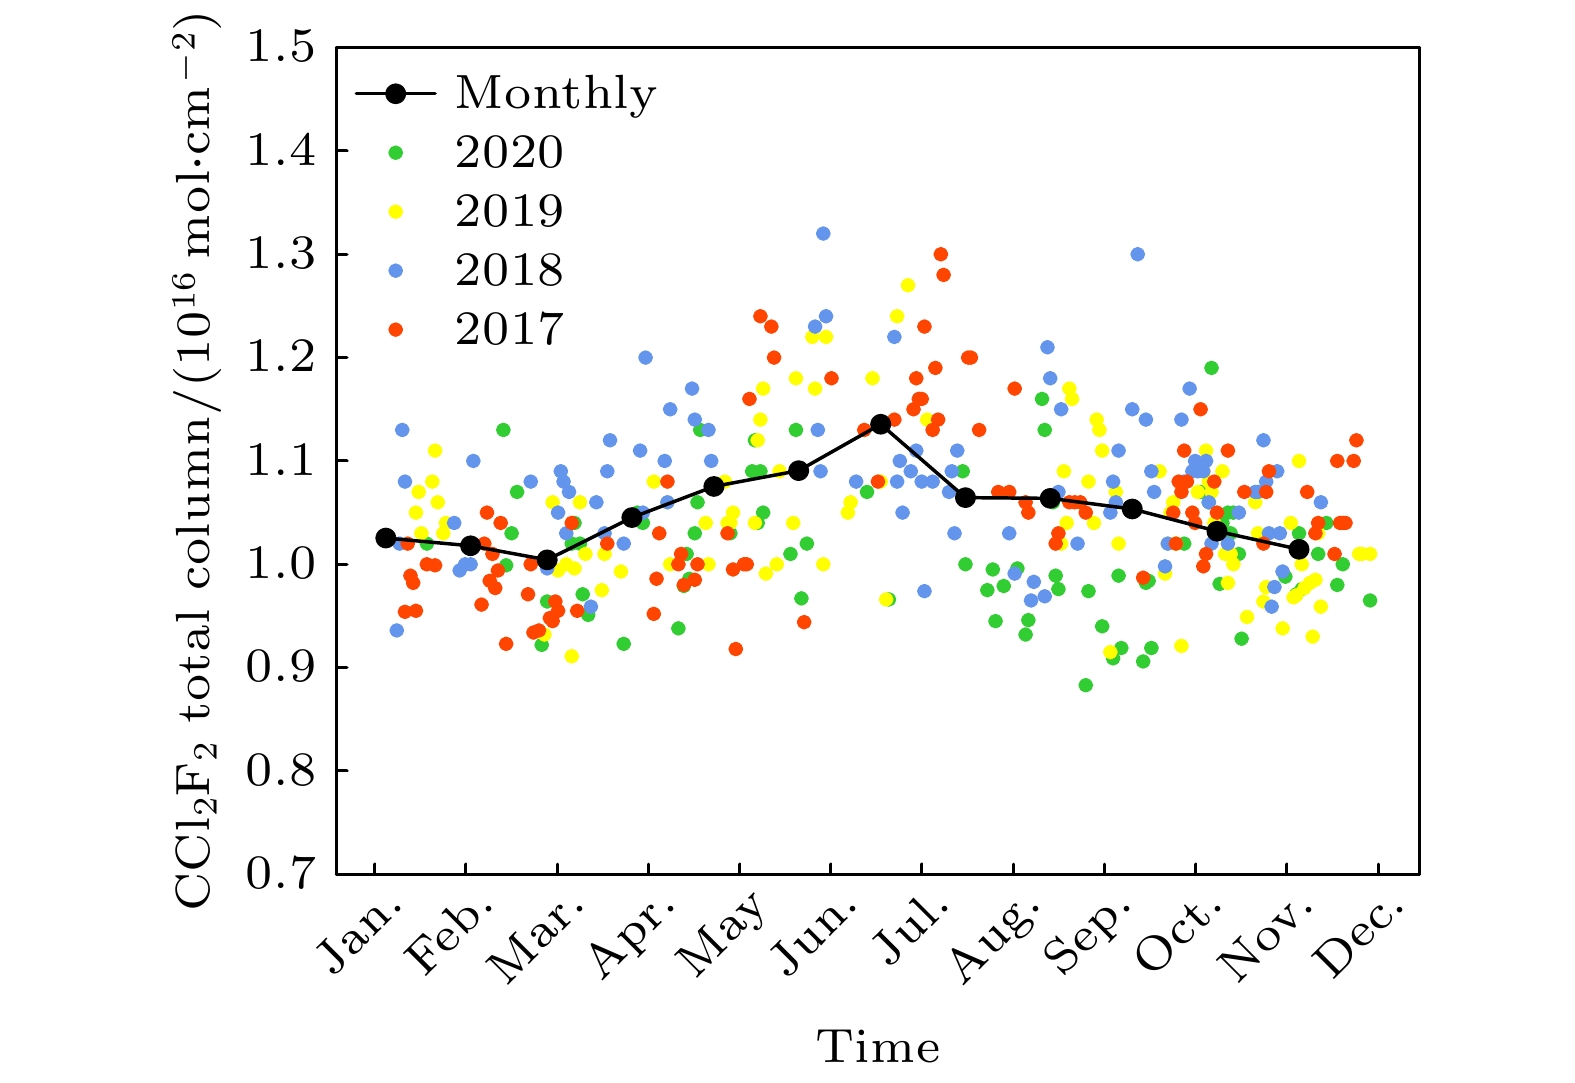
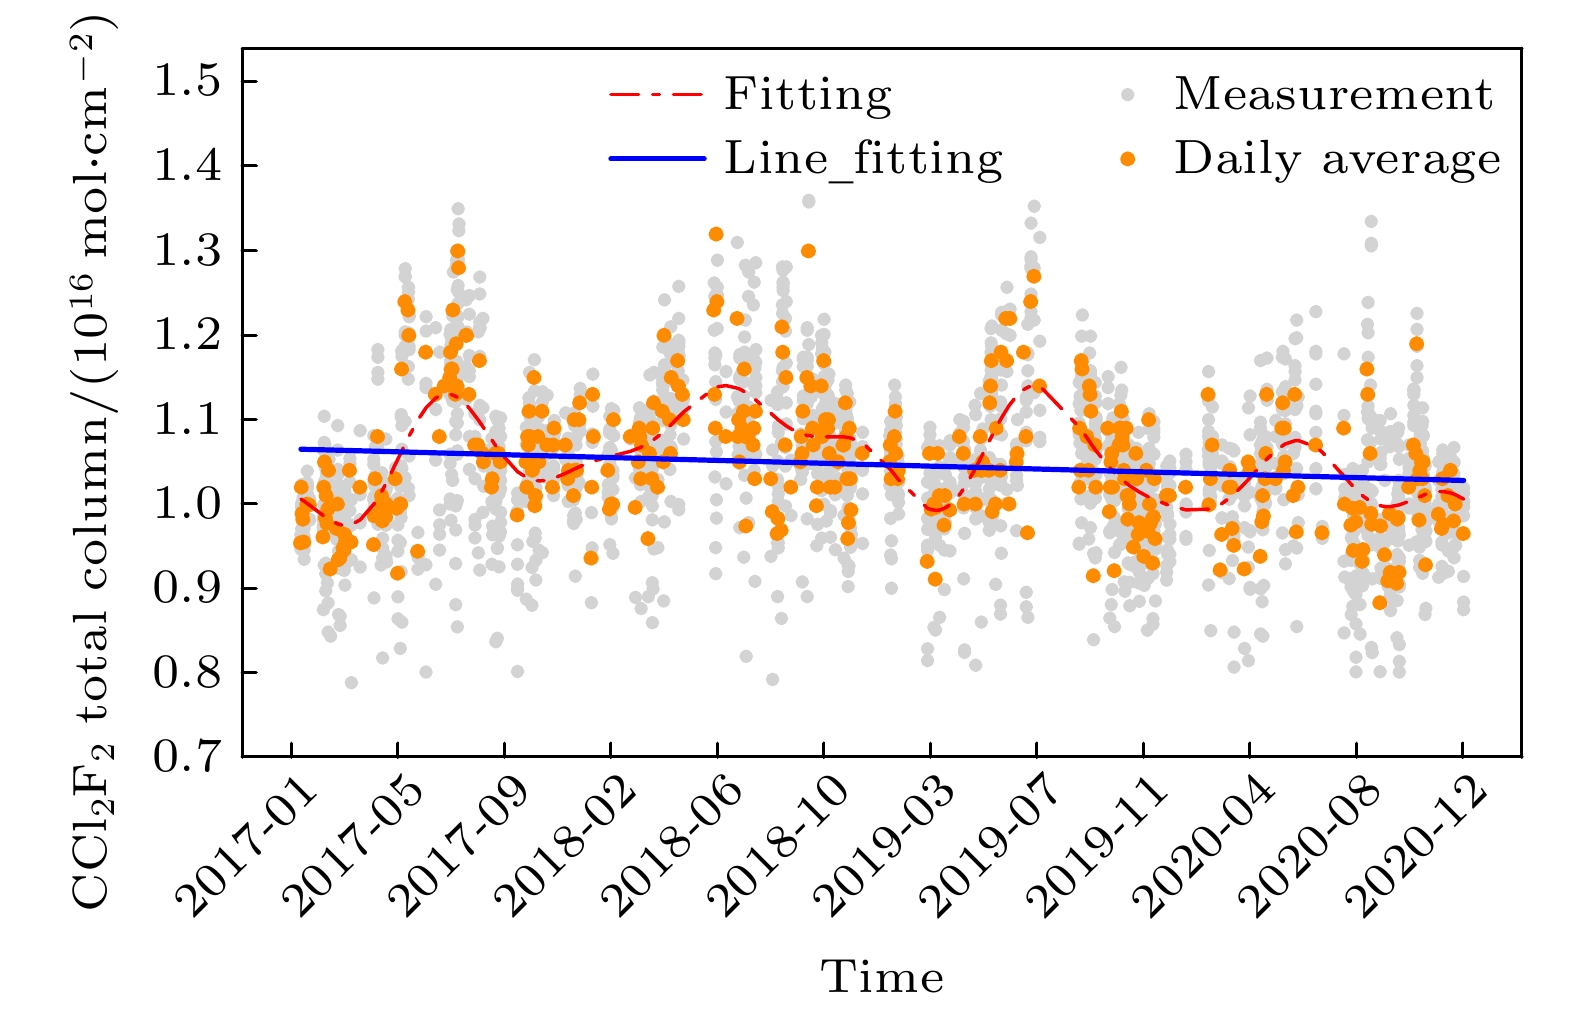
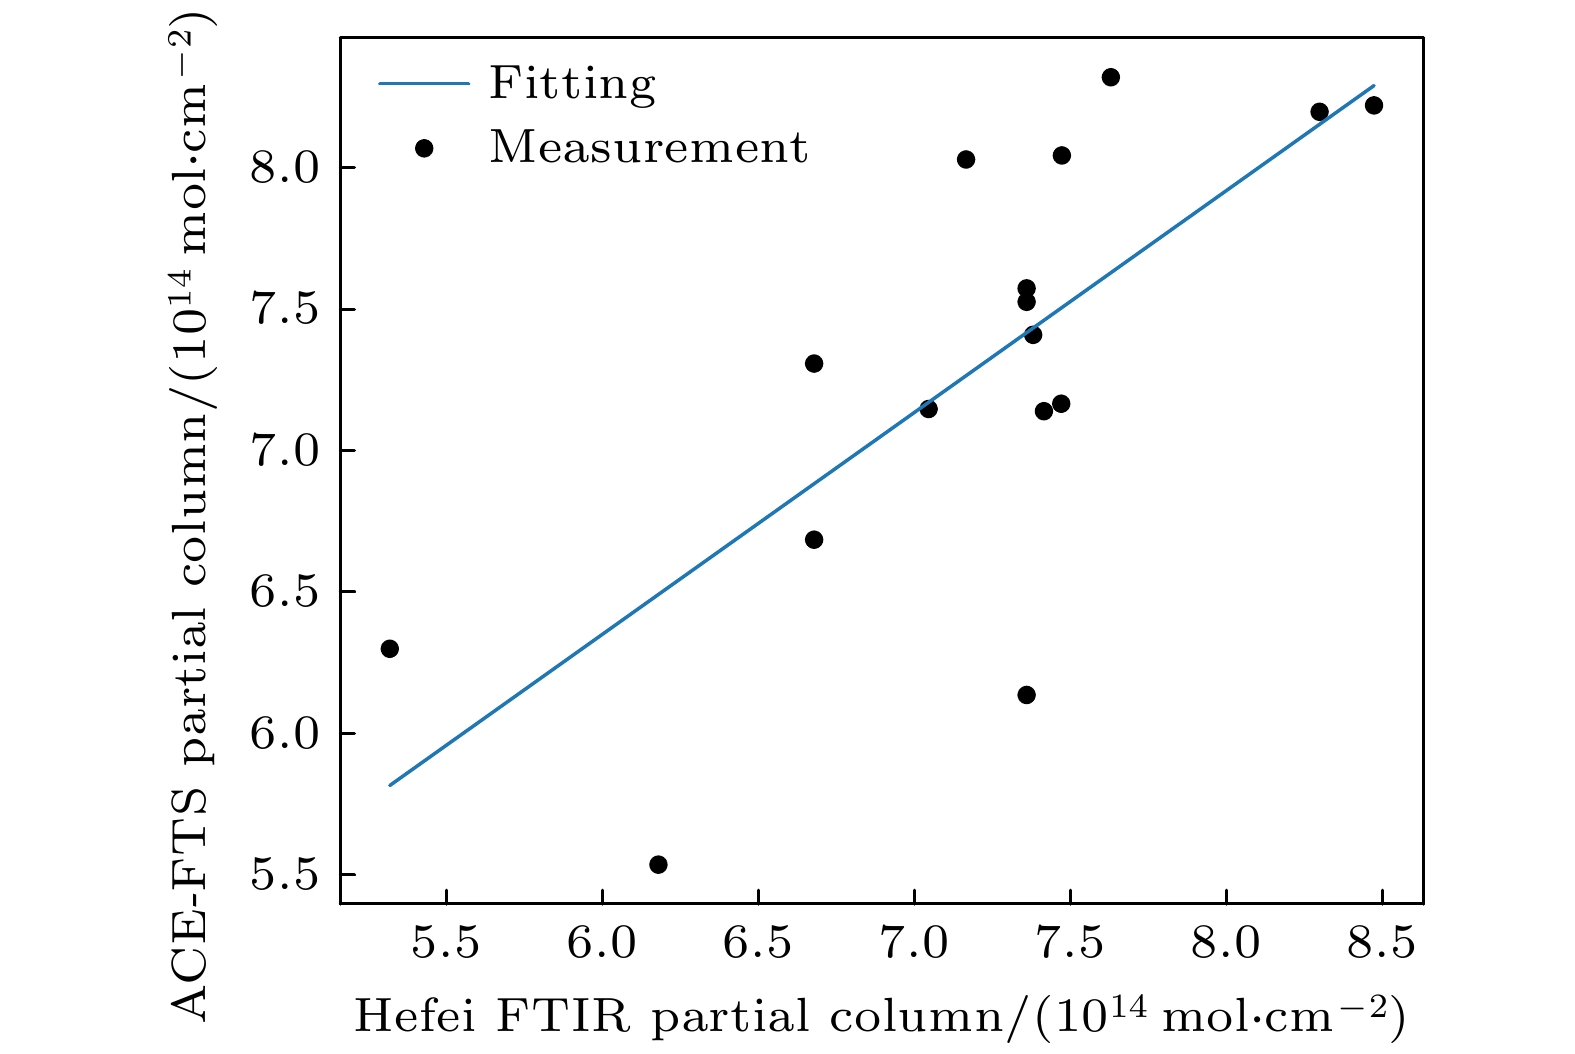
大气二氯二氟甲烷(CCl2F2, CFC-12)是人工合成的化学制剂, 对平流层臭氧可产生严重的破坏和损耗. 研究大气CFC-12的探测技术并获取其时空分布和变化, 对了解区域氟氯烃气体变化趋势以及对平流层臭氧的影响具有重要意义. 本文利用地基高分辨率傅里叶变换红外光谱 (Fourier transform infrared spectroscopy, FTIR) 技术研究大气CFC-12的垂直分布和柱浓度的反演方法, 基于最优估计算法反演2017—2020年合肥地区大气CFC-12的垂直廓线和柱总量. 合肥大气CFC-12反演获得的垂直廓线表明, 大气CFC-12在对流层以及低平流层处具有较高浓度, 在垂直高度40 km以上浓度极低. 合肥地区大气CFC-12的柱浓度含量呈现出夏季浓度较高, 冬季与初春浓度较低的季节变化; 观测期间大气CFC-12柱浓度呈现缓慢下降的趋势, 年均变化率为–0.68%. 将地基观测数据与ACE-FTS卫星观测数据进行比对, 在高度范围16—28 km内两个CFC-12偏柱总量的相关性系数为0.73, 可见地基和卫星数据具有较好的一致性. 长期观测结果表明了地基高分辨率FTIR技术在观测大气中CFC-12的浓度垂直分布与季节变化上具有高的准确性和可靠性.Atmospheric dichlorodifluoromethane (CCl2F2, CFC-12), as a synthetic chemical agent, is a main stratospheric ozone-depleting substance in atmosphere. Studies of the detection techniques and the temporal and spatial distribution of CFC-12 have great significance in understanding the variation trend of regional CFCs and their influence on stratospheric ozone. In this study, the method of retrieving the vertical profile and total column for CFC-12 is studied based on ground-based high-resolution Fourier transform infrared spectroscopy (FTIR). The spectral window for CFC-12 retrieval is selected as 922.5–923.6 cm–1, where the interfering gases are H2O, O3, and CO2. The result of error analysis shows that the average total error is 1.27%, including the systematic error 0.76% and random error 1.02%. The vertical profiles and total columns of atmospheric CFC-12 in Hefei during the period from 2017 to 2020 were retrieved based on the optimal estimation algorithm. The vertical profiles of CFC-12 show that the concentration of atmospheric CFC-12 is high in the troposphere and low stratosphere at the altitude of 0–20 km, and then decreases, very low at height above 40 km. The total column average kernel of retrieved CFC-12 profiles is higher at 15–20 km, and the typical signal degree of freedom of CFC-12 is 1.217. Moreover, the long-term total columns of atmosphere CFC-12 observed show obvious seasonal variation in Hefei. Total columns of atmosphere CFC-12 are higher in summer and lower in winter and early spring. The maximum monthly concentration of CFC-12 is about 1.13 × 10¹⁶ mol·cm–2 in July, and the minimum monthly concentration is 1.00 × 10¹⁶ mol·cm–2 in March. Also, the annual average total columns of atmospheric CFC-12 decreased slightly from 2017 to 2020, with an increasing rate of –0.68%. This reflects the effect of China's implementation of CFCs control ban policy. Furthermore, in order to verify the accuracy of ground-based FTIR observation, we compare our ground-based observation data with ACE-FTS/ SCISAT satellite version 4.1 level 2 data. There are 16 pairs of matching points between satellite observation and ground observation data, and the correlation coefficient is 0.73 for two CFC-12 partial columns at the height of 16–28 km, showing good agreement between ground-based FTIR data and satellite data. The long-term observations demonstrate the accuracy and reliability of ground-based high-resolution FTIR technology for detecting the vertical distribution and seasonal variation of atmosphere CFC-12.
-
Keywords:
- dichlorodifluoromethane /
- solar absorption spectrum /
- total column /
- vertical profile
[1] 王凤, 张剑波, 冯金敏, 刘德英 2010 环境科学学报 30 1758
Wang F, Zhang J B, Feng J M, Liu D Y 2010 Acta Sci. Circum. 30 1758
[2] Molina M J, Rowland F S 1974 Nature 249 810
 Google Scholar
[3] Hansen J, Lacis A, Prather M 1989 J. Geophys. Res. Atmos. 94 16417
 Google Scholar
[4] Zurer P 1995 Chem. Eng. News 73 25
 Google Scholar
[5] Zhang F, Zhou L X, Yao B, Zhang X C, Xu L, Zhang X L, Zhou H G, Dong F, Zhou L Y 2011 Sci. Chin.-Earth Sci. 54 298
 Google Scholar
[6] Yang M M, Yang F C, Li H L, Li T, Cao F F, Nie X L, Zhen J B, Li P Y, Wang Y 2021 Sci. Total Environ. 754 142290
 Google Scholar
[7] 张芳, 王新明, 李龙凤, 易志刚, 周凌晞, 盛国英, 傅家谟 2006 地球与环境 34 19
Zhang F, Wang X M, Yi Z G, Li L F, Zhou L X, Donald R B, Sheng G Y, Fu J M 2006 Earth Environ. 34 19
[8] Zhang F, Zhou L, Yao B, Vollmer M K, Greally B R, Simmonds P G, Reimann S, Stordal F, Maione M, Xu L 2010 Atmos. Environ. 44 4454
 Google Scholar
[9] Tegtmeier S, Hegglin M I, Anderson J, Funke B, Gille J, Jones A, Smith L, von Clarmann T, Walker K A 2016 Earth Syst. Sci. Data 8 61
 Google Scholar
[10] Wang W, Tian Y, Liu C, Sun Y W, Liu W Q, Xie P H, Liu J G, Xu J, Morino I, Velazco V A, Griffith D T, Notholt J, Warneke T 2017 Atmos. Meas. Tech. 10 2627
 Google Scholar
[11] Yin H, Sun Y W, Liu C, Lu X, Smale D, Blumenstock T, Nagahama T, Wang W, Tian Y, Hu Q H, Shan C G, Zhang H F, Liu J G 2020 Opt. Express 28 8041
 Google Scholar
[12] 单昌功, 王薇, 刘诚, 徐兴伟, 孙友文, 田园, 刘文清 2017 66 220204
 Google Scholar
Shan C G, Wang W, Liu C, Xu X W, Sun Y W, Tian Y, Liu W Q 2017 Acta Phys. Sin. 66 220204
 Google Scholar
[13] 章惠芳, 王薇, 刘诚, 单昌功, 胡启后, 孙友文, Jones N 2020 光学学报 40 23
Zhang H F, Wang W, Liu C, Shan C G, Hu Q H, Sun Y W, Jones N 2020 Acta Optic. Sin. 40 23
[14] Notholt J 1994 Geophys. Res. Lett. 21 2385
 Google Scholar
[15] Mahieu E, Rinsland C P, Gardiner T, Zander R, Demoulin P, Chipperfield M P, Ruhnke R, Chiou L S, De Mazière M 2010 European Geosciences Union Vienna, Austria, May 2–7, 2010 p2420
[16] Zhou M, Vigouroux C, Langerock B, Wang P, Dutton G, Hermans C, Kumps N, Metzger J-M, Toon G, De Maziere M 2016 Atmos. Meas. Tech. 9 5621
 Google Scholar
[17] Polyakov A V, Timofeyev Y M, Virolainen Y A, Makarova M V, Poberovskii A V, Imhasin H K 2018 Izv. Atmos. Oceanic Phys. 54 487
 Google Scholar
[18] Rodgers C D 1990 J. Geophys. Res. Atmos. 95 5587
 Google Scholar
[19] Rodgers C D 2000 Inverse methods for atmospheric sounding: theory and practice (Vol. 2) (Singapore: World Scientific) p43
[20] Wiacek A, Taylor J R, Strong K, Saari R, Kerzenmacher T E, Jones N B, Griffith D W T 2007 J. Atmos. Oceanic Technol. 24 432
 Google Scholar
[21] Harrison J J 2015 Atmos. Meas. Tech. 8 3197
 Google Scholar
[22] Wang Z, Deutscher N M, Warneke T, Notholt J, Dils B, Griffith D, Schmidt M, Ramonet M, Gerbig C 2014 Atmos. Meas. Tech. 7 3295
 Google Scholar
[23] Polyakov A V, Virolainen Y A, Makarova M V 2019 J. Appl. Spectrosc. 86 449
 Google Scholar
[24] Mahieu E, Duchatelet P, Demoulin P, et al. 2008 Atmos. Chem. Phys. 8 6199
 Google Scholar
[25] Steffen J, Bernath P F, Boone C D 2019 J. Quant. Spectrosc. Radiat. Transfer 238 106619
 Google Scholar
-
表 1 反演参数与气体线强
Table 1. Retrieval parameters and line intensity.
目标气体 干扰气体 CCl2F2 H2O O3 CO2 线强/
(cm–1·(mol·cm–2))2.45
×10–206.01
×10–262.07
×10–253.11
×10–24波数/cm–1 923.08 923.07 923.02 922.91 表 2 误差分析中的参数不确定性
Table 2. Parameter uncertainties used in the error estimation.
参数 系统不确定性 随机不确定性 温度/K 5(对流层) 5(对流层) 5(平流层) 5(平流层) 太阳天顶角/(º) 0.025 0.025 零偏移 0.001 0.001 仪器线型/rad 0.01 0.01 视场角 0.01 0.01 线强参数/% 1 — 谱线压力展宽/% 1 — 表 3 CFC-12反演的系统误差和随机误差
Table 3. Systematic errors and random errors for CFC-12 retrieval.
误差 系统误差/% 随机误差/% 平滑误差 0.641 — 反演参数 0.001 — 测量误差 — 0.704 干扰气体 — 0.096 温度 0.123 0.724 太阳天顶角 0.019 0.019 零偏移 0.044 0.044 线强参数 0.378 — 谱线压力展宽 0.040 — 仪器线型 0.004 0.004 总误差 0.76 1.02 -
[1] 王凤, 张剑波, 冯金敏, 刘德英 2010 环境科学学报 30 1758
Wang F, Zhang J B, Feng J M, Liu D Y 2010 Acta Sci. Circum. 30 1758
[2] Molina M J, Rowland F S 1974 Nature 249 810
 Google Scholar
[3] Hansen J, Lacis A, Prather M 1989 J. Geophys. Res. Atmos. 94 16417
 Google Scholar
[4] Zurer P 1995 Chem. Eng. News 73 25
 Google Scholar
[5] Zhang F, Zhou L X, Yao B, Zhang X C, Xu L, Zhang X L, Zhou H G, Dong F, Zhou L Y 2011 Sci. Chin.-Earth Sci. 54 298
 Google Scholar
[6] Yang M M, Yang F C, Li H L, Li T, Cao F F, Nie X L, Zhen J B, Li P Y, Wang Y 2021 Sci. Total Environ. 754 142290
 Google Scholar
[7] 张芳, 王新明, 李龙凤, 易志刚, 周凌晞, 盛国英, 傅家谟 2006 地球与环境 34 19
Zhang F, Wang X M, Yi Z G, Li L F, Zhou L X, Donald R B, Sheng G Y, Fu J M 2006 Earth Environ. 34 19
[8] Zhang F, Zhou L, Yao B, Vollmer M K, Greally B R, Simmonds P G, Reimann S, Stordal F, Maione M, Xu L 2010 Atmos. Environ. 44 4454
 Google Scholar
[9] Tegtmeier S, Hegglin M I, Anderson J, Funke B, Gille J, Jones A, Smith L, von Clarmann T, Walker K A 2016 Earth Syst. Sci. Data 8 61
 Google Scholar
[10] Wang W, Tian Y, Liu C, Sun Y W, Liu W Q, Xie P H, Liu J G, Xu J, Morino I, Velazco V A, Griffith D T, Notholt J, Warneke T 2017 Atmos. Meas. Tech. 10 2627
 Google Scholar
[11] Yin H, Sun Y W, Liu C, Lu X, Smale D, Blumenstock T, Nagahama T, Wang W, Tian Y, Hu Q H, Shan C G, Zhang H F, Liu J G 2020 Opt. Express 28 8041
 Google Scholar
[12] 单昌功, 王薇, 刘诚, 徐兴伟, 孙友文, 田园, 刘文清 2017 66 220204
 Google Scholar
Shan C G, Wang W, Liu C, Xu X W, Sun Y W, Tian Y, Liu W Q 2017 Acta Phys. Sin. 66 220204
 Google Scholar
[13] 章惠芳, 王薇, 刘诚, 单昌功, 胡启后, 孙友文, Jones N 2020 光学学报 40 23
Zhang H F, Wang W, Liu C, Shan C G, Hu Q H, Sun Y W, Jones N 2020 Acta Optic. Sin. 40 23
[14] Notholt J 1994 Geophys. Res. Lett. 21 2385
 Google Scholar
[15] Mahieu E, Rinsland C P, Gardiner T, Zander R, Demoulin P, Chipperfield M P, Ruhnke R, Chiou L S, De Mazière M 2010 European Geosciences Union Vienna, Austria, May 2–7, 2010 p2420
[16] Zhou M, Vigouroux C, Langerock B, Wang P, Dutton G, Hermans C, Kumps N, Metzger J-M, Toon G, De Maziere M 2016 Atmos. Meas. Tech. 9 5621
 Google Scholar
[17] Polyakov A V, Timofeyev Y M, Virolainen Y A, Makarova M V, Poberovskii A V, Imhasin H K 2018 Izv. Atmos. Oceanic Phys. 54 487
 Google Scholar
[18] Rodgers C D 1990 J. Geophys. Res. Atmos. 95 5587
 Google Scholar
[19] Rodgers C D 2000 Inverse methods for atmospheric sounding: theory and practice (Vol. 2) (Singapore: World Scientific) p43
[20] Wiacek A, Taylor J R, Strong K, Saari R, Kerzenmacher T E, Jones N B, Griffith D W T 2007 J. Atmos. Oceanic Technol. 24 432
 Google Scholar
[21] Harrison J J 2015 Atmos. Meas. Tech. 8 3197
 Google Scholar
[22] Wang Z, Deutscher N M, Warneke T, Notholt J, Dils B, Griffith D, Schmidt M, Ramonet M, Gerbig C 2014 Atmos. Meas. Tech. 7 3295
 Google Scholar
[23] Polyakov A V, Virolainen Y A, Makarova M V 2019 J. Appl. Spectrosc. 86 449
 Google Scholar
[24] Mahieu E, Duchatelet P, Demoulin P, et al. 2008 Atmos. Chem. Phys. 8 6199
 Google Scholar
[25] Steffen J, Bernath P F, Boone C D 2019 J. Quant. Spectrosc. Radiat. Transfer 238 106619
 Google Scholar
计量
- 文章访问数: 8570
- PDF下载量: 106
- 被引次数: 0


 下载:
下载:


