


-
Fluid simulations of capacitively coupled plasmas (CCPs) are crucial for understanding their discharge physics, yet the high computational cost results in a major bottleneck. To overcome this limitation, we develop a deep learning-based surrogate model to replicate the output of a one-dimensional CCP fluid model with near-instantaneous inference speed. Through a systematic evaluation of three architectures, i.e. feedforward neural network (FNN), attention-enhanced long short-term memory network (ALSTM), and convolutional-transformer hybrid network (CTransformer) it is found that the sequence-structured ALSTM model can achieve the optimal balance between speed and accuracy, with an overall prediction error of only 1.73% for electron density, electric field, and electron temperature in argon discharge. This study not only achieves significant simulation acceleration but also reveals that the model can accurately extrapolate from low-pressure conditions dominated by complex non-local effects to high-pressure conditions governed by simple local behavior, whereas the reverse extrapolation fails. This finding suggests that training under low-pressure conditions enables the model to capture more comprehensive physical features. From the perspective of model weights, both low-pressure and high-pressure models assign important weights to the sheath region. However, the low-pressure model exhibits higher weight peaks in the sheath, indicating stronger ability to capture the essential physics of sheath dynamics. In contrast, the high-pressure model, because of its lower weighting in the sheath region, may fail to adequately resolve complex sheath dynamics when predicting under new operating conditions, thereby limiting its extrapolation capability with high fidelity. To ensure the reliability of this data-driven model in practical applications, we establish a trust boundary with a normalized mean absolute spatial error of 5% for model performance through systematic extrapolation experiments. When the model's extrapolation error falls below this threshold, the spatial distribution curves of predicted parameters such as electron density and electron temperature closely match the true physical distributions. However, once the error exceeds this critical point, systematic deviations such as morphological distortion and amplitude discrepancies begin to appear in the predicted spatial distributions, significantly deviating from the true physical laws. In the future, we will develop neural network models capable of processing high-dimensional spatial data and combining multi-dimensional input features such as various discharge gases, ultimately realizing a dedicated AI model for the field of capacitively coupled plasmas.
[1] Kim H C, Iza F, Yang S S, Radmilović-Radjenović M, Lee J K 2005 J. Phys. D: Appl. Phys. 38 R283
 Google Scholar
[2] Wang X C, Zhang Y T 2023 J. Appl. Phys. 133 143301
Google Scholar
[3] Zhang Y T, Gao S H, Zhu Y Y 2023 J. Appl. Phys. 133 053303
Google Scholar
[4] Sethi S P, Das D P, Behera S K 2023 IEEE Trans. Plasma Sci. 51 1434
Google Scholar
[5] Kim B, Im S, Yoo G 2021 Electronics 10 49
[6] Xiao T Q, Wu Z, Christofides P D, Armaou A, Ni D 2021 Ind. Eng. Chem. Res. 61 638
[7] Liau L C K, Huang C J, Chen C C, Huang C S, Chen T, Lin S C, Kuo L C 2002 Sol. Energy Mater. Sol. Cells 71 169
Google Scholar
[8] Pan J, Liu Y, Zhang S, Hu X C, Liu Y D, Shao T 2023 Energy Convers. Manage. 277 116620
Google Scholar
[9] Wan C G, Yu Z, Wang F, Liu X J, Li J G 2021 Nucl. Fusion 61 066015
Google Scholar
[10] Yang Y, Yang S, Li C, Yu Z H 2021 IEEE Access 9 67232
Google Scholar
[11] Borghei M, Ghassemi M 2022 IEEE Trans. Dielectr. Electr. Insul. 29 319
Google Scholar
[12] Seo J, Kim S, Jalalvand A, Conlin R, Rothstein A, Abbate J, Erickson K, Wai J, Shousha R, Kolemen E 2024 Nature 626 746
Google Scholar
[13] Dave B, Patel S, Shivani R, Purohit S, Chaudhury B 2022 Contrib. Plasma Phys. 63 e202200051
[14] Marvin M, Seymour P 1969 MIT Press 6 318
[15] Riedmiller M 1994 Computer Standards & Interfaces 16 265
[16] Krizhevsky A, Sutskever I, Hinton G E 2012 Proceedings of the 26th International Conference on Neural Information Processing Systems Lake Tahoe, USA, December 3–6, 2012 p1097
[17] Elman J L 1990 Cognitive Science 14 179
Google Scholar
[18] Hpchreiter S, Schmidhuber J 1997 Neural Computation 9 1735
Google Scholar
[19] Vaswani A, Shazeer N, Parmar N, Uszkoreit J, Jones L, Gomez A N, Kaiser Ł, Polosukhin 2017 Proceedings of the 31st International Conference on Neural Information Processing Systems Long Beach, USA, December 4–9, 2017 p6000
[20] Liu Z M, Wang Y X, Vaidya S, Ruehle F, Halverson J, Soljačić M, Hou Y T, Tegmark M 2024 2404.19756v5[cs.LG]
[21] Von R L, Maryer S, Beckh K, Georgiev B, Giesselbach S, Heese R, Kirsch B, Pfrommer J, Pick A, Ramamurthy R, Walczak M, Garcke J, Bauckhage C, Schuecker J. 2021 IEEE Trans. Knowl. Data Eng. 35 614
[22] Willard J, Jia X, Xu S M, Steinbach M and Kumar V 2020 arXiv: 2003.04919v6[physics.comp-ph]
[23] Basir S 2022 arXiv: 2209.09988v3[cs.LG]
[24] Luo X, Yuan S Y, Tang H W, Xu D, Ran Q H, Cen Y H, Ling D F 2024 Hydrol. Processes 38 e15143
Google Scholar
[25] Li J, Wu X, Li Z 2025 Appl. Ocean Res. 161 104661
Google Scholar
[26] Guo Y, Li L, Xiang Z, Gui J, Shi S, Lei Z, Xu X 2025 Atomic Energy Science and Technology 59 1085
[27] Li W K, Zhang Y T 2025 J. Appl. Phys. 137 203304
Google Scholar
[28] Noh H, Lee J, Yoon E 2025 J. Comput. Phys. 523 113665
Google Scholar
[29] Shi H Y, Wang S, Wang P Y 2024 J. Environ. Chem. Eng. 12 112998
Google Scholar
[30] Marcus G 2018 arXiv: 1801.00631v1[cs.AI]
[31] Battaglia P W, Hamrick J B, Bapst V, Sanchez-Gonzalez A, Zambaldi V, Malinowski M, Tacchetti A, Raposo D, Santoro A, Faulkner R, Gulcehre C, Song F, Ballard A, Gilmer J, Dahl G, Vaswani A, Allen K, Nash C, Langston V, Dyer C, Heess N, Wierstra D, Kohli P, Botvinick M, Vinyals O, Li Y, Pascanu R 2018 arXiv: 1806.01261v3[cs.LG]
[32] Xu K, Zhang M, Li J, Du S S, Kawarabayashi K I, Jegelka S 2020 arXiv: 2009.11848v5[cs.LG]
[33] Wu Y, Zhu Z, Liu F, Chrysos G, Cevher V 2022 Advances in Neural Information Processing Systems 35 26980
[34] Hestness J, Narang S, Ardalani N, Diamos G, Jun H, Kianinejad H, Patwary M M A, Yang Y, Zhou Y Q 2017 arXiv: 1712.00409v1[cs.LG]
[35] Manzhos S, Ihara M 2023 J. Phys. Chem. A 127 7823
Google Scholar
[36] Jain S, Wallace B C 2019 arXiv: 1902.10186v3[cs.CL]
[37] Donko Z, Derzsi A, Vass M, Horvth B, Wilczek S, Horvath B, Hartmann P 2021 Plasma Sources Sci. Technol. 30 095017
Google Scholar
[38] Jia W Z, Zhang Q Z, Wang X F, Song Y H, Wang Y N 2019 J. Phys. D: Appl. Phys. 52 015206
Google Scholar
-
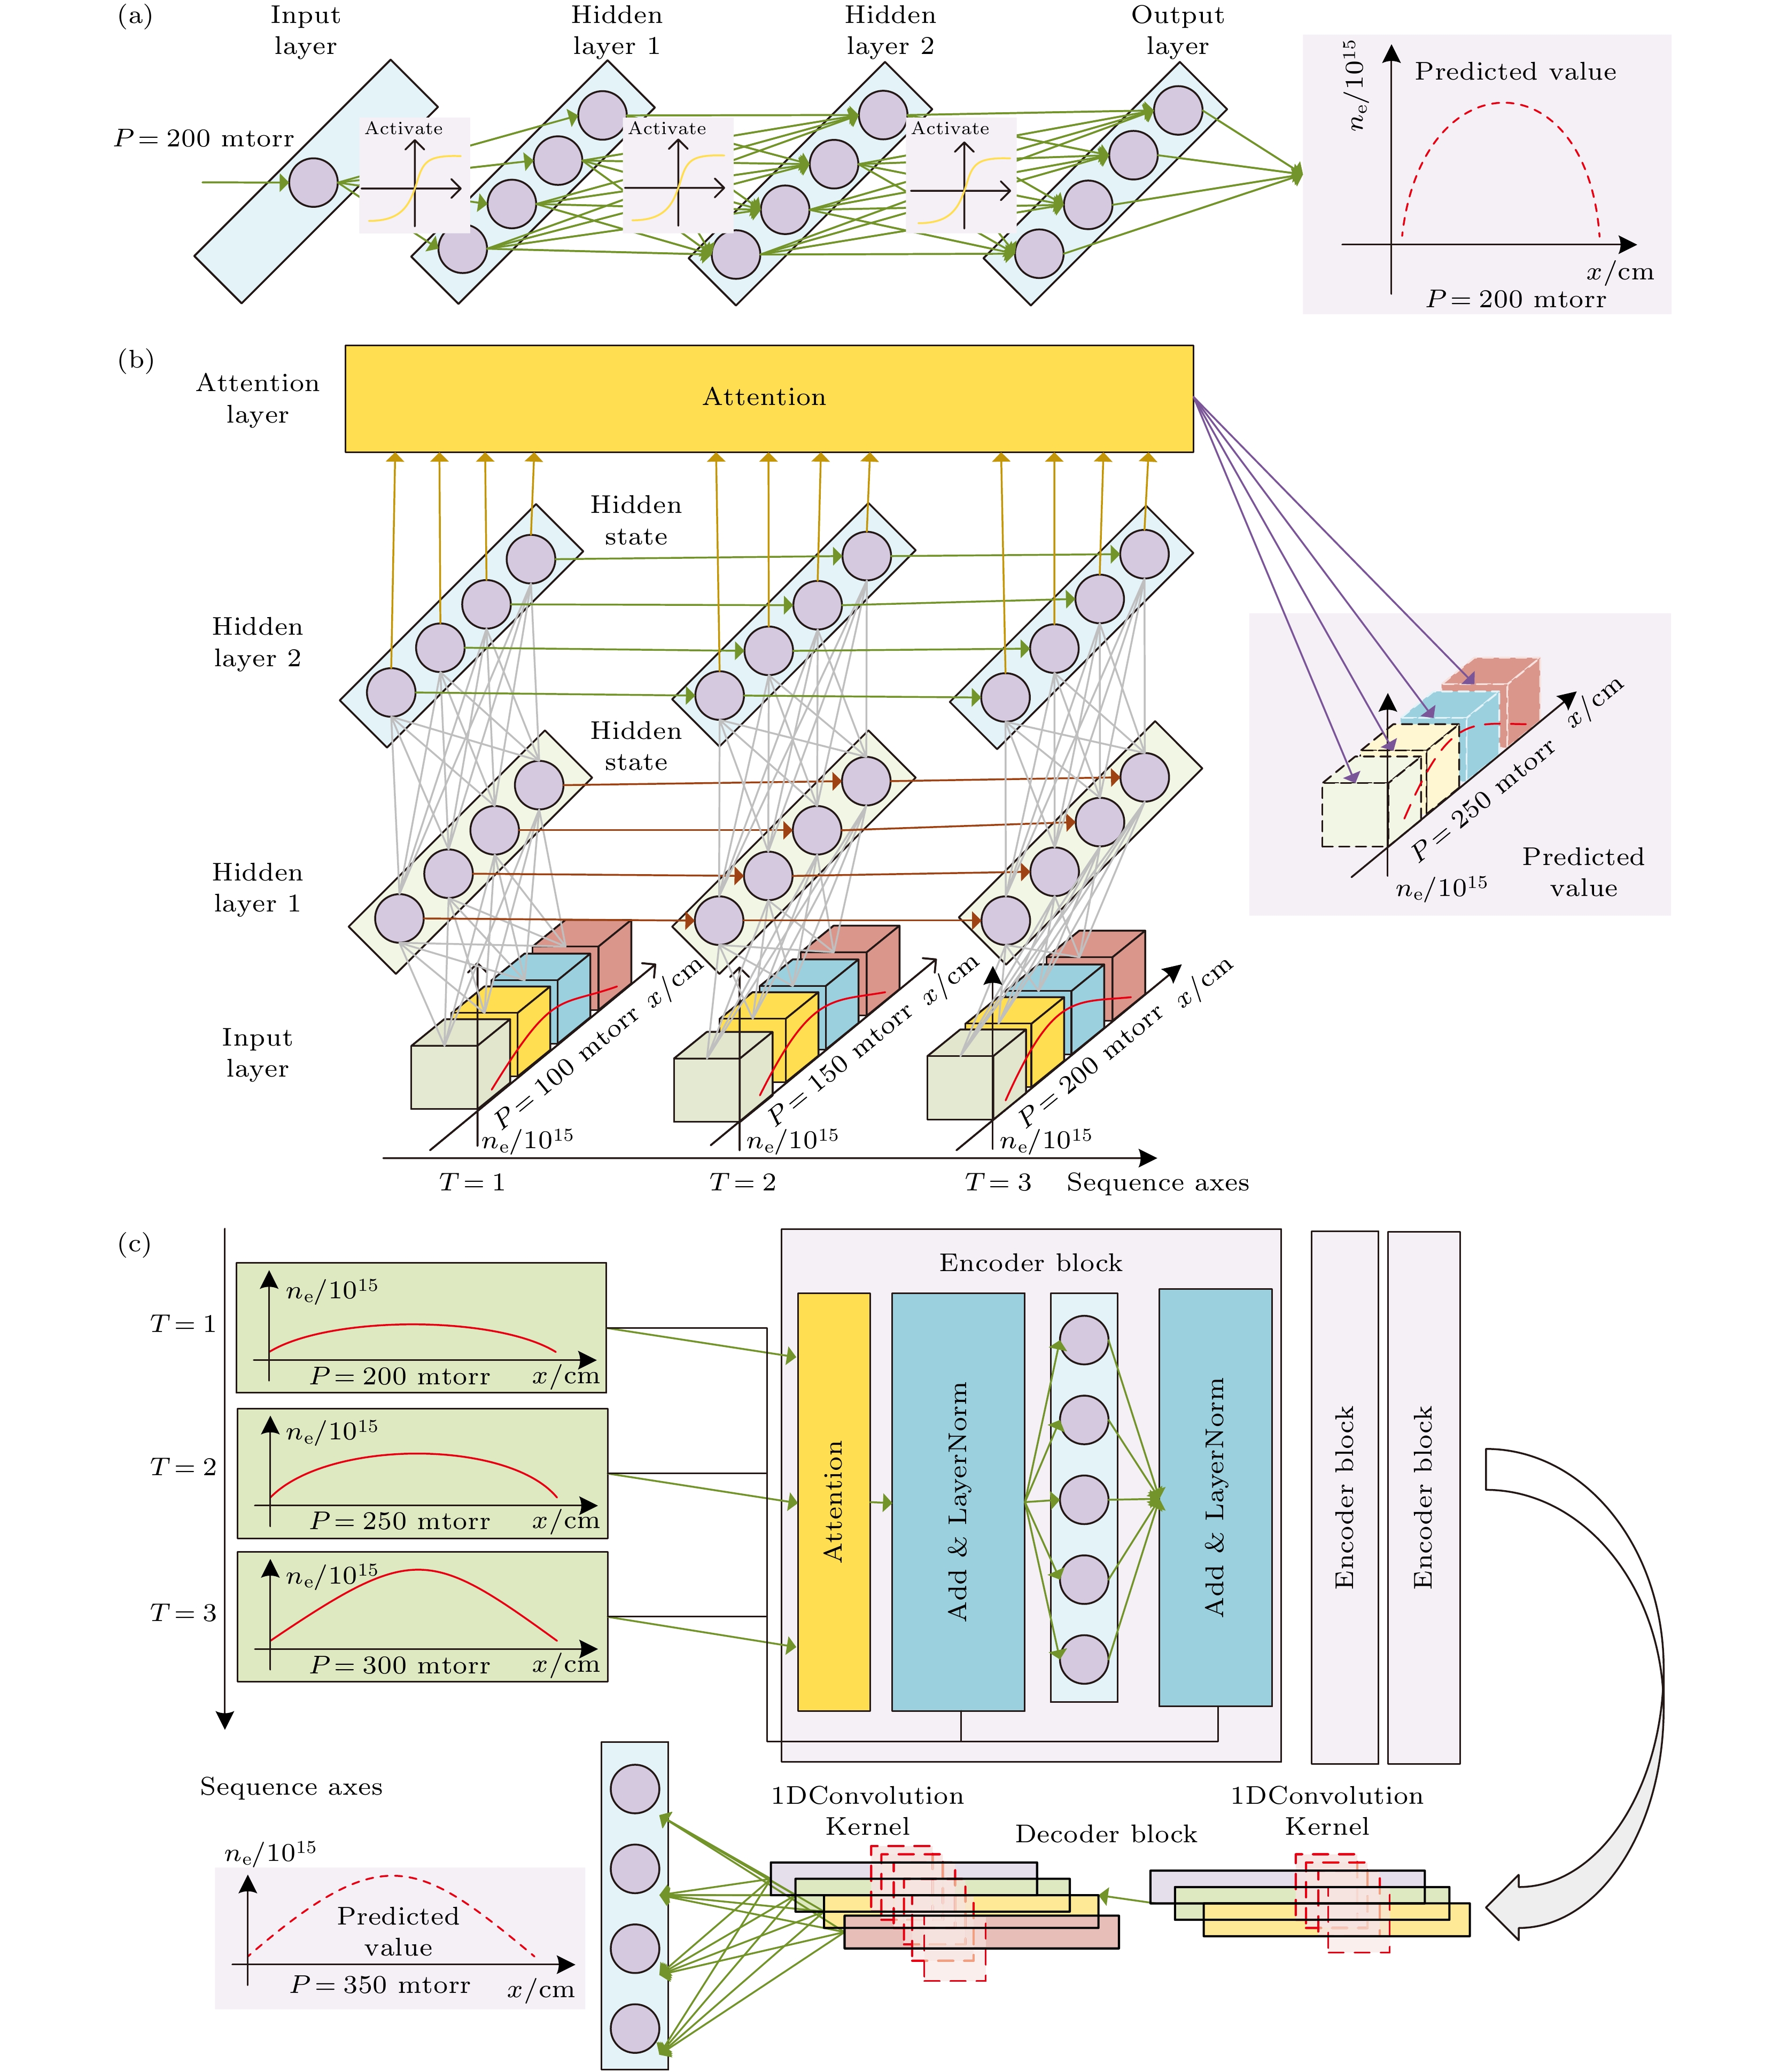
图 1 神经网络架构示意图 (a) 前馈神经网络(FNN)结构; (b) 注意力增强型长短期记忆网络(ALSTM)结构, 将等离子体状态演化视为序列预测任务; (c) 卷积-Transformer混合网络(CTransformer)结构, 采用Transformer编码器与CNN解码器架构
Figure 1. Schematic of the neural network architectures: (a) Feedforward neural network (FNN) structure; (b) attention-enhanced long short-termmemory (ALSTM) structure, which treats plasma state evolution as a sequence prediction task; (c) hybrid convolutional-transformer (CTransformer) structure, employing a Transformer encoder and a CNN decoder.
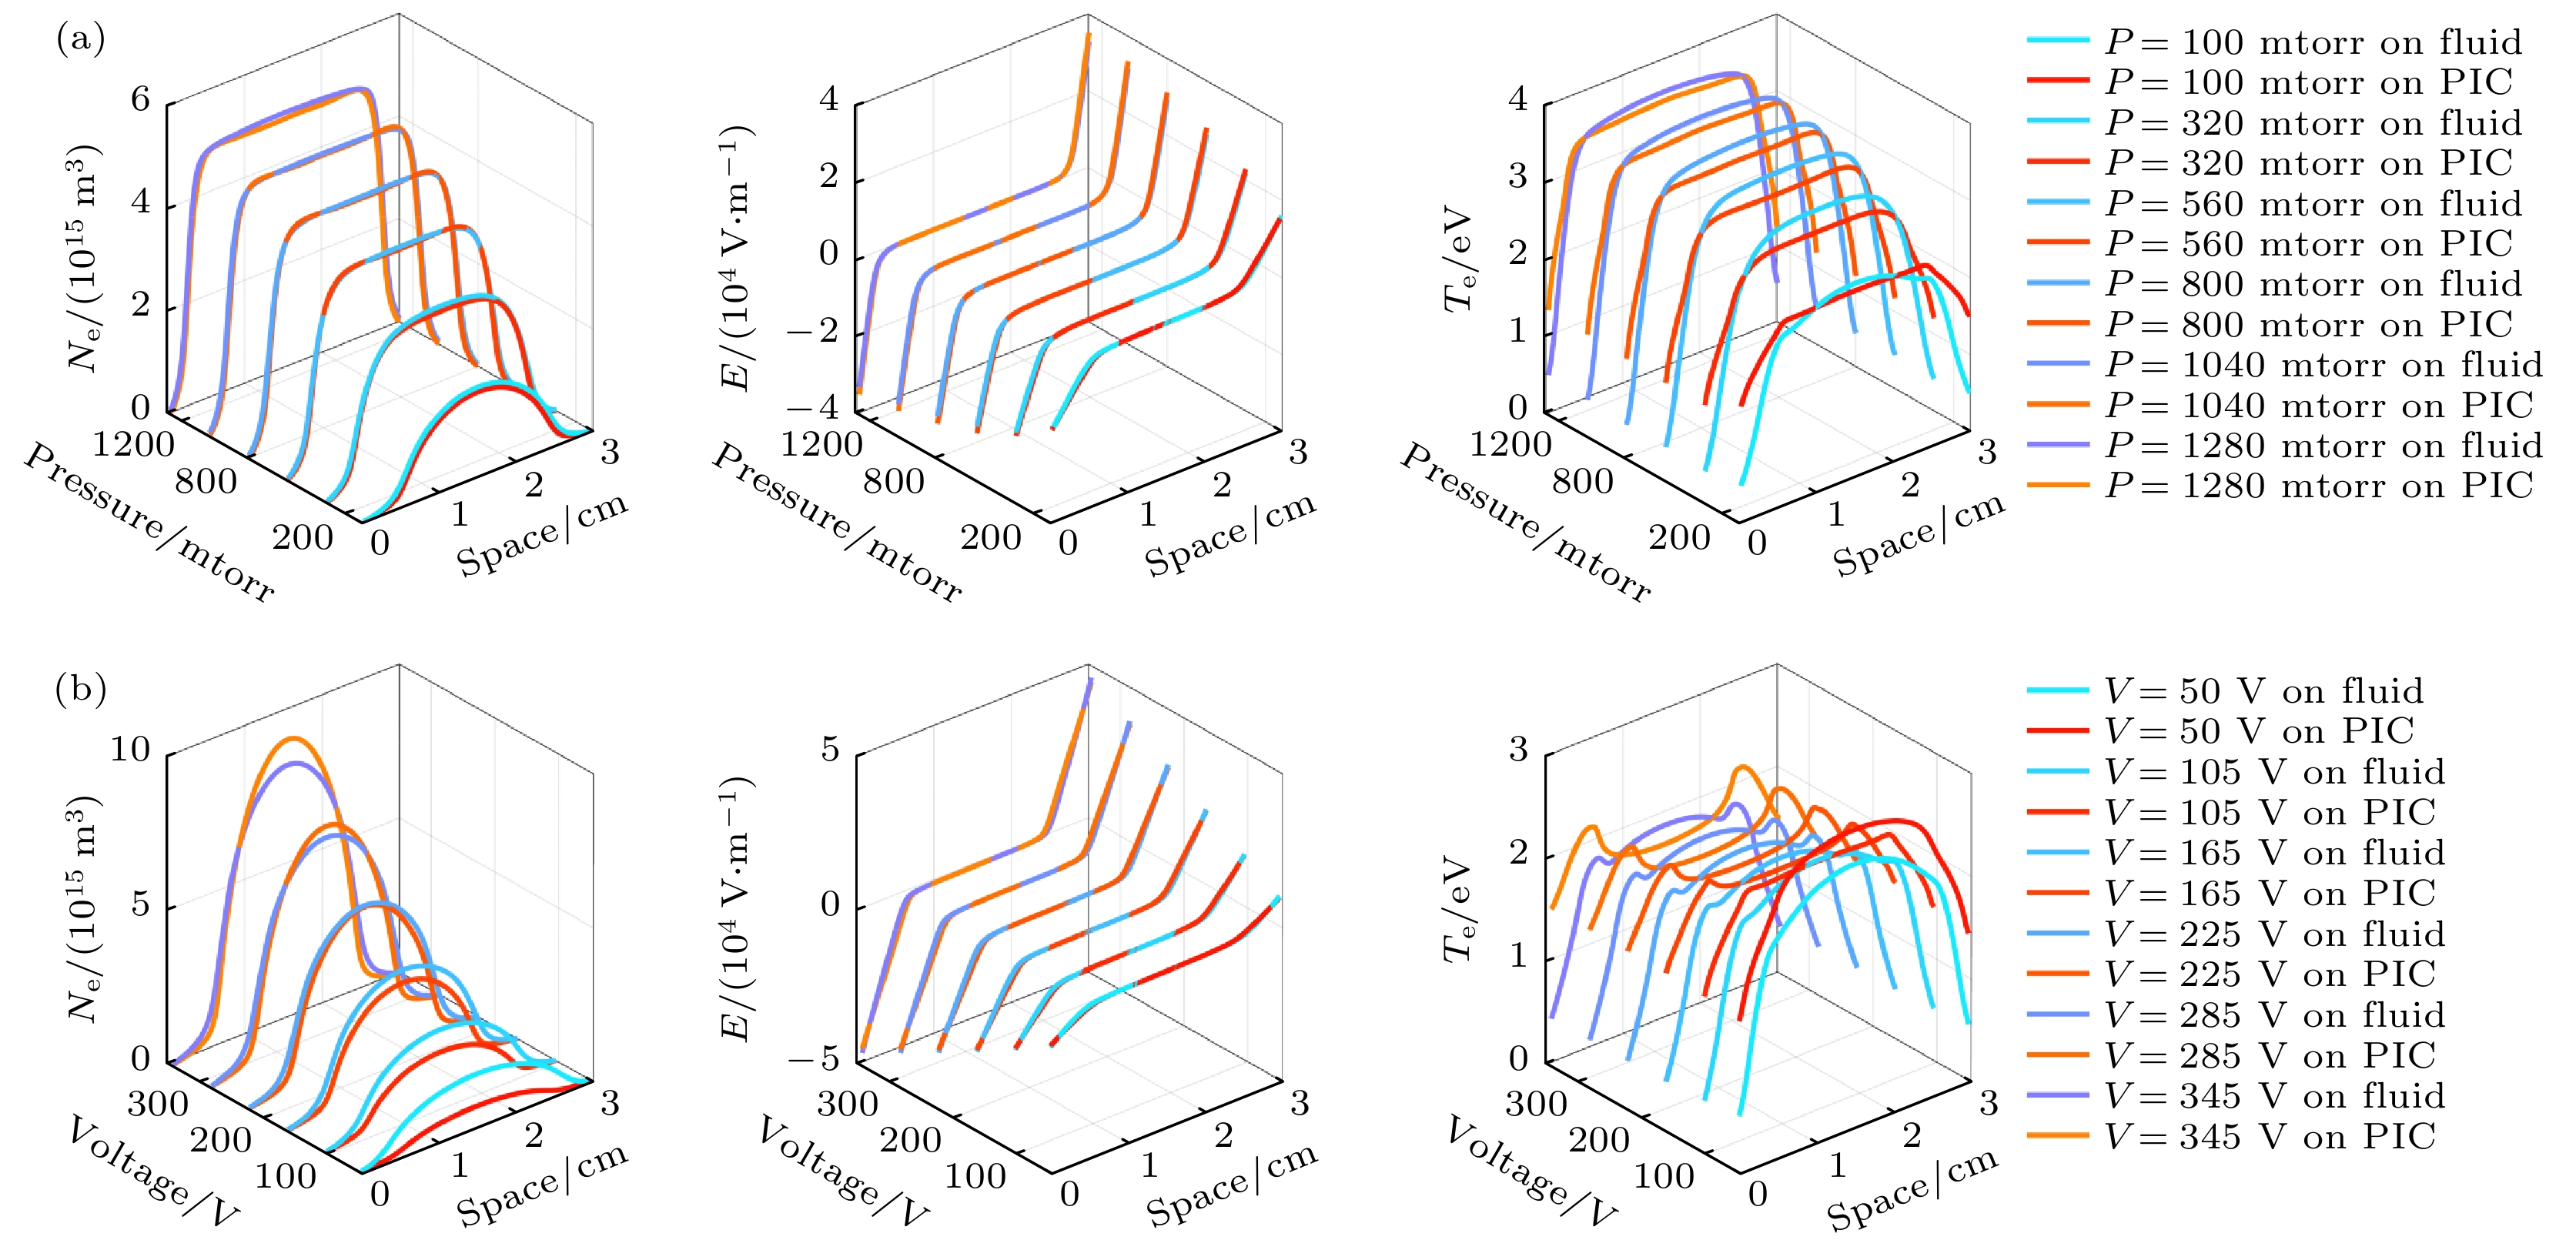
图 2 (a)和(b)分别展示了不同气压和电压下, 时间平均电子密度、电场以及电子温度的轴向空间分布, 红色系为流体模型仿真结果, 蓝色系为PIC模型仿真结果
Figure 2. Time-averaged spatial profiles of electron density, electric field, and temperature under scans of (a) gas pressure and (b) driving voltage, used for dataset generation. The red-colored series represents fluid model simulation results, while the blue-colored series represents PIC model results.
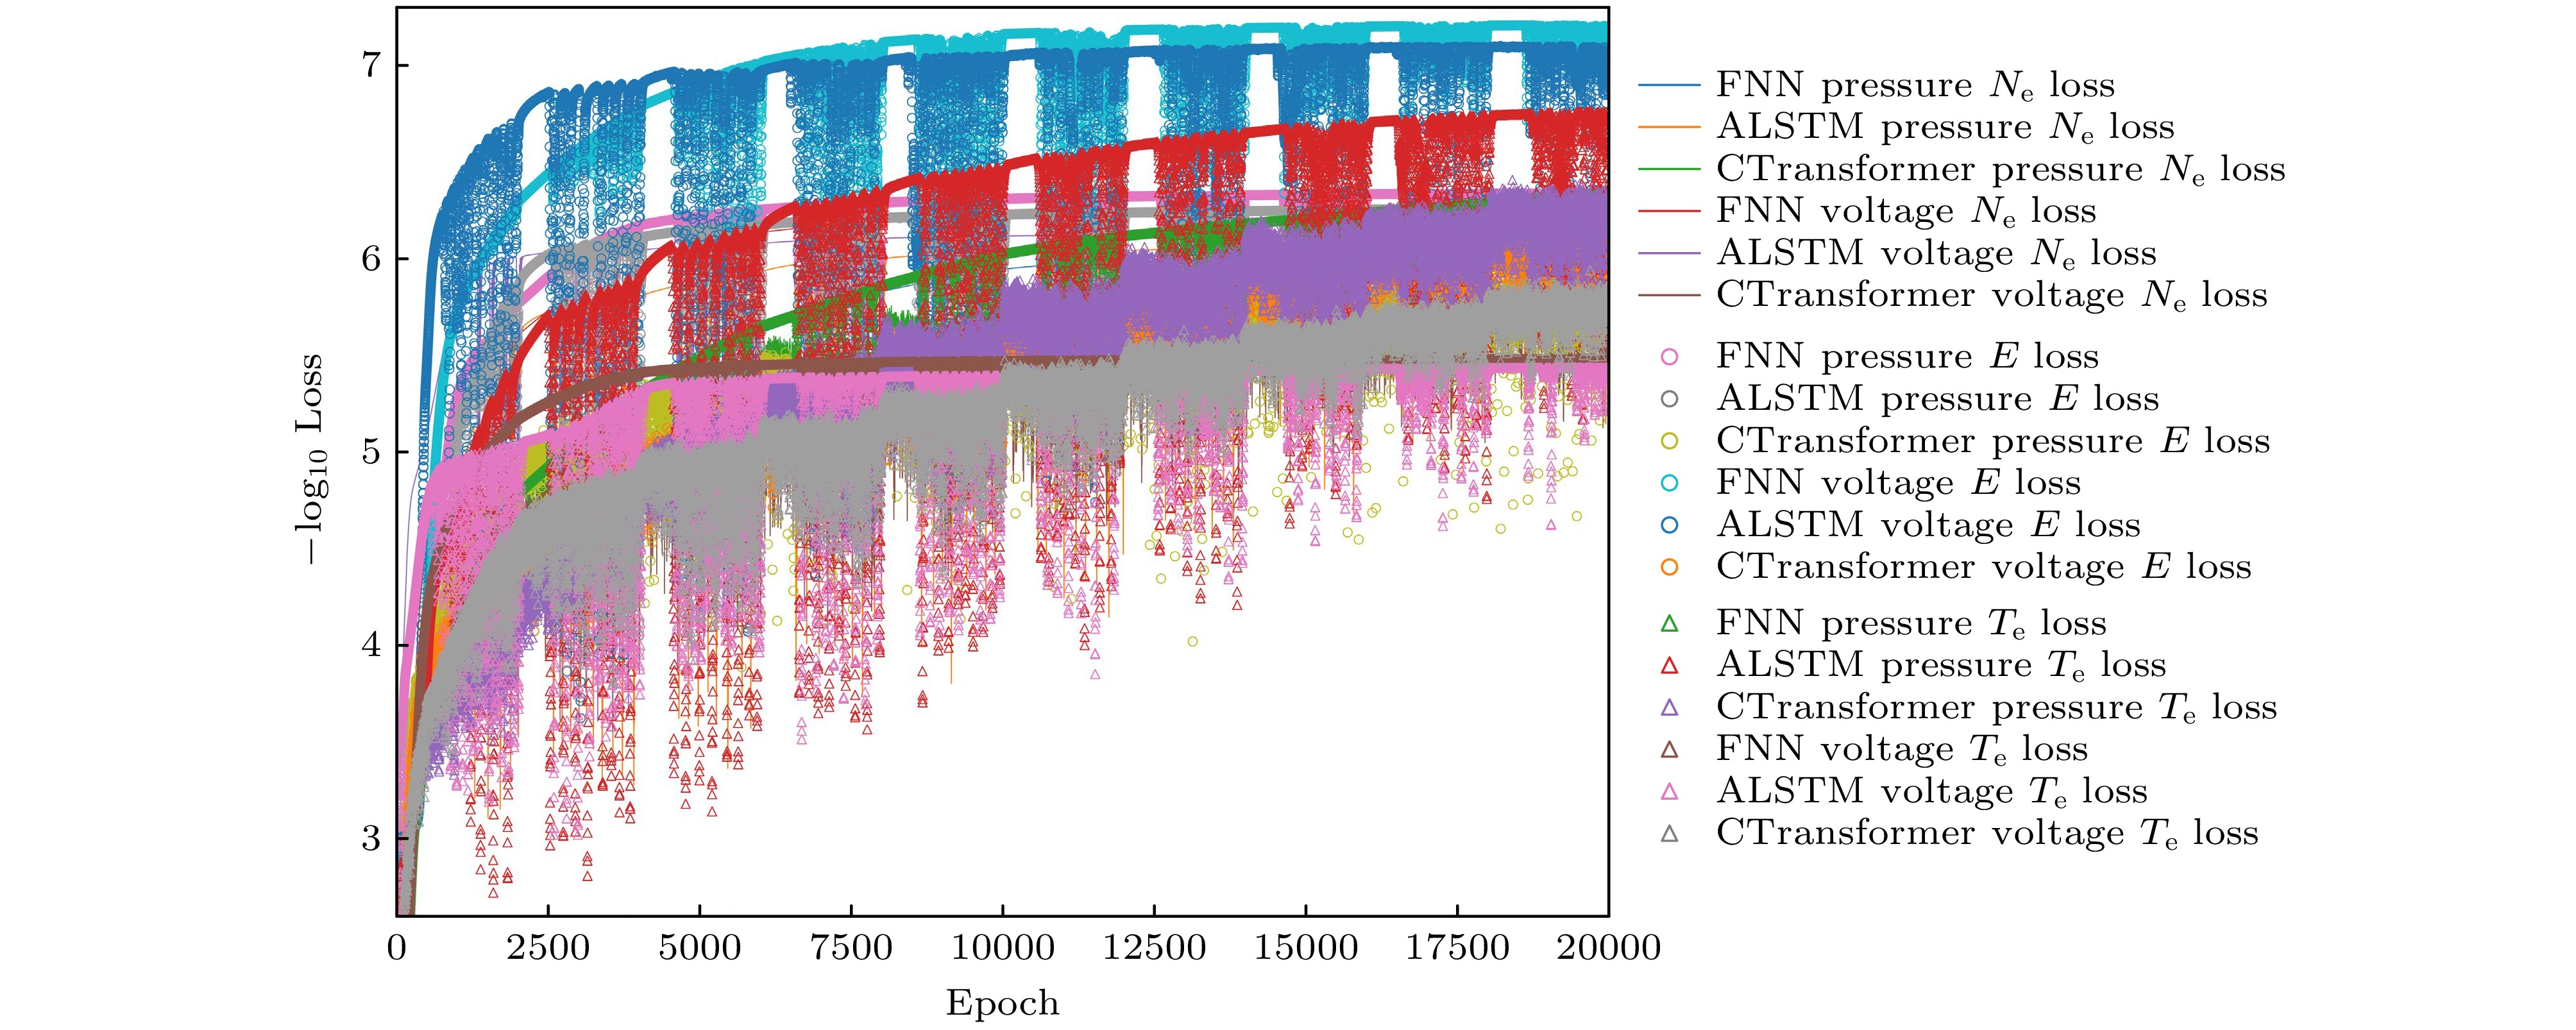
图 3 FNN, ALSTM与CTransformer模型对电子密度($ n_{\mathrm{e}} $)、电场(E )和电子温度($ T_{\mathrm{e}} $)在气压和电压数据集上的训练损失收敛曲线, 其中损失代表了模型的误差情况. 横轴代表训练迭代次数(number of iterations), 纵轴表示损失的负对数值($ -\log_{10} \text{Loss} $)
Figure 3. Convergence curves of training loss for the FNN, ALSTM, and CTransformer models on the electron density ($ n_{\mathrm{e}} $), electric field (E ), and electron temperature ($ T_{\mathrm{e}} $) datasets, where the loss values reflect the models' error performance. The horizontal axis represents the number of training iterations. The vertical axis represents the negative logarithm of the loss ($ -\log_{10} \text{Loss} $).
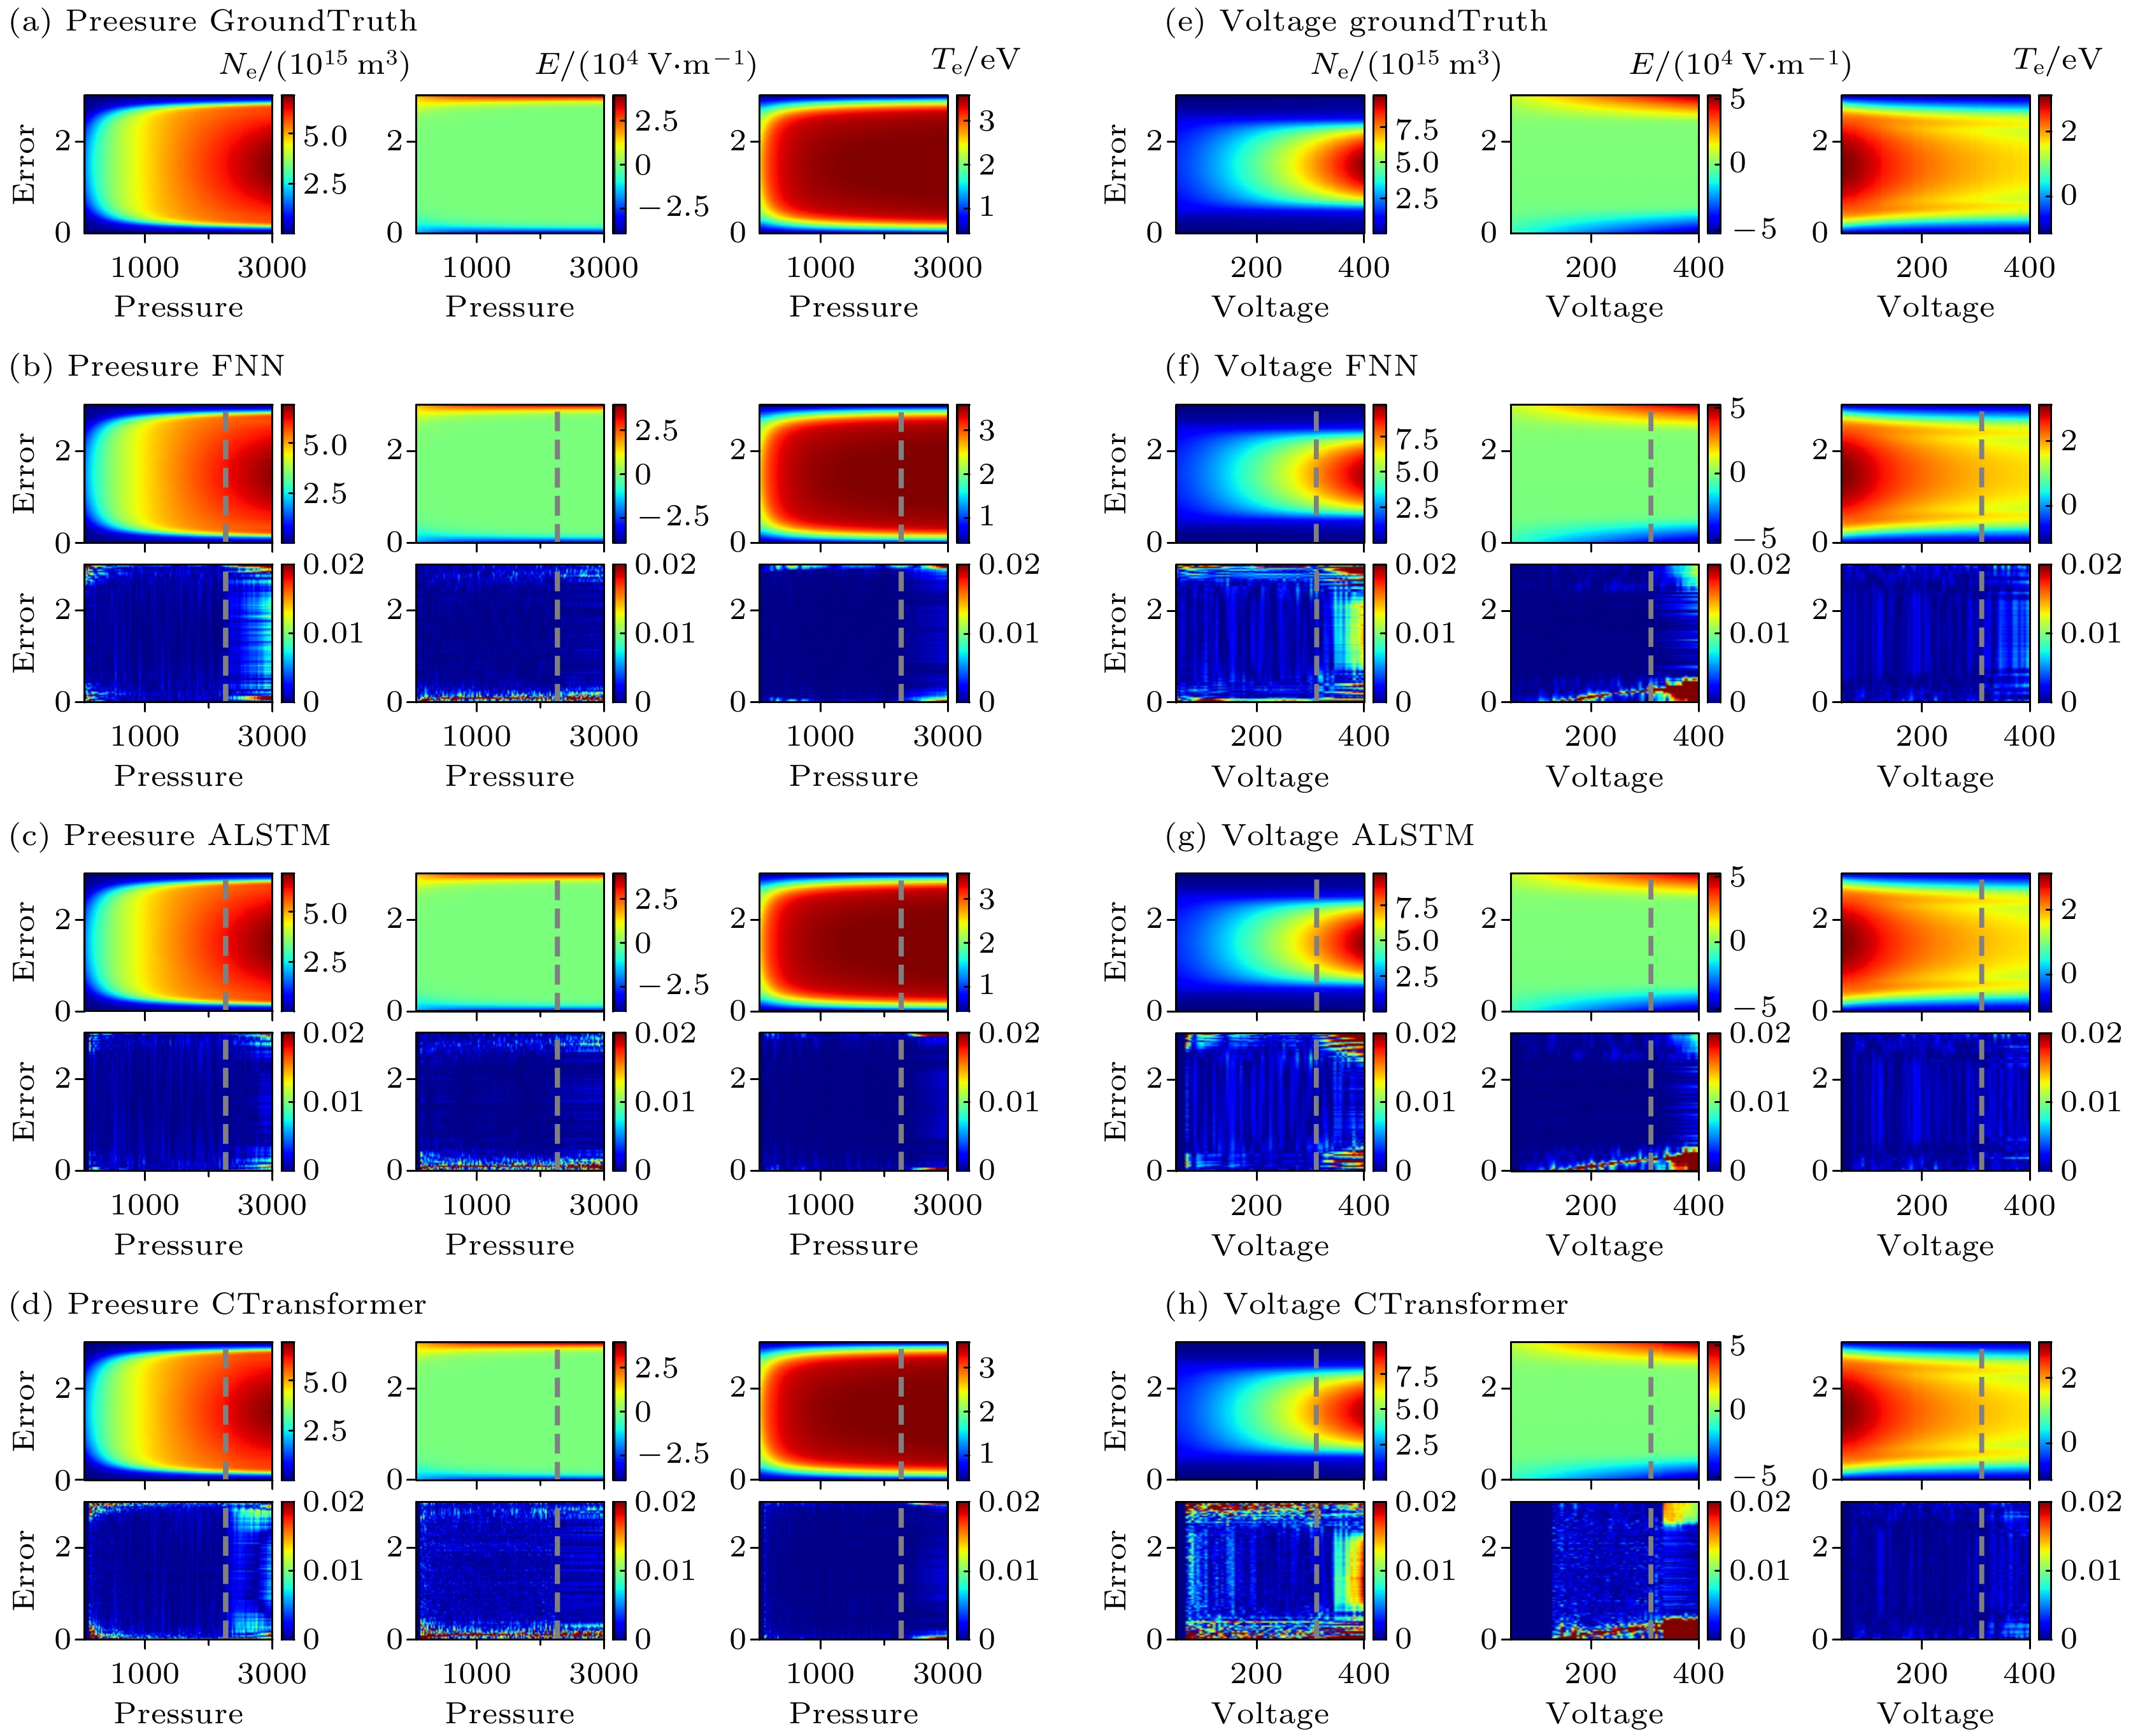
图 4 时间平均的电子密度、电场和温度的空间分布 (a), (e) 显示了流体/MC模拟的真实值; FNN ((b), (f))、ALSTM ((c), (g))和CTransformer ((d), (h))模型的预测结果与真实值在不同气压(左列, (b)—(d))和电压(右列, (f)—(h))条件下的对比. 各模型的子图中均展示了预测结果及其归一化绝对误差(NAE)分布. 垂直虚线将训练数据(左侧)与测试数据(右侧)分隔开来
Figure 4. Time-averaged spatial profiles of electron density, electric field, and temperature. Panels (a), (e) show the ground truth from a fluid/MC simulation. Predictions from the FNN ((b), (f)), ALSTM ((c), (g)), and CTransformer ((d), (h)) models are compared against the ground truth under varying pressure (left columns, (b)–(d)) and voltage (right columns, (f)–(h)). Each panel for the models shows the prediction and its normalized absolute error (NAE) distribution. The vertical dashed line separates the training data (left) from the test data (right).
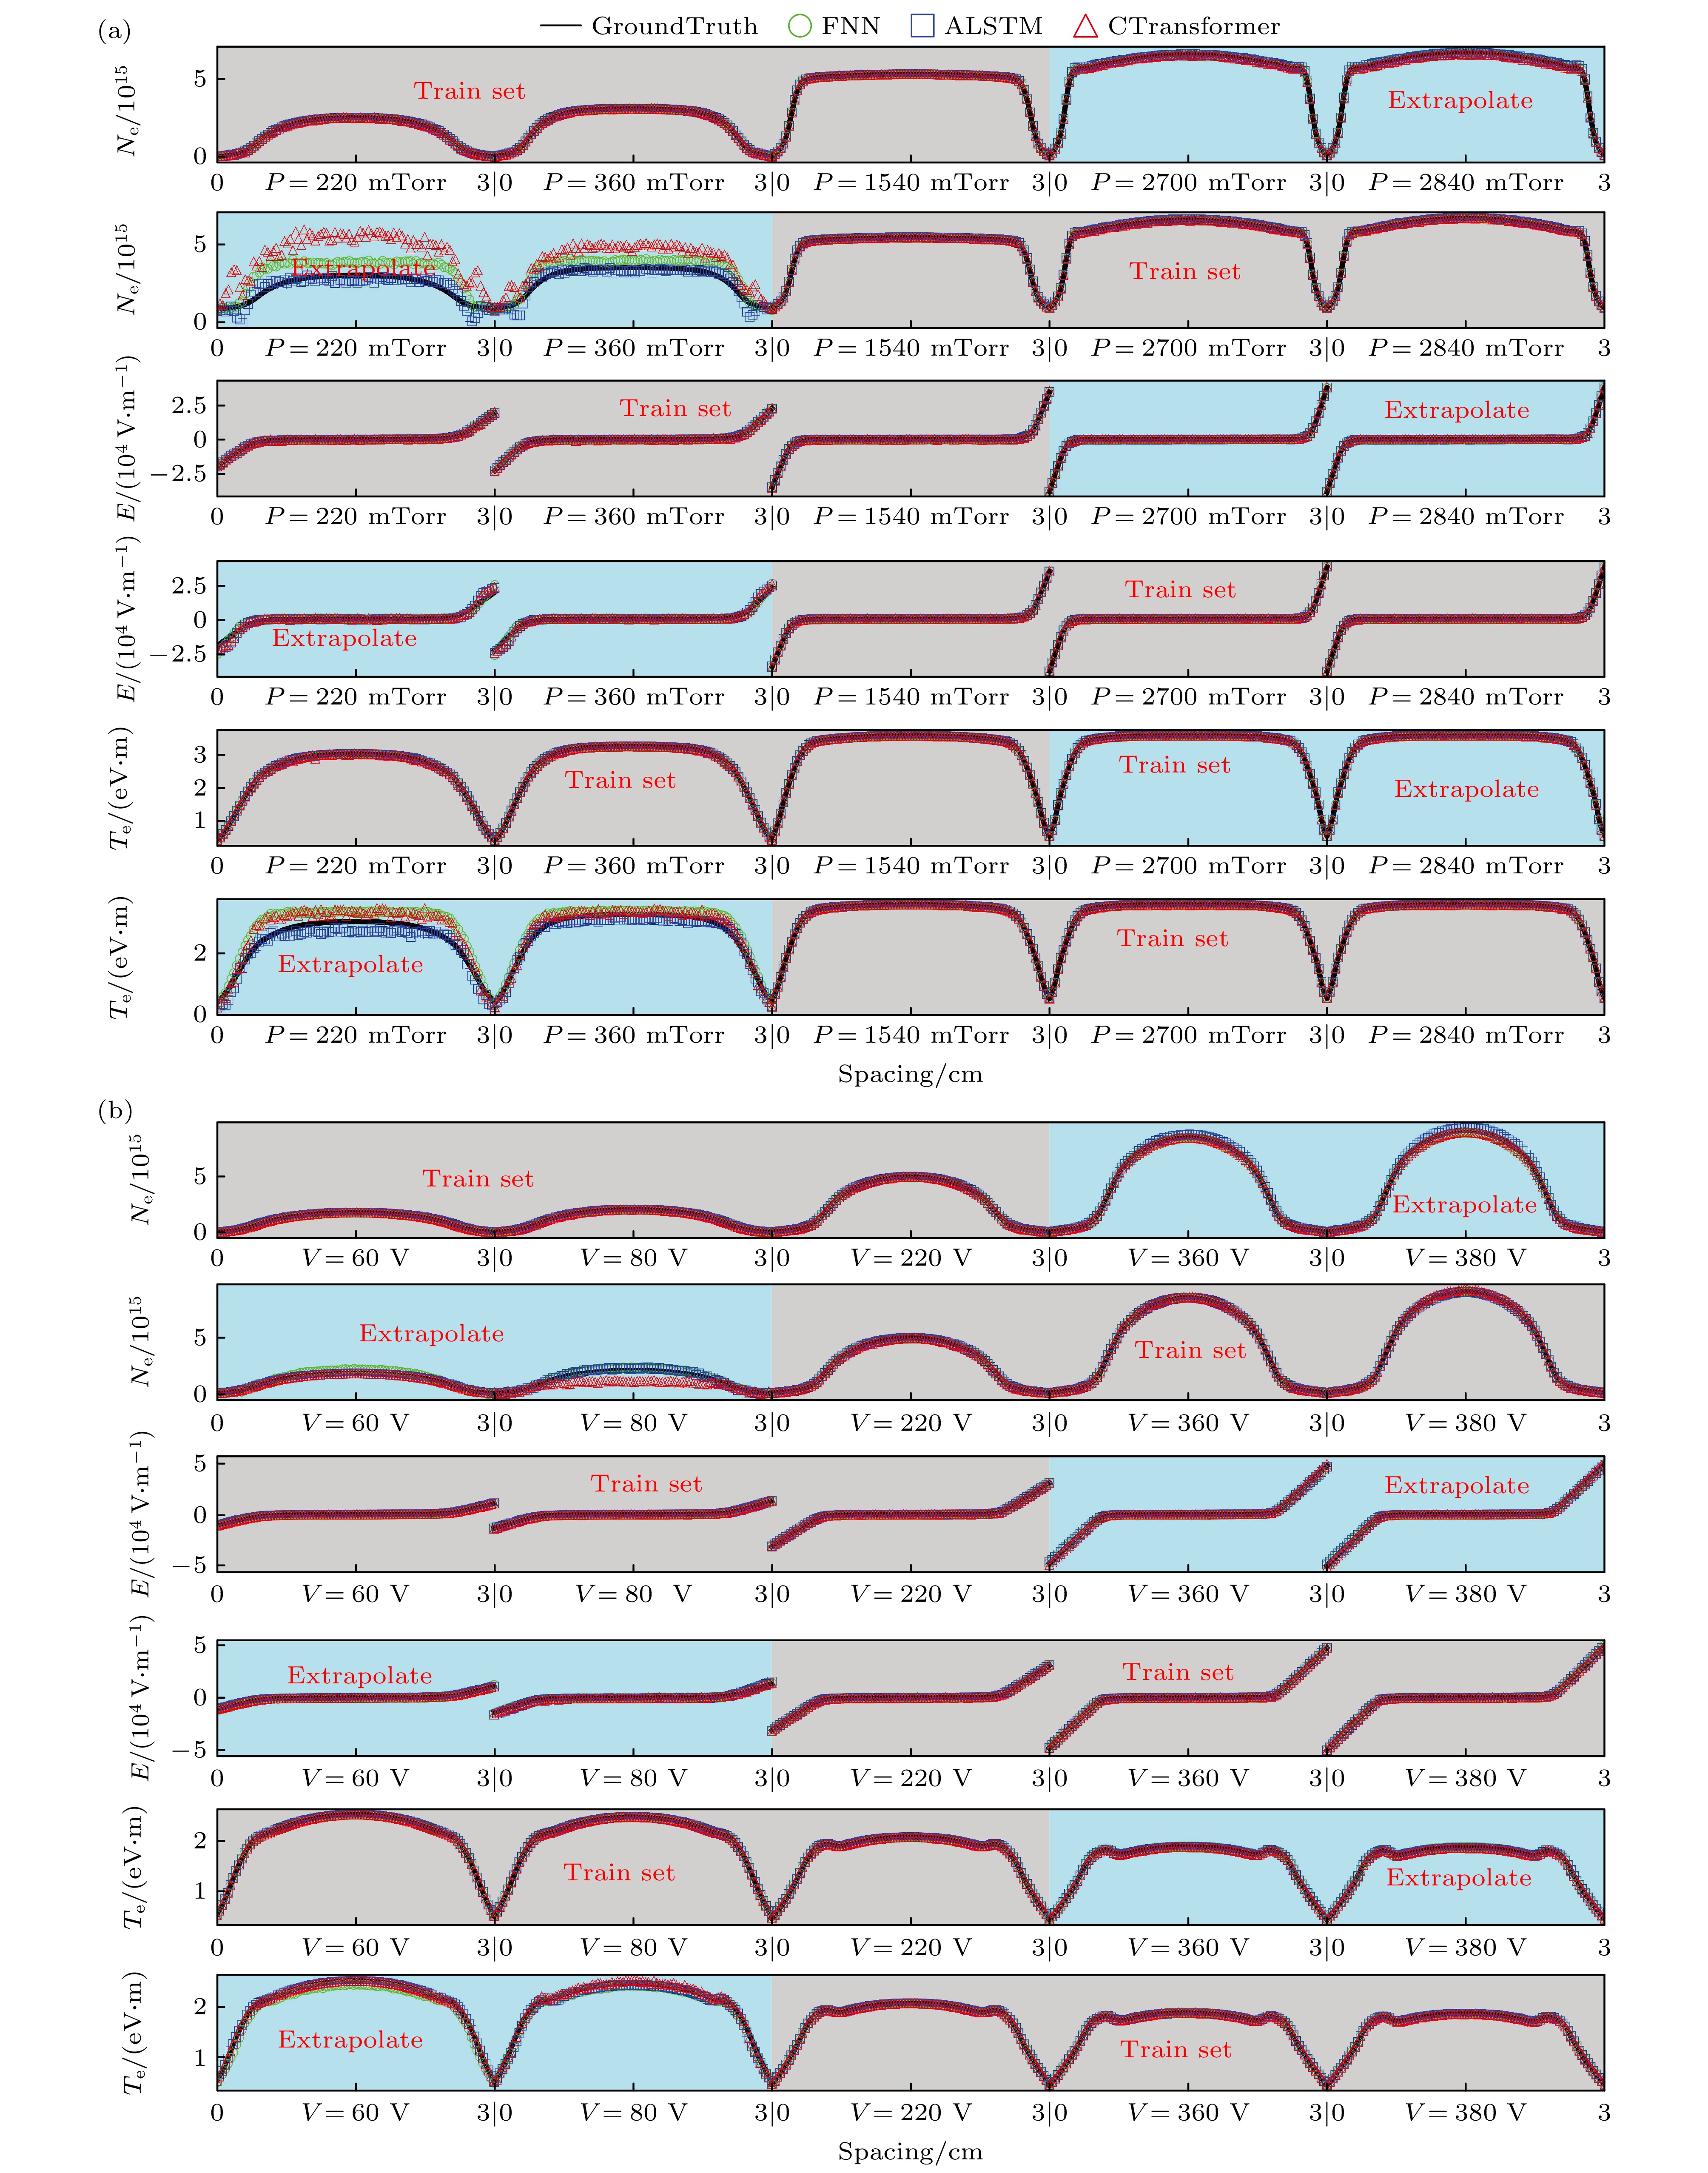
图 5 FNN, ALSTM 和 CTransformer 模型在(a)气压数据集和(b)电压数据集上对电子密度、电场和电子温度的时间平均空间分布的外推性能(极板间距为0—3 cm). 蓝色阴影区域表示外推集, 灰色阴影区域表示训练集
Figure 5. Extrapolation performance of FNN, ALSTM, and CTransformer for time-averaged spatial profiles of electron density, electric field, electron temperature on (a) the pressure set and (b) the voltage set(Electrode spacing is 0–3 cm). The blue-shaded area represents the extrapolation set, while the gray-shaded area is the training set.
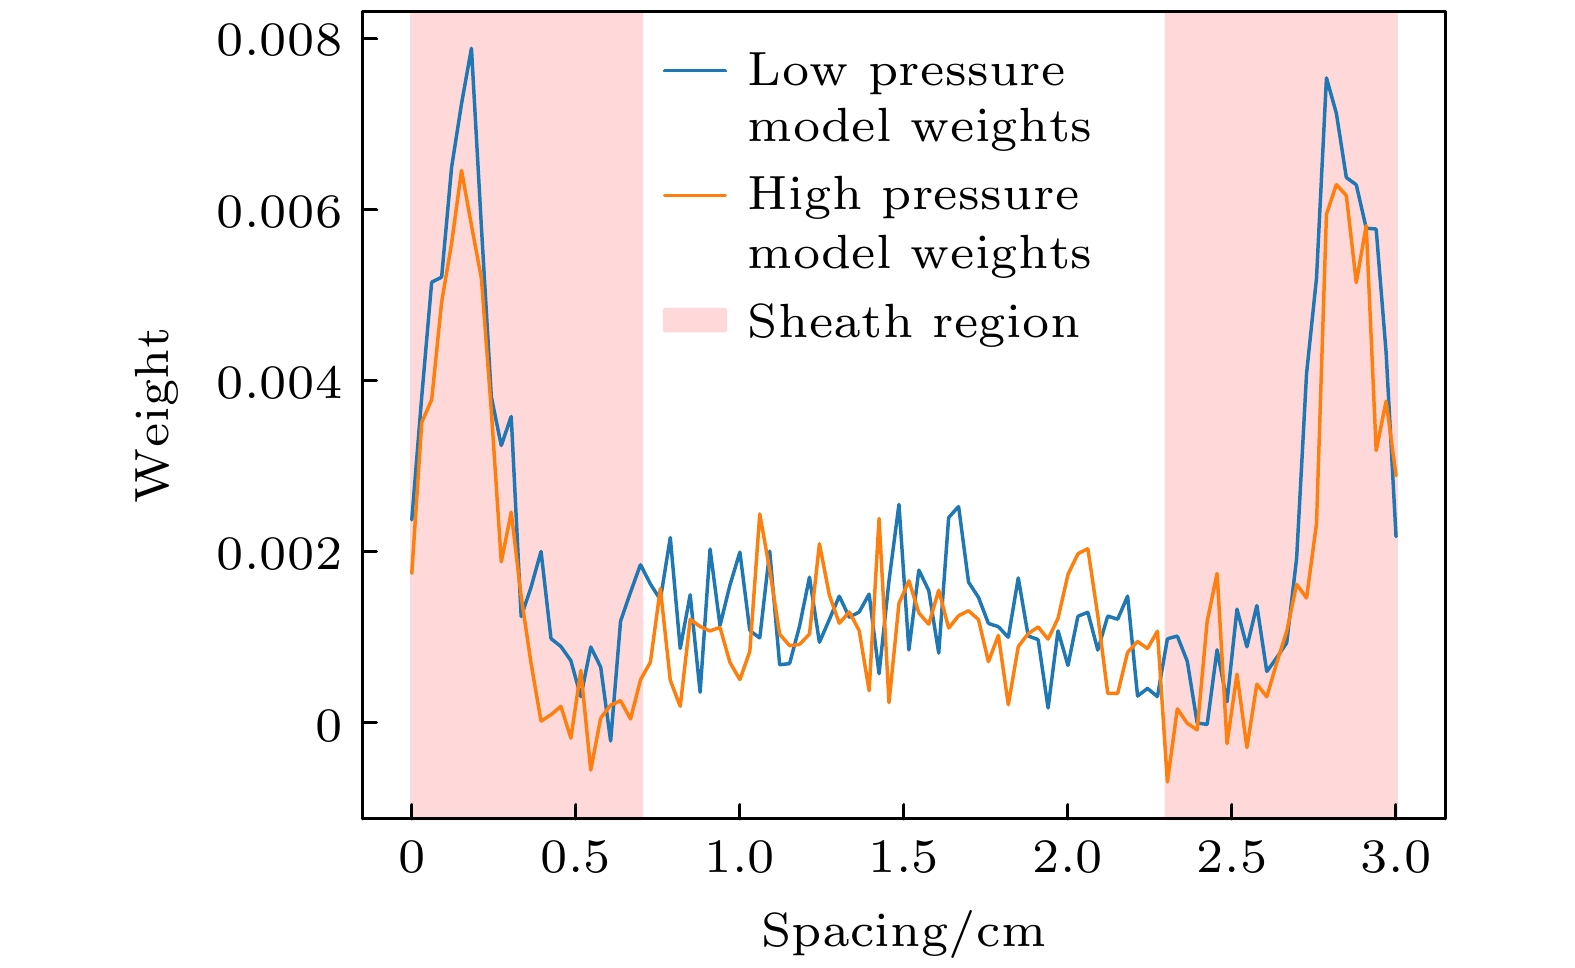
图 6 ALSTM的输入层权重分布图, 其中蓝线和黄线分别为基于低气压和高气压数据训练的ALSTM模型的输入层权重分布, 红色区域为鞘层权重分布
Figure 6. The weight distribution map of the input layer for the ALSTM model, where the blue and yellow lines represent the input layer weight distributions of the ALSTM models trained using low-pressure and high-pressure data, respectively, with the red region indicating the sheath layer weight distribution.
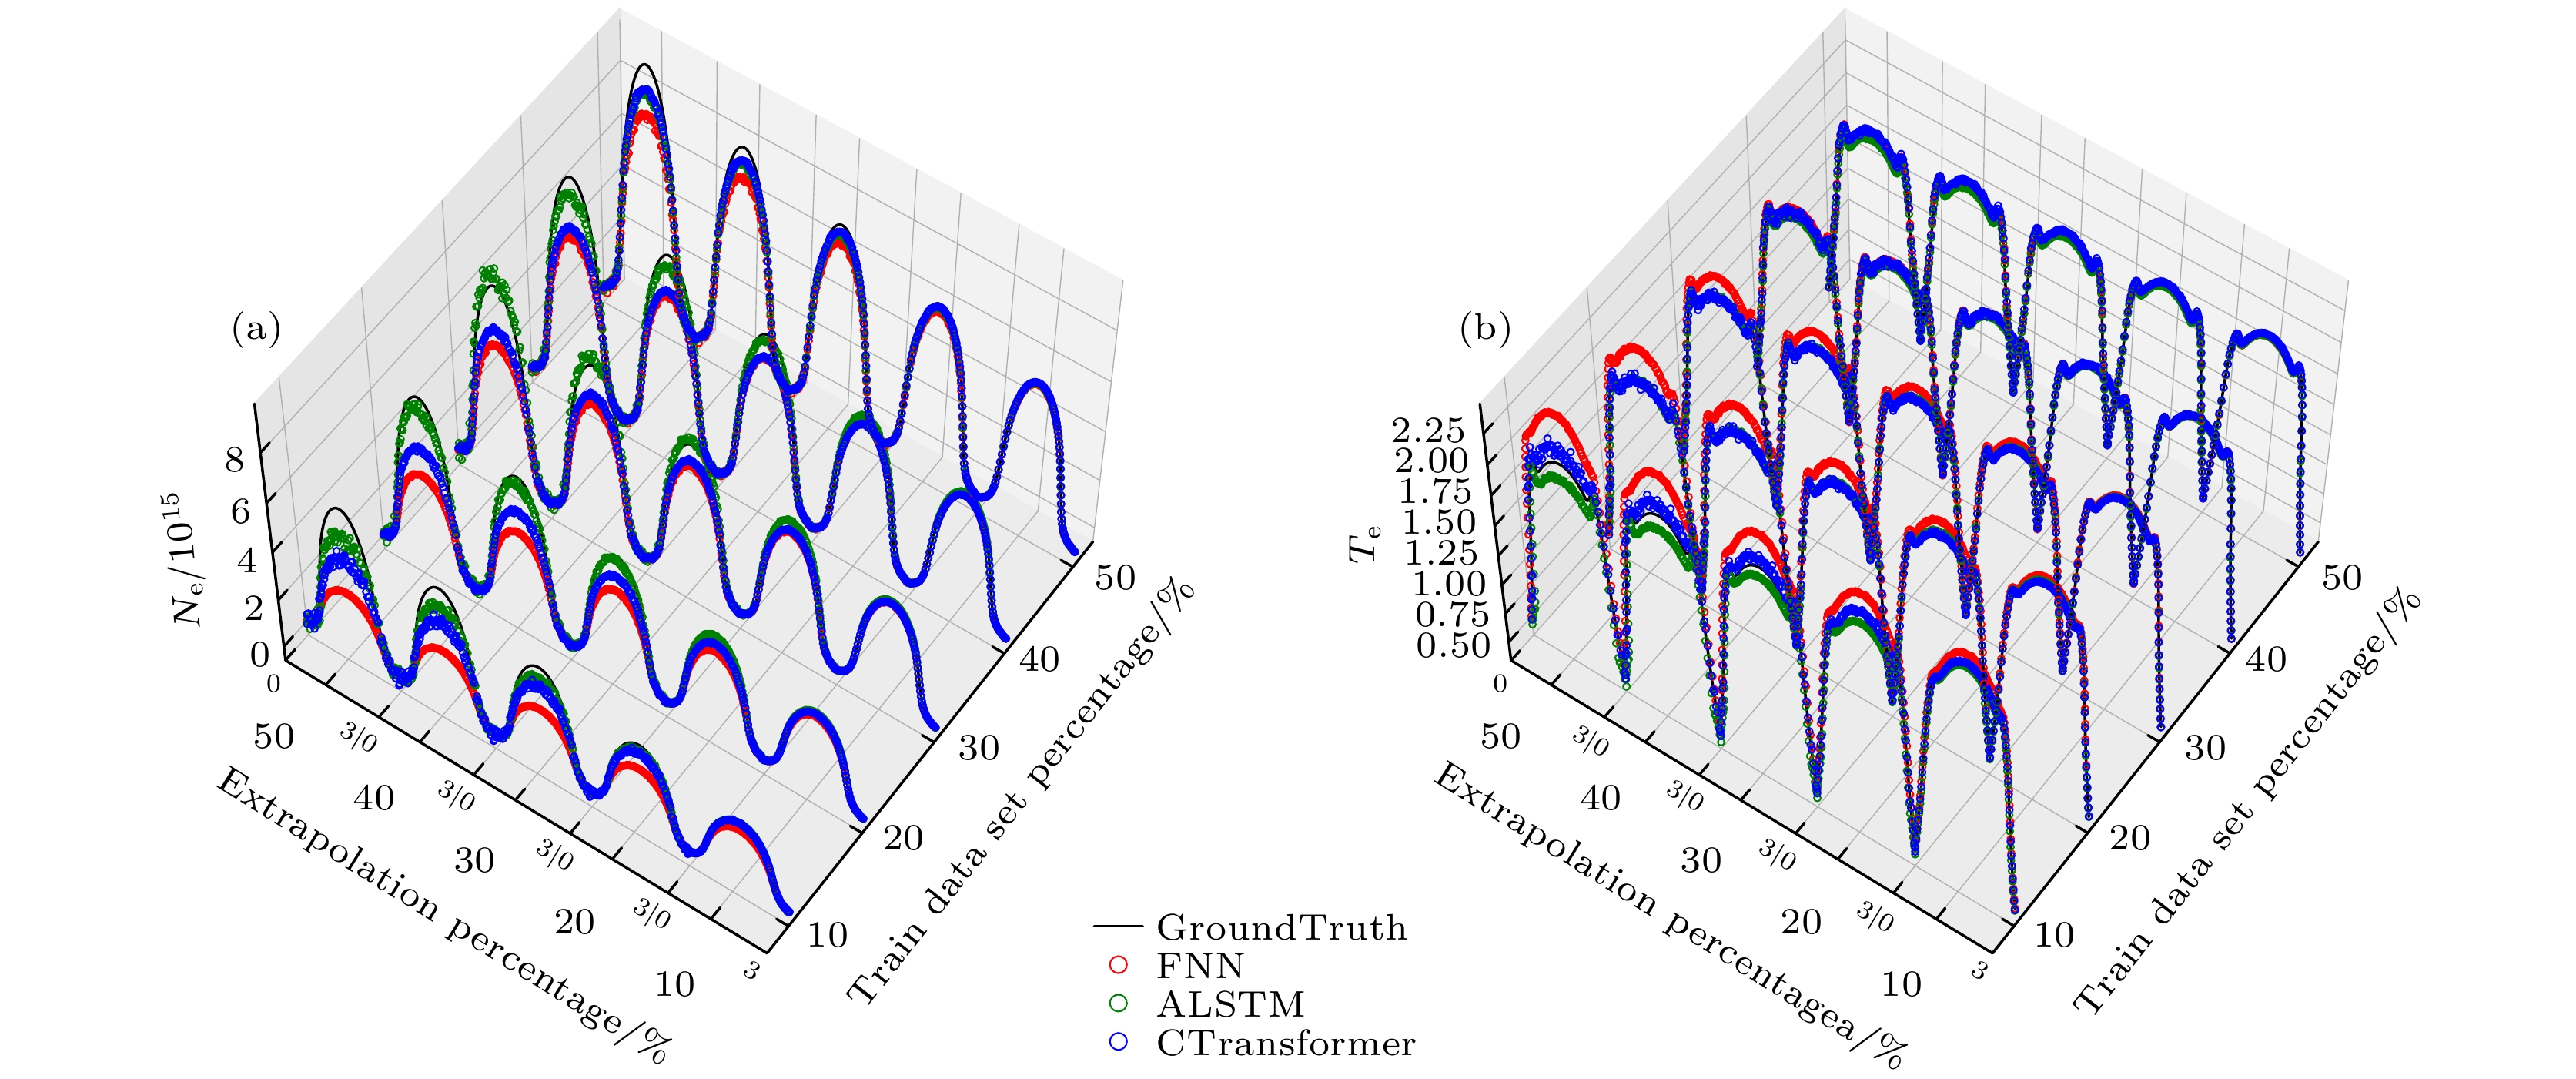
图 7 FNN、ALSTM和CTransformer模型在不同电压数据集(总电压范围50—400 V的10%—50%子集)上训练时在不同外推距离下预测的电子密度(a)和电子温度(b)空间分布. 而外推距离是指从各自训练集边界开始计算的总电压参数范围的10%, 20%, 30%, 40%和50%. GroundTruth是指流体模拟的数据
Figure 7. Spatial distributions of electron density (a) and electron temperature (b) predicted by FNN, ALSTM, and CTransformer models at different extrapolation distances when trained on distinct voltage datasets (10%–50% subsets of the total voltage range 50–400 V). These extrapolation distances correspond to 10%, 20%, 30%, 40%, and 50% of the total voltage parameter range calculated from the respective training set boundaries. GroundTruth refers to data from fluid simulations.
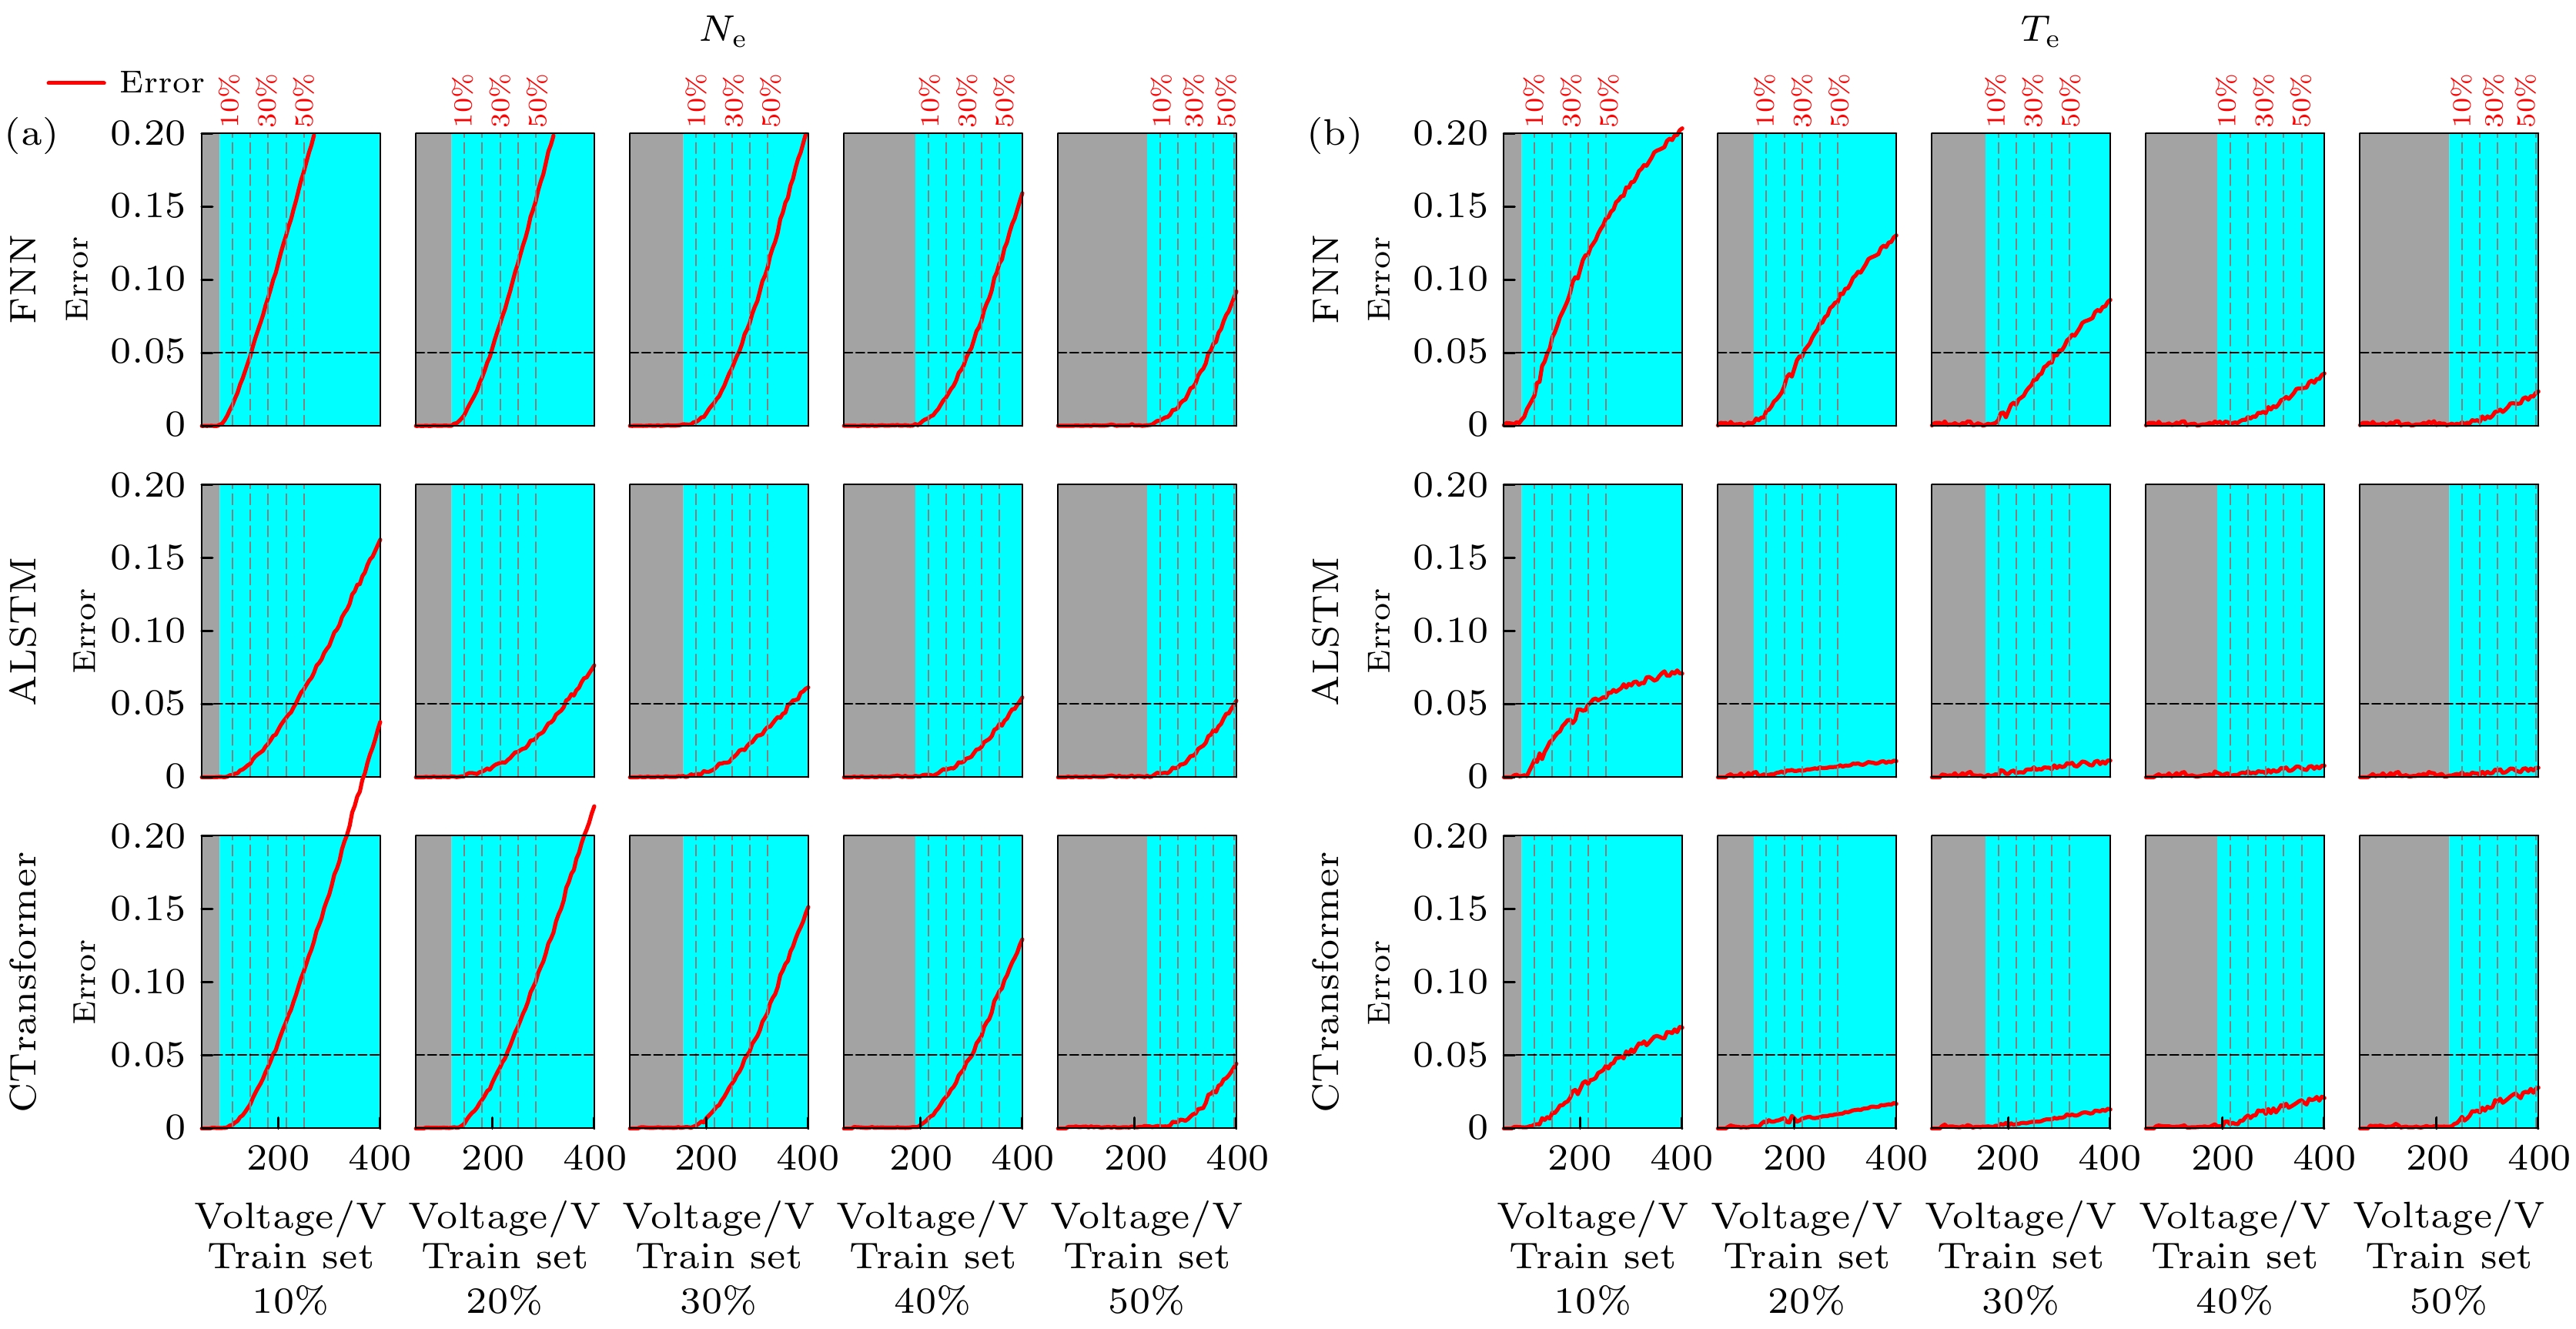
图 8 FNN、ALSTM和CTransformer模型在不同电压数据集(总电压范围50—400 V的10%—50%子集)上训练时电子密度(a)和电子温度(b)的归一化平均空间绝对误差随电压的变化函数. 图中垂直虚线标记了图7(a), (b)中所示的具体外推距离
Figure 8. The normalized mean spatial absolute error of electron density (a) and electron temperature (b) as a function of voltage for FNN, ALSTM, and CTransformer models trained on different voltage datasets (10%–50% subsets spanning the total voltage range of 50–400 V). Vertical dashed lines in the figure mark the specific extrapolation distances shown in Figure 7(a), (b)
表 1 神经网络与传统模型在低温等离子体仿真中的对比
Table 1. Comparison of neural network and traditional models in low-temperature plasma simulation
算法 整体误差/% 求解时间/s 推理时间/s Fluid model $ 0 $ $ > 4680 $ PIC model $ 42.53 $ $ > 7200 $ FNN $ 2.78 $ $ 36.0 $ $ 0.00041 $ ALSTM $ 1.73 $ $ 93.6 $ $ 0.00849 $ CTransformer $ 3.30 $ $ 75.6 $ $ 0.00158 $  DownLoad: CSV
-
[1] Kim H C, Iza F, Yang S S, Radmilović-Radjenović M, Lee J K 2005 J. Phys. D: Appl. Phys. 38 R283
Google Scholar
[2] Wang X C, Zhang Y T 2023 J. Appl. Phys. 133 143301
Google Scholar
[3] Zhang Y T, Gao S H, Zhu Y Y 2023 J. Appl. Phys. 133 053303
Google Scholar
[4] Sethi S P, Das D P, Behera S K 2023 IEEE Trans. Plasma Sci. 51 1434
Google Scholar
[5] Kim B, Im S, Yoo G 2021 Electronics 10 49
[6] Xiao T Q, Wu Z, Christofides P D, Armaou A, Ni D 2021 Ind. Eng. Chem. Res. 61 638
[7] Liau L C K, Huang C J, Chen C C, Huang C S, Chen T, Lin S C, Kuo L C 2002 Sol. Energy Mater. Sol. Cells 71 169
Google Scholar
[8] Pan J, Liu Y, Zhang S, Hu X C, Liu Y D, Shao T 2023 Energy Convers. Manage. 277 116620
Google Scholar
[9] Wan C G, Yu Z, Wang F, Liu X J, Li J G 2021 Nucl. Fusion 61 066015
Google Scholar
[10] Yang Y, Yang S, Li C, Yu Z H 2021 IEEE Access 9 67232
Google Scholar
[11] Borghei M, Ghassemi M 2022 IEEE Trans. Dielectr. Electr. Insul. 29 319
Google Scholar
[12] Seo J, Kim S, Jalalvand A, Conlin R, Rothstein A, Abbate J, Erickson K, Wai J, Shousha R, Kolemen E 2024 Nature 626 746
Google Scholar
[13] Dave B, Patel S, Shivani R, Purohit S, Chaudhury B 2022 Contrib. Plasma Phys. 63 e202200051
[14] Marvin M, Seymour P 1969 MIT Press 6 318
[15] Riedmiller M 1994 Computer Standards & Interfaces 16 265
[16] Krizhevsky A, Sutskever I, Hinton G E 2012 Proceedings of the 26th International Conference on Neural Information Processing Systems Lake Tahoe, USA, December 3–6, 2012 p1097
[17] Elman J L 1990 Cognitive Science 14 179
Google Scholar
[18] Hpchreiter S, Schmidhuber J 1997 Neural Computation 9 1735
Google Scholar
[19] Vaswani A, Shazeer N, Parmar N, Uszkoreit J, Jones L, Gomez A N, Kaiser Ł, Polosukhin 2017 Proceedings of the 31st International Conference on Neural Information Processing Systems Long Beach, USA, December 4–9, 2017 p6000
[20] Liu Z M, Wang Y X, Vaidya S, Ruehle F, Halverson J, Soljačić M, Hou Y T, Tegmark M 2024 2404.19756v5[cs.LG]
[21] Von R L, Maryer S, Beckh K, Georgiev B, Giesselbach S, Heese R, Kirsch B, Pfrommer J, Pick A, Ramamurthy R, Walczak M, Garcke J, Bauckhage C, Schuecker J. 2021 IEEE Trans. Knowl. Data Eng. 35 614
[22] Willard J, Jia X, Xu S M, Steinbach M and Kumar V 2020 arXiv: 2003.04919v6[physics.comp-ph]
[23] Basir S 2022 arXiv: 2209.09988v3[cs.LG]
[24] Luo X, Yuan S Y, Tang H W, Xu D, Ran Q H, Cen Y H, Ling D F 2024 Hydrol. Processes 38 e15143
Google Scholar
[25] Li J, Wu X, Li Z 2025 Appl. Ocean Res. 161 104661
Google Scholar
[26] Guo Y, Li L, Xiang Z, Gui J, Shi S, Lei Z, Xu X 2025 Atomic Energy Science and Technology 59 1085
[27] Li W K, Zhang Y T 2025 J. Appl. Phys. 137 203304
Google Scholar
[28] Noh H, Lee J, Yoon E 2025 J. Comput. Phys. 523 113665
Google Scholar
[29] Shi H Y, Wang S, Wang P Y 2024 J. Environ. Chem. Eng. 12 112998
Google Scholar
[30] Marcus G 2018 arXiv: 1801.00631v1[cs.AI]
[31] Battaglia P W, Hamrick J B, Bapst V, Sanchez-Gonzalez A, Zambaldi V, Malinowski M, Tacchetti A, Raposo D, Santoro A, Faulkner R, Gulcehre C, Song F, Ballard A, Gilmer J, Dahl G, Vaswani A, Allen K, Nash C, Langston V, Dyer C, Heess N, Wierstra D, Kohli P, Botvinick M, Vinyals O, Li Y, Pascanu R 2018 arXiv: 1806.01261v3[cs.LG]
[32] Xu K, Zhang M, Li J, Du S S, Kawarabayashi K I, Jegelka S 2020 arXiv: 2009.11848v5[cs.LG]
[33] Wu Y, Zhu Z, Liu F, Chrysos G, Cevher V 2022 Advances in Neural Information Processing Systems 35 26980
[34] Hestness J, Narang S, Ardalani N, Diamos G, Jun H, Kianinejad H, Patwary M M A, Yang Y, Zhou Y Q 2017 arXiv: 1712.00409v1[cs.LG]
[35] Manzhos S, Ihara M 2023 J. Phys. Chem. A 127 7823
Google Scholar
[36] Jain S, Wallace B C 2019 arXiv: 1902.10186v3[cs.CL]
[37] Donko Z, Derzsi A, Vass M, Horvth B, Wilczek S, Horvath B, Hartmann P 2021 Plasma Sources Sci. Technol. 30 095017
Google Scholar
[38] Jia W Z, Zhang Q Z, Wang X F, Song Y H, Wang Y N 2019 J. Phys. D: Appl. Phys. 52 015206
Google Scholar


 DownLoad:


Catalog
Metrics
- Abstract views: 1410
- PDF Downloads: 49
- Cited By: 0
