


-
The inharmonic lattice vibration induced by the lone pair electrons of In+ in the InTe compound produces its intrinsically low thermal conductivity, thus InTe compound shows a great potential serving as an intermediate temperature thermoelectric material. However, its poor electrical transport properties result in an inferior thermoelectric performance. In this study, a series of single-phase In1+xTe (x = 0, 0.001, 0.003, 0.005, 0.01) polycrystalline samples were prepared by a melting-annealing process combined with spark plasma sintering. The influence of In content on the electronic and thermal transport properties for In1+xTe compounds was systematically studied. As the temperature rises, the predominant carrier scattering mechanism changes from grain boundary scattering to acoustic phonon scattering, leading to an unusual semiconductor-to-metal transition in In1+xTe samples. Positron annihilation spectroscopy and electrical transport properties demonstrate that In vacancies are the main source for the charge carrier. Adding extra In effectively suppresses the concentration of In vacancies, reduces the carrier concentration and improves the Seebeck coefficient of In1+xTe samples. The power factor of the In excess samples in the test temperature range is greatly improved in comparison with that of the pristine InTe sample. In1.005Te sample achieves a maximum power factor of 0.60 mW·m–1·K–2 at 585 K, which is approximately 40% higher than the pristine InTe sample. In addition, the In excess sample maintains a thermal conductivity as intrinsically low as the thermal conductivity of pristine InTe, and the total thermal conductivity of the In1.01Te sample at 773 K is 0.46 W·m–1·K–1. Owing to the improvement of the power factor and the low thermal conductivity, the ZT value of the In excess sample is greatly improved in the entire measure temperature range. A maximum ZT value of 0.71 is attained at 750 K for In1.003Te sample, and a maximum
ZTave of 0.39 is achieved for In1.005Te sample in a temperature range of 300–750 K, which is about 23% higher than that of pristine InTe sample. -
Keywords:
- InTe /
- In content regulation /
- structures /
- thermoelectric property
[1] He J, Tritt T M 2017 Science 357 1
[2] Tan G J, Zhao L D, Kanatzidis M G 2016 Chem. Rev. 116 12123
 Google Scholar
[3] Snyder G J, Toberer E S 2008 Nat. Mater. 7 101
[4] Su X L, Hao S Q, Bailey T P, Wang S, Hadar I, Tan G J, Song T B, Zhang Q J, Uher C, Wolverton C, Tang X F, Kanatzidis M G 2018 Adv. Energy Mater. 8 1800659
Google Scholar
[5] Parlak M, Ercelebi C, Günal I, Özkan H, Gasanly N 1996 Cryst. Res. Technol. 31 673
Google Scholar
[6] Pal S, Bose D, Asokan S, Gopal E 1991 Solid State Commun. 80 753
Google Scholar
[7] Nagat A, Gamal G, Belal A 1990 Cryst. Res. Technol. 25 72
Google Scholar
[8] Pan S S, Liu H, Li Z L, You L, Dai S N, Yang J, Guo K, Luo J 2020 J. Alloy. Compd. 813 152210
Google Scholar
[9] Misra S, Barreteau C, Crivello J C, Giordano V M, Castellan J P, Sidis Y, Levinský P, Hejtmánek J, Malaman B, Dauscher A, Lenoir B, Candolfi C, Pailhès S 2020 Phys. Rev. Research 2 043371
Google Scholar
[10] Back S Y, Kim Y K, Cho H, Han M K, Kim S J, Rhyee J S 2020 ACS Appl. Energ. Mater. 3 3628
Google Scholar
[11] Back S Y, Cho H, Kim Y K, Byeon S, Jin H, Koumoto K, Rhyee J S 2018 AIP Advances 8 115227
Google Scholar
[12] Jana M K, Pal K, Waghmare U V, Biswas K 2016 Angew. Chem. Int. Edit 55 7792
Google Scholar
[13] Huang R C, Huang Y, Zhu B, He M K, Ge Z H, Fu L W, He J Q 2019 J. Appl. Phys. 126 125108
Google Scholar
[14] Zhu H X, Zhang B, Wang G W, Peng K L, Yan Y C, Zhang Q, Han X D, Wang G Y, Lu X, Zhou X Y 2019 J. Mater. Chem. A 7 11690
Google Scholar
[15] Zlomanov V P, Sheiman M S, Legendre B 2001 J. Phase Equilibria 22 339
Google Scholar
[16] Cao Y, Su X L, Meng F C, Bailey T P, Zhao J G, Xie H Y, He J, Uher C, Tang X F 2020 Adv. Funct. Mater. 30 2005861
Google Scholar
[17] Kuo J J, Kang S D, Imasato K, Tamaki H, Ohno S, Kanno T, Snyder G J 2018 Energy Environ. Sci. 11 429
Google Scholar
[18] Slade T J, Grovogui J A, Kuo J J, Anand S, Bailey T P, Wood M, Uher C, Snyder G J, Dravid V P, Kanatzidis M G 2020 Energy Environ. Sci. 13 1509
Google Scholar
[19] Seto J Y 1975 J. Appl. Phys. 46 5247
Google Scholar
[20] Chen S, Bai H, Li J J, Pan W F, Jiang X Y, Li Z, Chen Z Q, Yan Y G, Su X L, Wu J S, Uher C, Tang X F 2020 ACS Appl. Mater. Interfaces 12 19664
Google Scholar
-
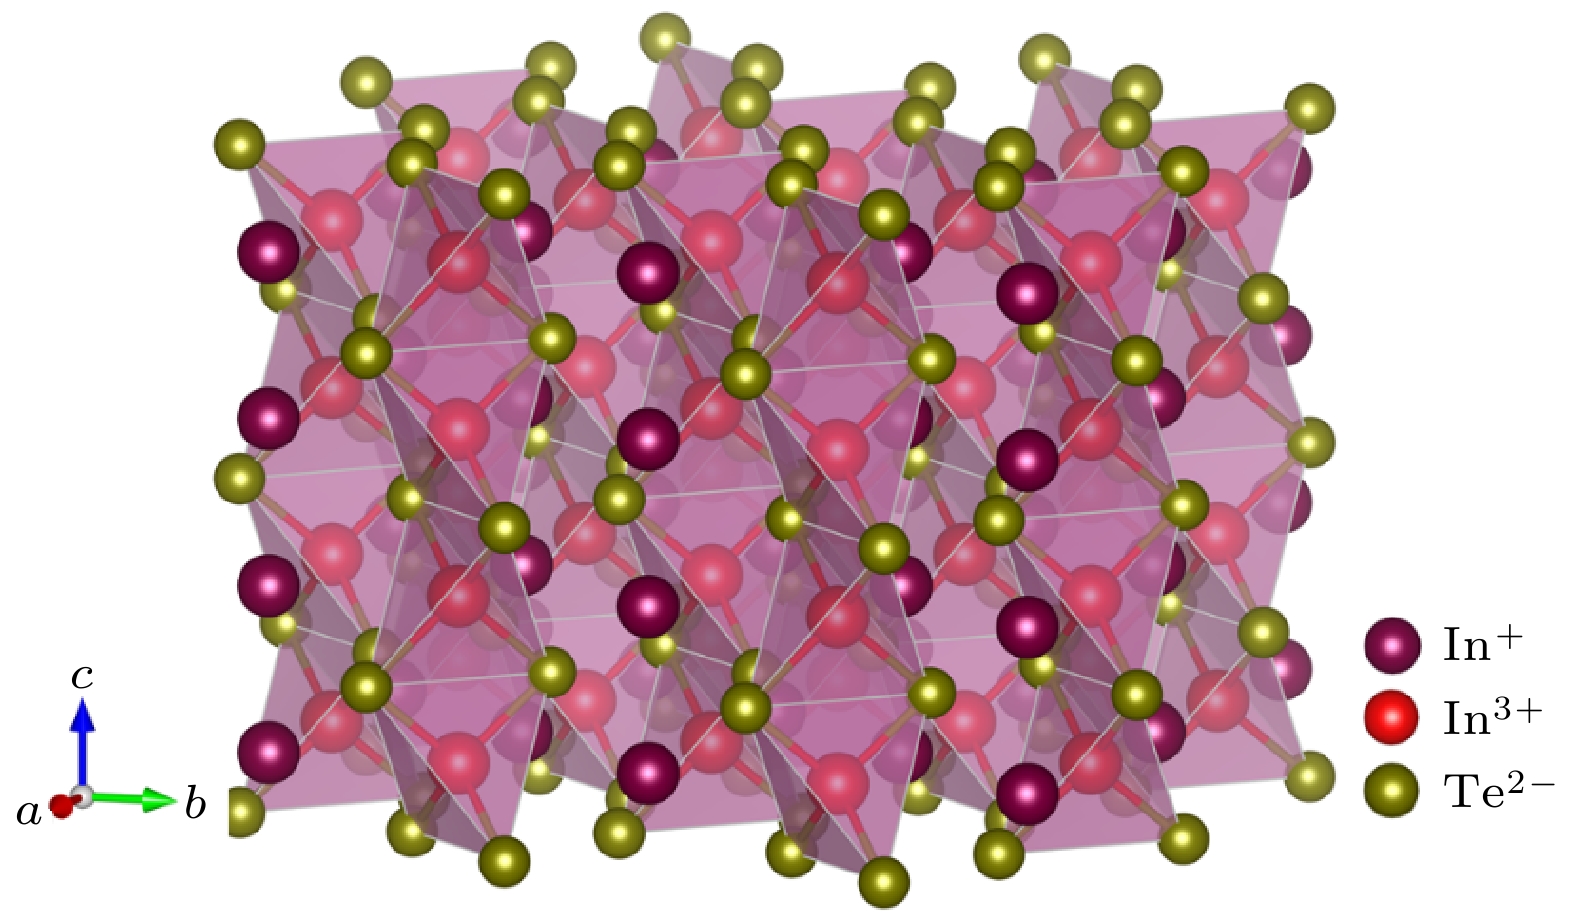
图 1 InTe的晶体结构
Figure 1. The crystal structure of InTe.
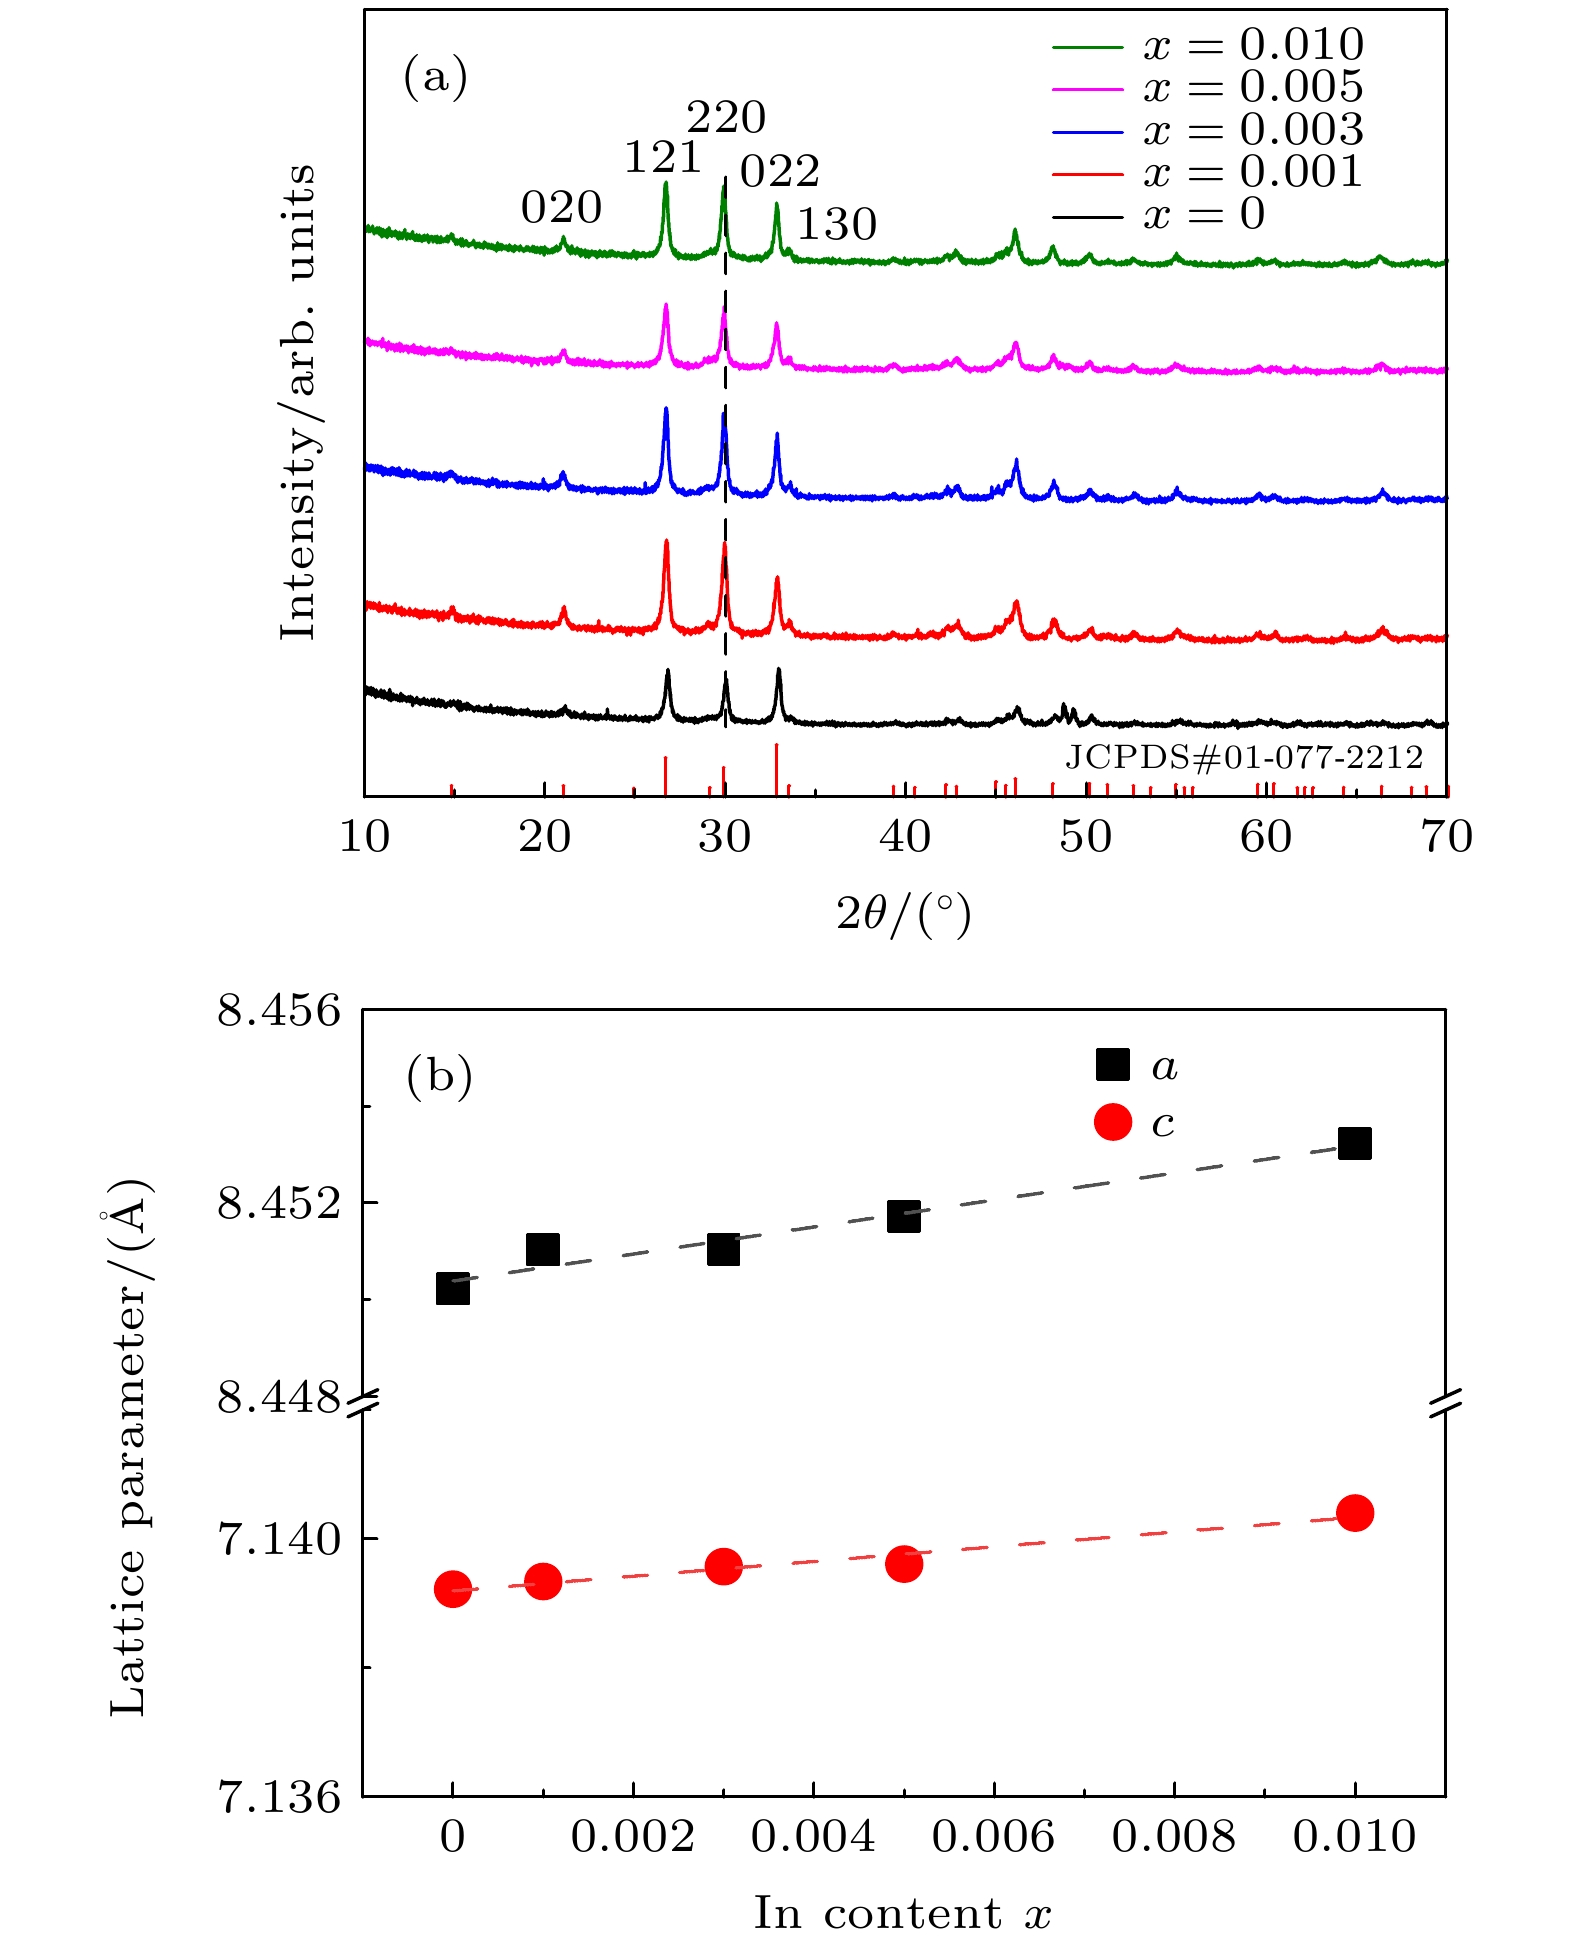
图 2 (a) In1+xTe (x = 0—0.01)化合物的粉末XRD图谱; (b) In1+xTe (x = 0—0.01)样品a轴及c轴的晶胞参数
Figure 2. (a) Powder XRD patterns of In1+xTe (x = 0–0.01) compounds; (b) the a and c lattice parameters of In1+xTe (x = 0–0.01).

图 3 In1+xTe (x = 0—0.01)样品的热流曲线
Figure 3. Heat flow curve of In1+xTe samples (x = 0–0.01).
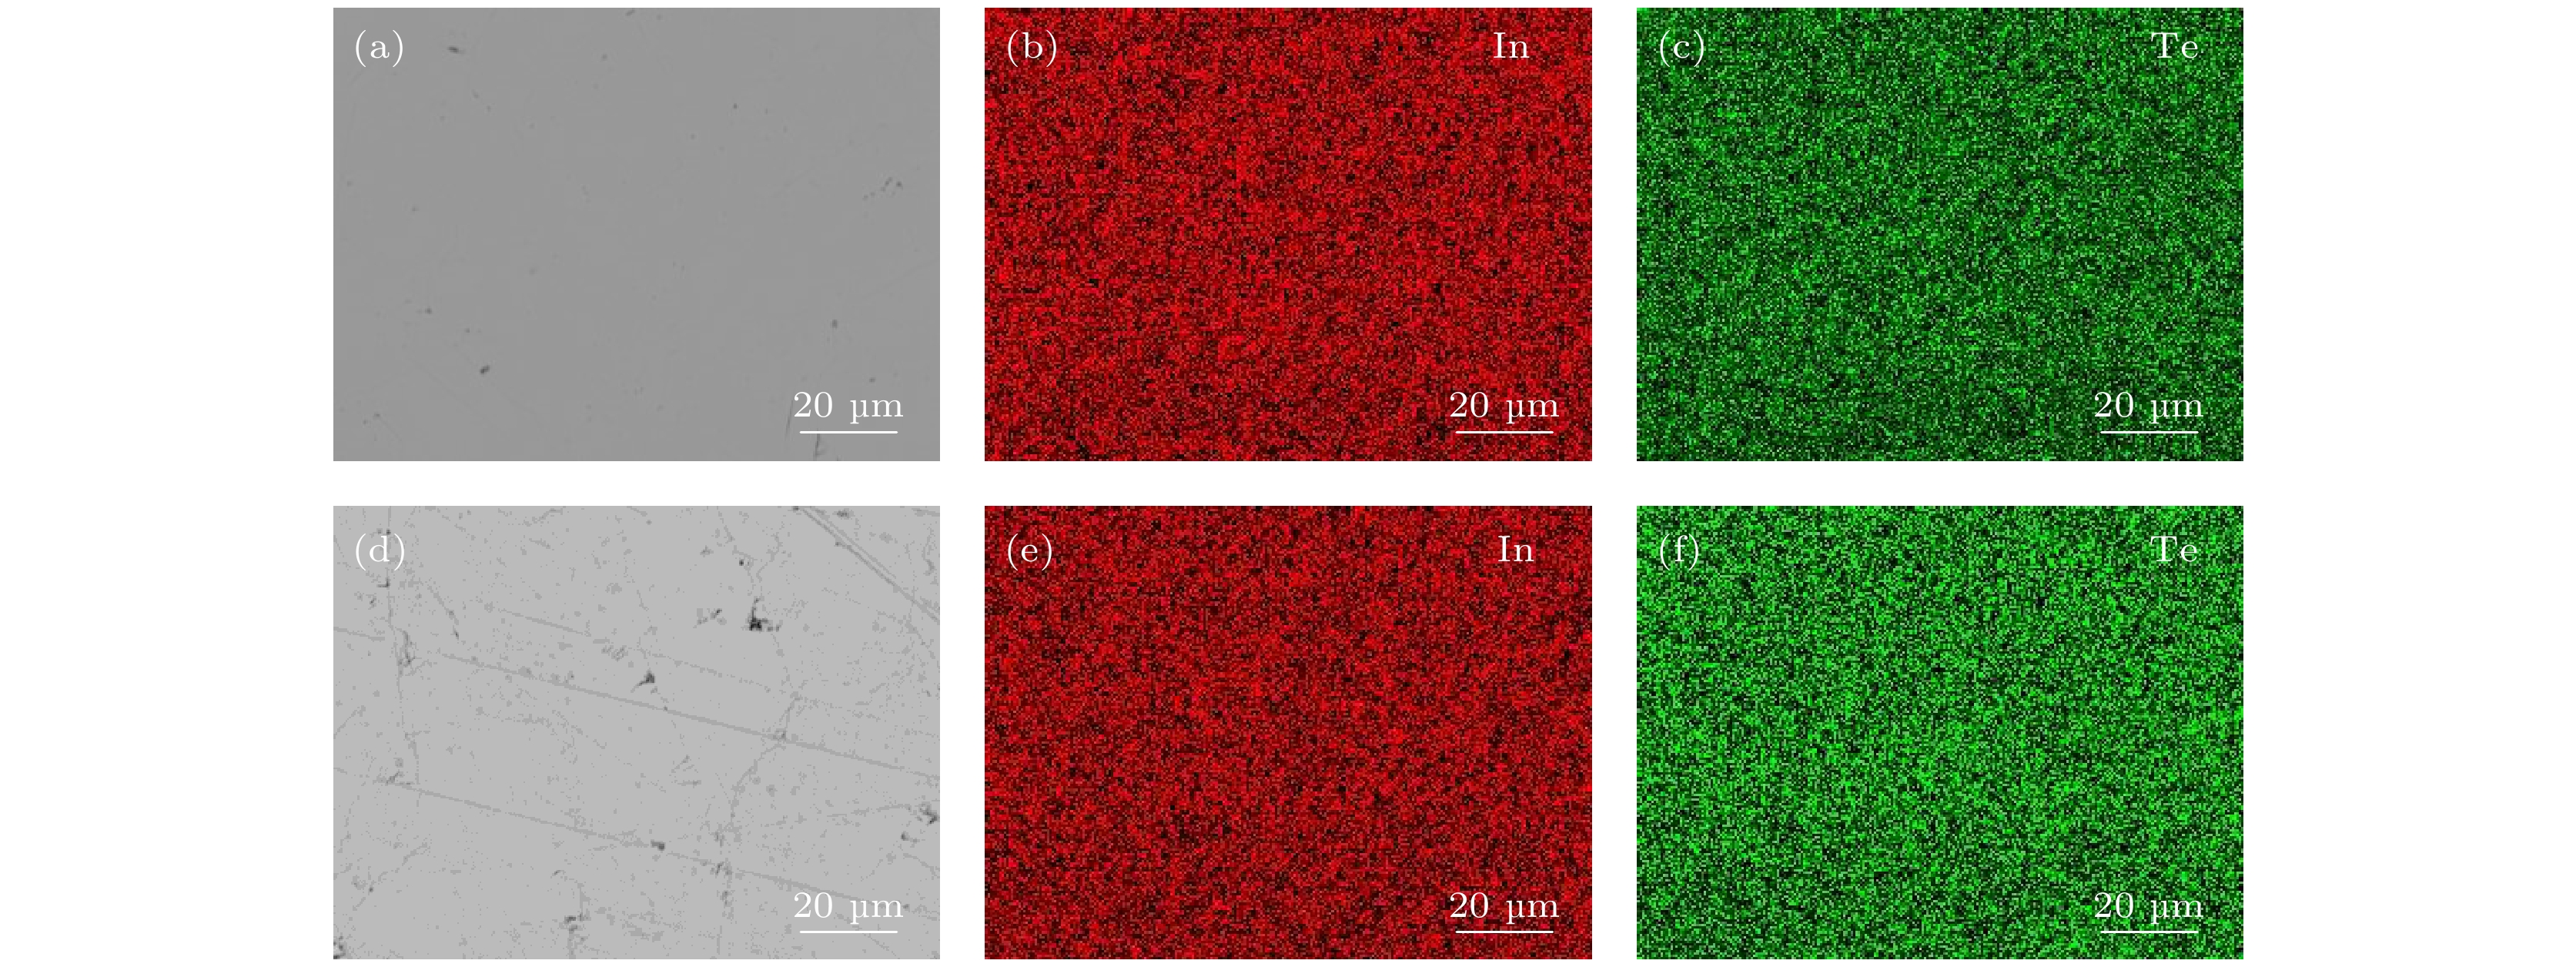
图 4 In1+xTe样品 ((a)—(c) x = 0, (d)—(f) x = 0.01)抛光面的(a), (d)背散射电子图像和(b), (e) In, (c), (f) Te元素面分布图谱
Figure 4. (a), (d) Back-scattering electron (BSE) images and (b), (e)In, (c), (f)Te elemental distributions of the polished surfaces for In1+xTe samples ((a)–(c) x = 0, (d)–(f) x = 0.01).
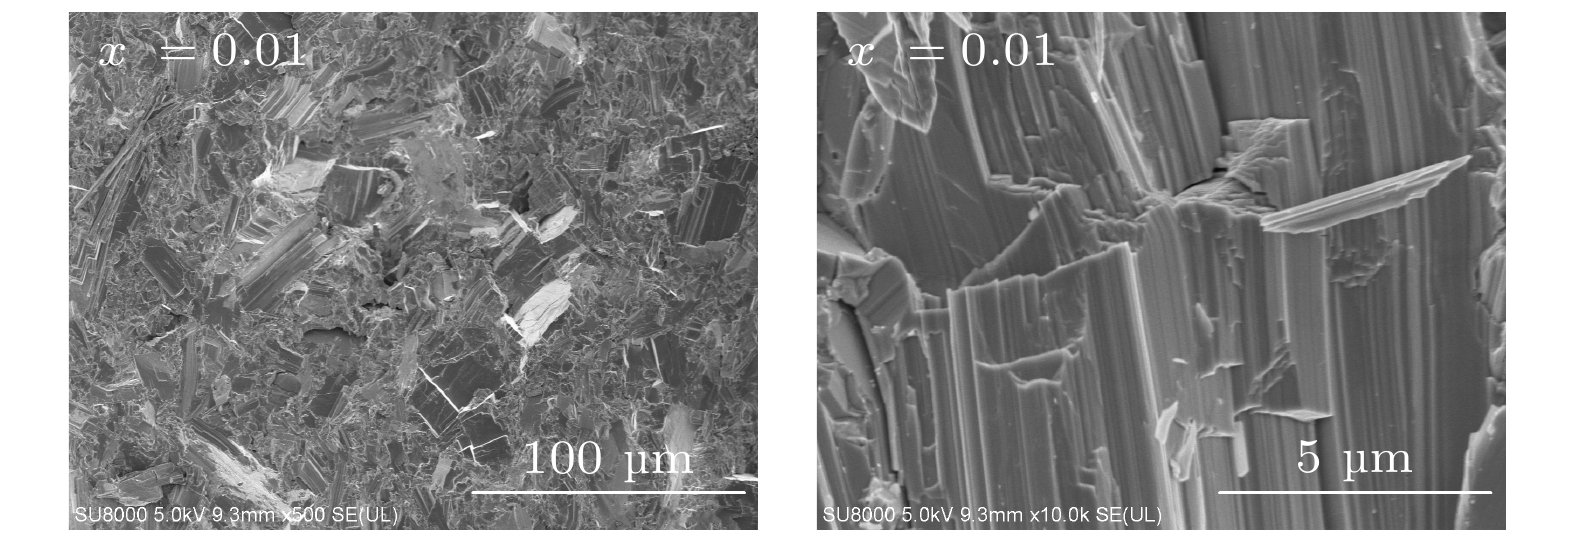
图 5 In1.01Te烧结样品的自由断面场发射电镜图片
Figure 5. FESEM images of the freshly fractured surface of In1.01Te after sintering.

图 6 In1+xTe样品的 (a)电导率、(b)塞贝克系数、(c)功率因子随温度的变化曲线, (d)塞贝克系数与载流子浓度关系曲线
Figure 6. Temperature dependence of (a) electrical conductivity, (b) Seebeck coefficient, (c) power factor for In1+xTe, (d) the relationship between carrier concentration and Seebeck coefficient for In1+xTe samples at room temperature.
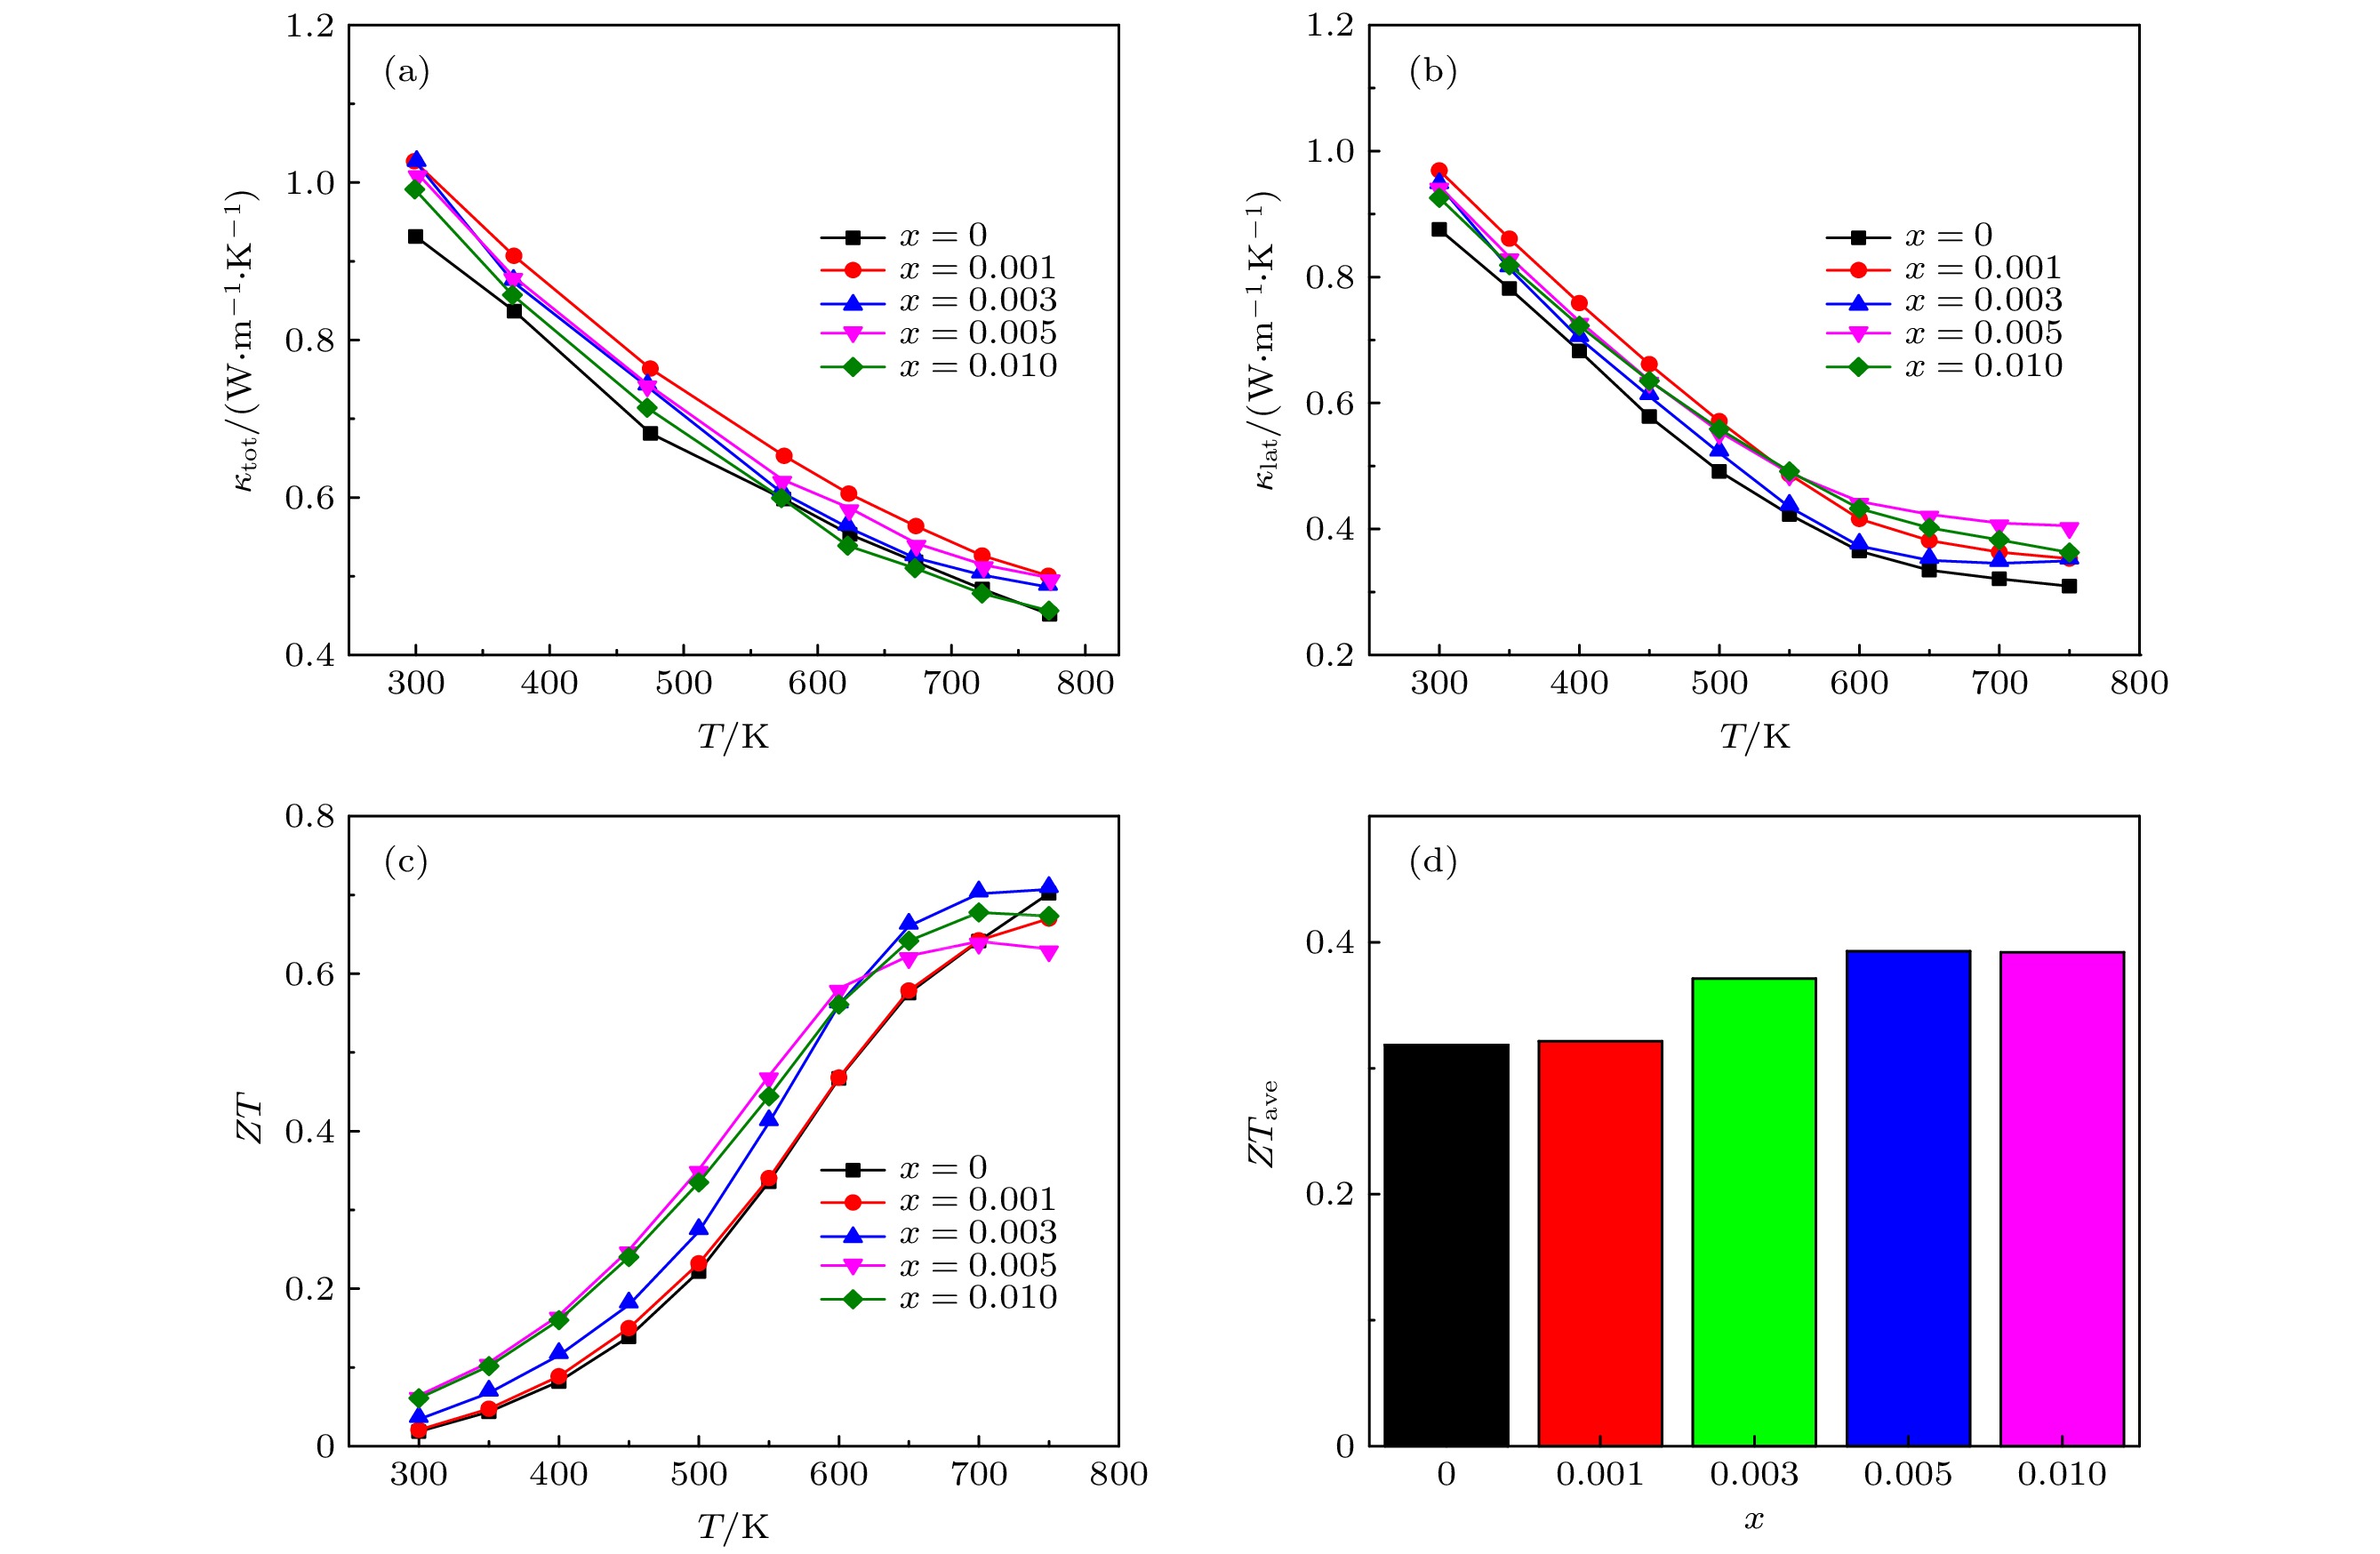
图 7 In1+xTe样品的 (a)总热导率、(b)晶格热导率、(c)热电性能优值ZT随温度变化曲线和(d) 300—750 K范围内的平均ZT值
Figure 7. Temperature dependence of the (a) total thermal conductivity, (b)lattice thermal conductivity, (c) figure of merit ZT and (d)
ZTave in the 300–750 K range for In1+xTe samples. 表 1 In1+xTe(0 ≤ x ≤ 0.01)样品的室温物理性能及载流子晶界散射势垒
Table 1. Physic properties at room temperature and the grain boundary scattering potential for charge carrier of In1+xTe (0 ≤ x ≤ 0.01).
Nominal composition p/(× 1019 cm–3) μ/(cm2·V–1·s–1) σ/(104 S·m–1) S/(μV·K–1) Eb/(meV) InTe 6.72 8.71 0.94 79.31 41.94 In1.001Te 5.58 10.72 0.96 87.17 42.03 In1.003Te 5.35 16.16 1.38 92.99 23.14 In1.005Te 4.53 17.73 1.28 131.44 25.47 In1.01Te 2.90 25.55 1.19 132.51 15.19  DownLoad: CSV
表 2 不同In含量In1+xTe样品的正电子寿命
Table 2. Positron Lifetimes for In1+xTe Samples.
Sample τ1/ps τ2/ps I1/% I2/% τave/ps In0.99Te 126.6 342.0 3.37 96.63 334.7 In0.999Te 131.6 343.0 4.22 95.78 334.1 InTe 135.0 345.4 5.10 94.90 334.7 In1.001Te 147.3 344.5 5.49 94.51 333.7 In1.005Te 171.0 348.1 8.46 91.54 333.1 In1.01Te 181.1 351.8 8.89 91.11 336.6
DownLoad: CSV
-
[1] He J, Tritt T M 2017 Science 357 1
[2] Tan G J, Zhao L D, Kanatzidis M G 2016 Chem. Rev. 116 12123
Google Scholar
[3] Snyder G J, Toberer E S 2008 Nat. Mater. 7 101
[4] Su X L, Hao S Q, Bailey T P, Wang S, Hadar I, Tan G J, Song T B, Zhang Q J, Uher C, Wolverton C, Tang X F, Kanatzidis M G 2018 Adv. Energy Mater. 8 1800659
Google Scholar
[5] Parlak M, Ercelebi C, Günal I, Özkan H, Gasanly N 1996 Cryst. Res. Technol. 31 673
Google Scholar
[6] Pal S, Bose D, Asokan S, Gopal E 1991 Solid State Commun. 80 753
Google Scholar
[7] Nagat A, Gamal G, Belal A 1990 Cryst. Res. Technol. 25 72
Google Scholar
[8] Pan S S, Liu H, Li Z L, You L, Dai S N, Yang J, Guo K, Luo J 2020 J. Alloy. Compd. 813 152210
Google Scholar
[9] Misra S, Barreteau C, Crivello J C, Giordano V M, Castellan J P, Sidis Y, Levinský P, Hejtmánek J, Malaman B, Dauscher A, Lenoir B, Candolfi C, Pailhès S 2020 Phys. Rev. Research 2 043371
Google Scholar
[10] Back S Y, Kim Y K, Cho H, Han M K, Kim S J, Rhyee J S 2020 ACS Appl. Energ. Mater. 3 3628
Google Scholar
[11] Back S Y, Cho H, Kim Y K, Byeon S, Jin H, Koumoto K, Rhyee J S 2018 AIP Advances 8 115227
Google Scholar
[12] Jana M K, Pal K, Waghmare U V, Biswas K 2016 Angew. Chem. Int. Edit 55 7792
Google Scholar
[13] Huang R C, Huang Y, Zhu B, He M K, Ge Z H, Fu L W, He J Q 2019 J. Appl. Phys. 126 125108
Google Scholar
[14] Zhu H X, Zhang B, Wang G W, Peng K L, Yan Y C, Zhang Q, Han X D, Wang G Y, Lu X, Zhou X Y 2019 J. Mater. Chem. A 7 11690
Google Scholar
[15] Zlomanov V P, Sheiman M S, Legendre B 2001 J. Phase Equilibria 22 339
Google Scholar
[16] Cao Y, Su X L, Meng F C, Bailey T P, Zhao J G, Xie H Y, He J, Uher C, Tang X F 2020 Adv. Funct. Mater. 30 2005861
Google Scholar
[17] Kuo J J, Kang S D, Imasato K, Tamaki H, Ohno S, Kanno T, Snyder G J 2018 Energy Environ. Sci. 11 429
Google Scholar
[18] Slade T J, Grovogui J A, Kuo J J, Anand S, Bailey T P, Wood M, Uher C, Snyder G J, Dravid V P, Kanatzidis M G 2020 Energy Environ. Sci. 13 1509
Google Scholar
[19] Seto J Y 1975 J. Appl. Phys. 46 5247
Google Scholar
[20] Chen S, Bai H, Li J J, Pan W F, Jiang X Y, Li Z, Chen Z Q, Yan Y G, Su X L, Wu J S, Uher C, Tang X F 2020 ACS Appl. Mater. Interfaces 12 19664
Google Scholar


 DownLoad:


Catalog
Metrics
- Abstract views: 7604
- PDF Downloads: 131
- Cited By: 0
