


-
基于低频三角波扫描加高频正弦波调制的扫描波长调制策略, 提出了一种高精度、免标定分子吸收率函数重构方法. 该方法利用谱线在扫描频率下对应的各次谐波信号重构出以该频率为中心、以调制深度为半宽度频域范围内的透过率信息, 结合低频扫描即可得到谱线透过率信息, 最后对频率重叠区域的透过率进行插值平均即可得到分子吸收率函数. 为验证该方法的测量精度, 利用CO2分子在6330.821 cm–1谱线对不同浓度CO2的吸收率函数进行重构, 并拟合得到浓度, 吸收率拟合残差标准差达到10–5, 强吸收与弱吸收的测量信噪比分别达到503与222. 3000次连续在线浓度测量结果分布直方图表明, 谐波重构法测量稳定性显著优于直接吸收法和二次谐波峰值法, 预期可为谱线参数的高精度标定以及复杂工业现场中弱吸收气体参数高精度在线监测提供新的可靠测量方法.A high-precision, calibration-free method of reconstructing molecular absorbance profile is introduced in this work. The method employs a scanning wavelength modulation strategy that integrates low-frequency triangular wave scanning with high-frequency sine wave modulation. Specifically, it utilizes harmonic signals corresponding to the spectral lines at the scanning frequency to reconstruct transmittance information centered around that frequency, with the modulation depth used as the half-width frequency range. Combining low-frequency scanning, the transmittance information of the spectral lines can be obtained accurately. Finally, through interpolating and averaging the transmittance in overlapping frequency regions, the molecular absorbance profile is reconstructed. The main content of this paper is divided into three key parts: theoretical derivation of the harmonic reconstruction method, numerical simulation, and experimental validation. In the theoretical derivation, the instantaneous laser frequency is represented as a parameter “x” by using a cosine function and is subsequently substituted into the Fourier expansion of the laser transmittance. Then the transmittance function is reconstructed based on Chebyshev polynomials. In the numerical simulation, we illustrate the complete process of the harmonic reconstruction method, including harmonic detection, data matrix reconstruction, and the interpolation and average of data matrix slices finally obtain the transmittance function. Subsequently, through numerical simulations, the systematic errors in the reconstructed transmittance functions with different harmonic orders and modulation depths are analyzed and compared. The results show that the systematic error decreases with the harmonic order increasing and increases with the modulation depth increasing. In the experimental verification, in order to evaluate the measurement accuracy of this method, we reconstruct the absorbance profiles for different concentrations of CO2 by using the 6330.821 cm–1 spectral line. The standard deviation of the fitting residual of the absorbance profile is on the order of 10–5. The signal-to-noise ratios for the strong absorption and weak absorption, are 503 and 222, respectively. We conduct 3000 consecutive on-line measurements and compare the harmonic reconstruction method with both the direct absorption method and the second harmonic peak method. Statistical analyses are made regarding the standard deviations and Gaussian distributions of the deduced concentration results. These results indicate that the standard deviation from the harmonic reconstruction method is less than half of those from the direct absorption method and the second harmonic peak method, demonstrating significantly superior measurement stability. This method is expected to become a reliable new method to measure spectral line parameters with high accuracy and monitor weakly absorbing gas parameters online in complex industrial environments.
-
Keywords:
- scanning wavelength modulation spectrum /
- harmonic detection /
- transmittance data matrix /
- absorbance profile recovering
[1] Adámek P, Olejníček J, Čada M, Kment Š, Hubička Z 2013 Opt. Lett. 38 2428
 Google Scholar
[2] Goldenstein C S, Spearrin R M, Jeffries J B, Hanson R K 2017 Prog. Energ. Combust. 60 132
Google Scholar
[3] Witzel O, Klein A, Meffert C, Schulz C, Kaiser S A, Ebert V 2015 P. Combust. Inst. 35 3653
Google Scholar
[4] Fissiaux L, Delière Q, Blanquet G, Robert S, Vandaele A C, Lepère M 2014 J. Mol. Spectrosc. 297 35
Google Scholar
[5] Ghysels M, Durry G, Amarouche N 2013 Spectrochim. Acta A 107 55
Google Scholar
[6] McManus J B, Zahniser M S, Nelson D D, Shorter J H, Herndon S, Wood E 2010 Opt. Eng. 49 111124
Google Scholar
[7] McManus J B, Zahniser M S, Nelson D D, et al. 2015 Appl. Phys. B 119 203
Google Scholar
[8] Zhao G, Tan W, Jia M Y, et al. 2016 Sensors 16 1544
Google Scholar
[9] Cai W W, Kaminski C F 2014 Appl. Phys. Lett. 104 154106
Google Scholar
[10] Hangauer A, Chen J, Strzoda R, Ortsiefer M, Amann M, 2008 Opt. Lett. 33 1566
Google Scholar
[11] Bolshov M A, Kuritsyn Y A, Romanovskii Y V 2015 Spectrochim. Acta B 106 45
Google Scholar
[12] Neethu S, Verma R, Kamble S S, et al. 2014 Sensor. Actuat. B-Chem 192 70
Google Scholar
[13] Werle P A 1998 Spectrochim. Acta A 54 197
Google Scholar
[14] Bain J R P, Johnstone W, Ruxton K, Stewart G, Lengden M, Duffin K 2011 J. Lightw. Technol. 29 987
Google Scholar
[15] Reid J, Labrie D 1981 Appl. Phys. B 26 203
Google Scholar
[16] Rieker G B, Jeffffries J B, Hanson R K 2009 Appl. Optics. 48 5546
Google Scholar
[17] Wang Z H, Fu P F, Chao X 2019 Appl. Sci. 9 2723
Google Scholar
[18] Goldenstein C S, Strand C L, Schultz I A, Sun K, Jeffries J B, Hanson R K 2014 Appl. Optics. 53 356
Google Scholar
[19] Goldenstein C S, Hanson R K 2015 J. Quant. Spectrosc. RA. 152 127
Google Scholar
[20] Goldenstein C S, Jeffries J B, Hanson R K 2013 J. Quant. Spectrosc. RA. 130 100
Google Scholar
[21] Stewart G, Johnstone W, Bain J, Ruxton K, Duffin K 2011 J. Lightwave Technol. 29 811
Google Scholar
[22] Peng Z M, Du Y J, Che L, Li X H, Zheng K J 2011 Opt. Express 19 23104
Google Scholar
[23] Peng Z M, Du Y J, Che L, Yang Q S 2012 Opt. Express 20 11976
Google Scholar
[24] Rothman L S, Gordon I E, Babikov Y, et al. 2013 J. Quant. Spectrosc. RA. 130 4
Google Scholar
[25] Buchholz B, Böse N, Ebert V 2014 Appl. Phys. B 116 883
Google Scholar
[26] Pogány A, Klein A, Ebert V 2015 J. Quant. Spectrosc. RA. 165 108
Google Scholar
-
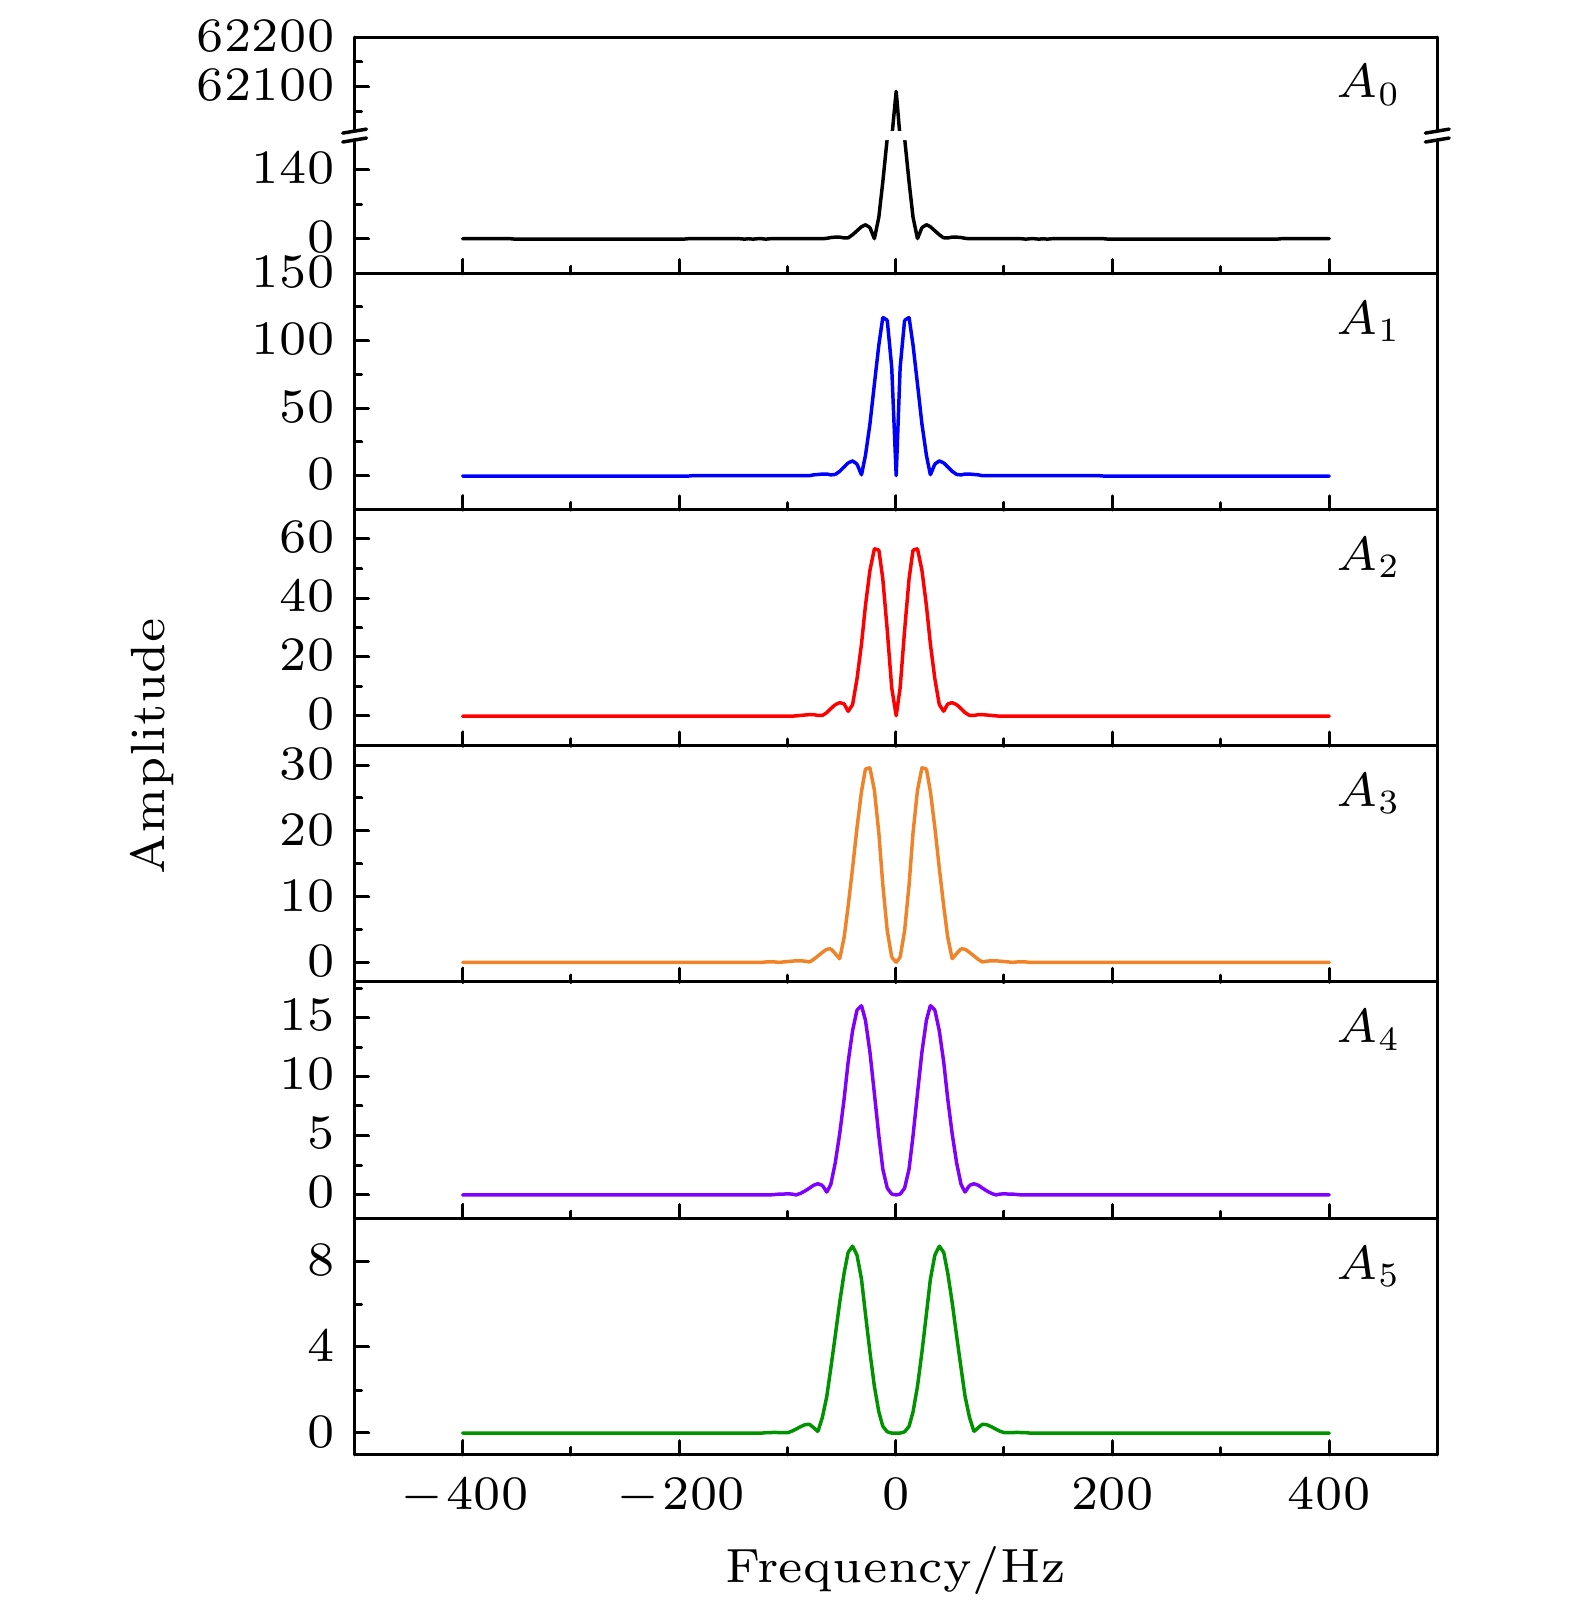
图 2 周期变化透过率的0—5阶谐波频谱
Fig. 2. The 0th−5th order harmonic spectrum of transmittance with periodic variations.
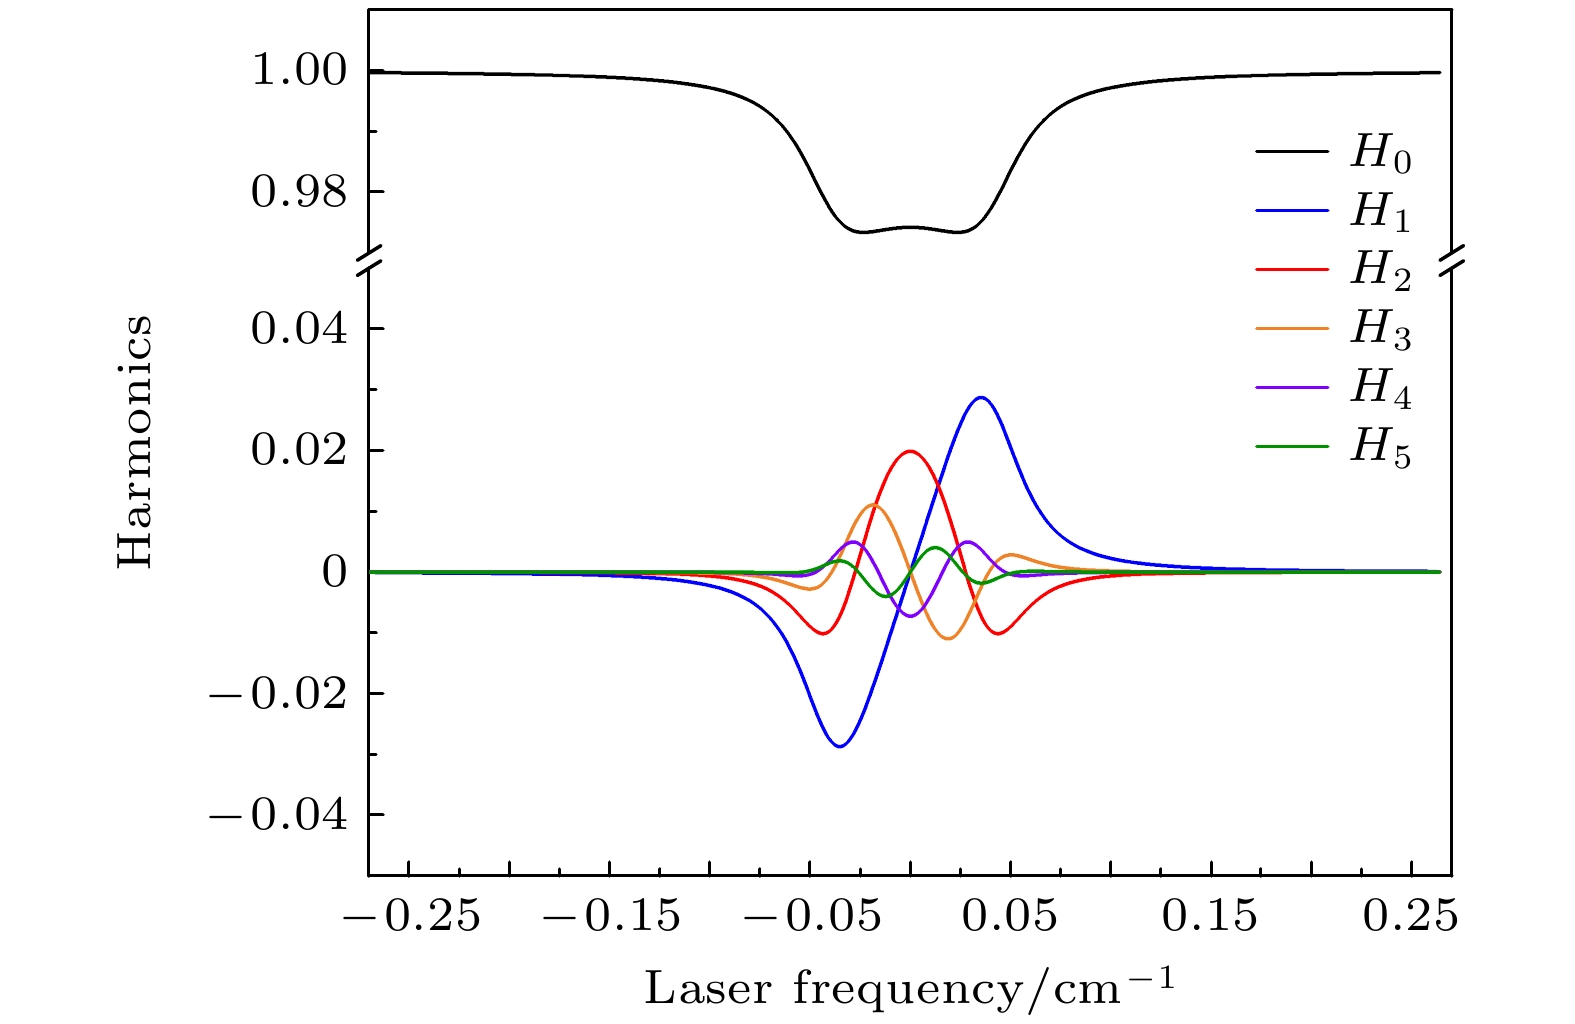
图 3 CO2单谱线0—5阶谐波幅值
Fig. 3. Amplitude of harmonics in the single spectral line of CO2 ranging from 0th to 5th order.
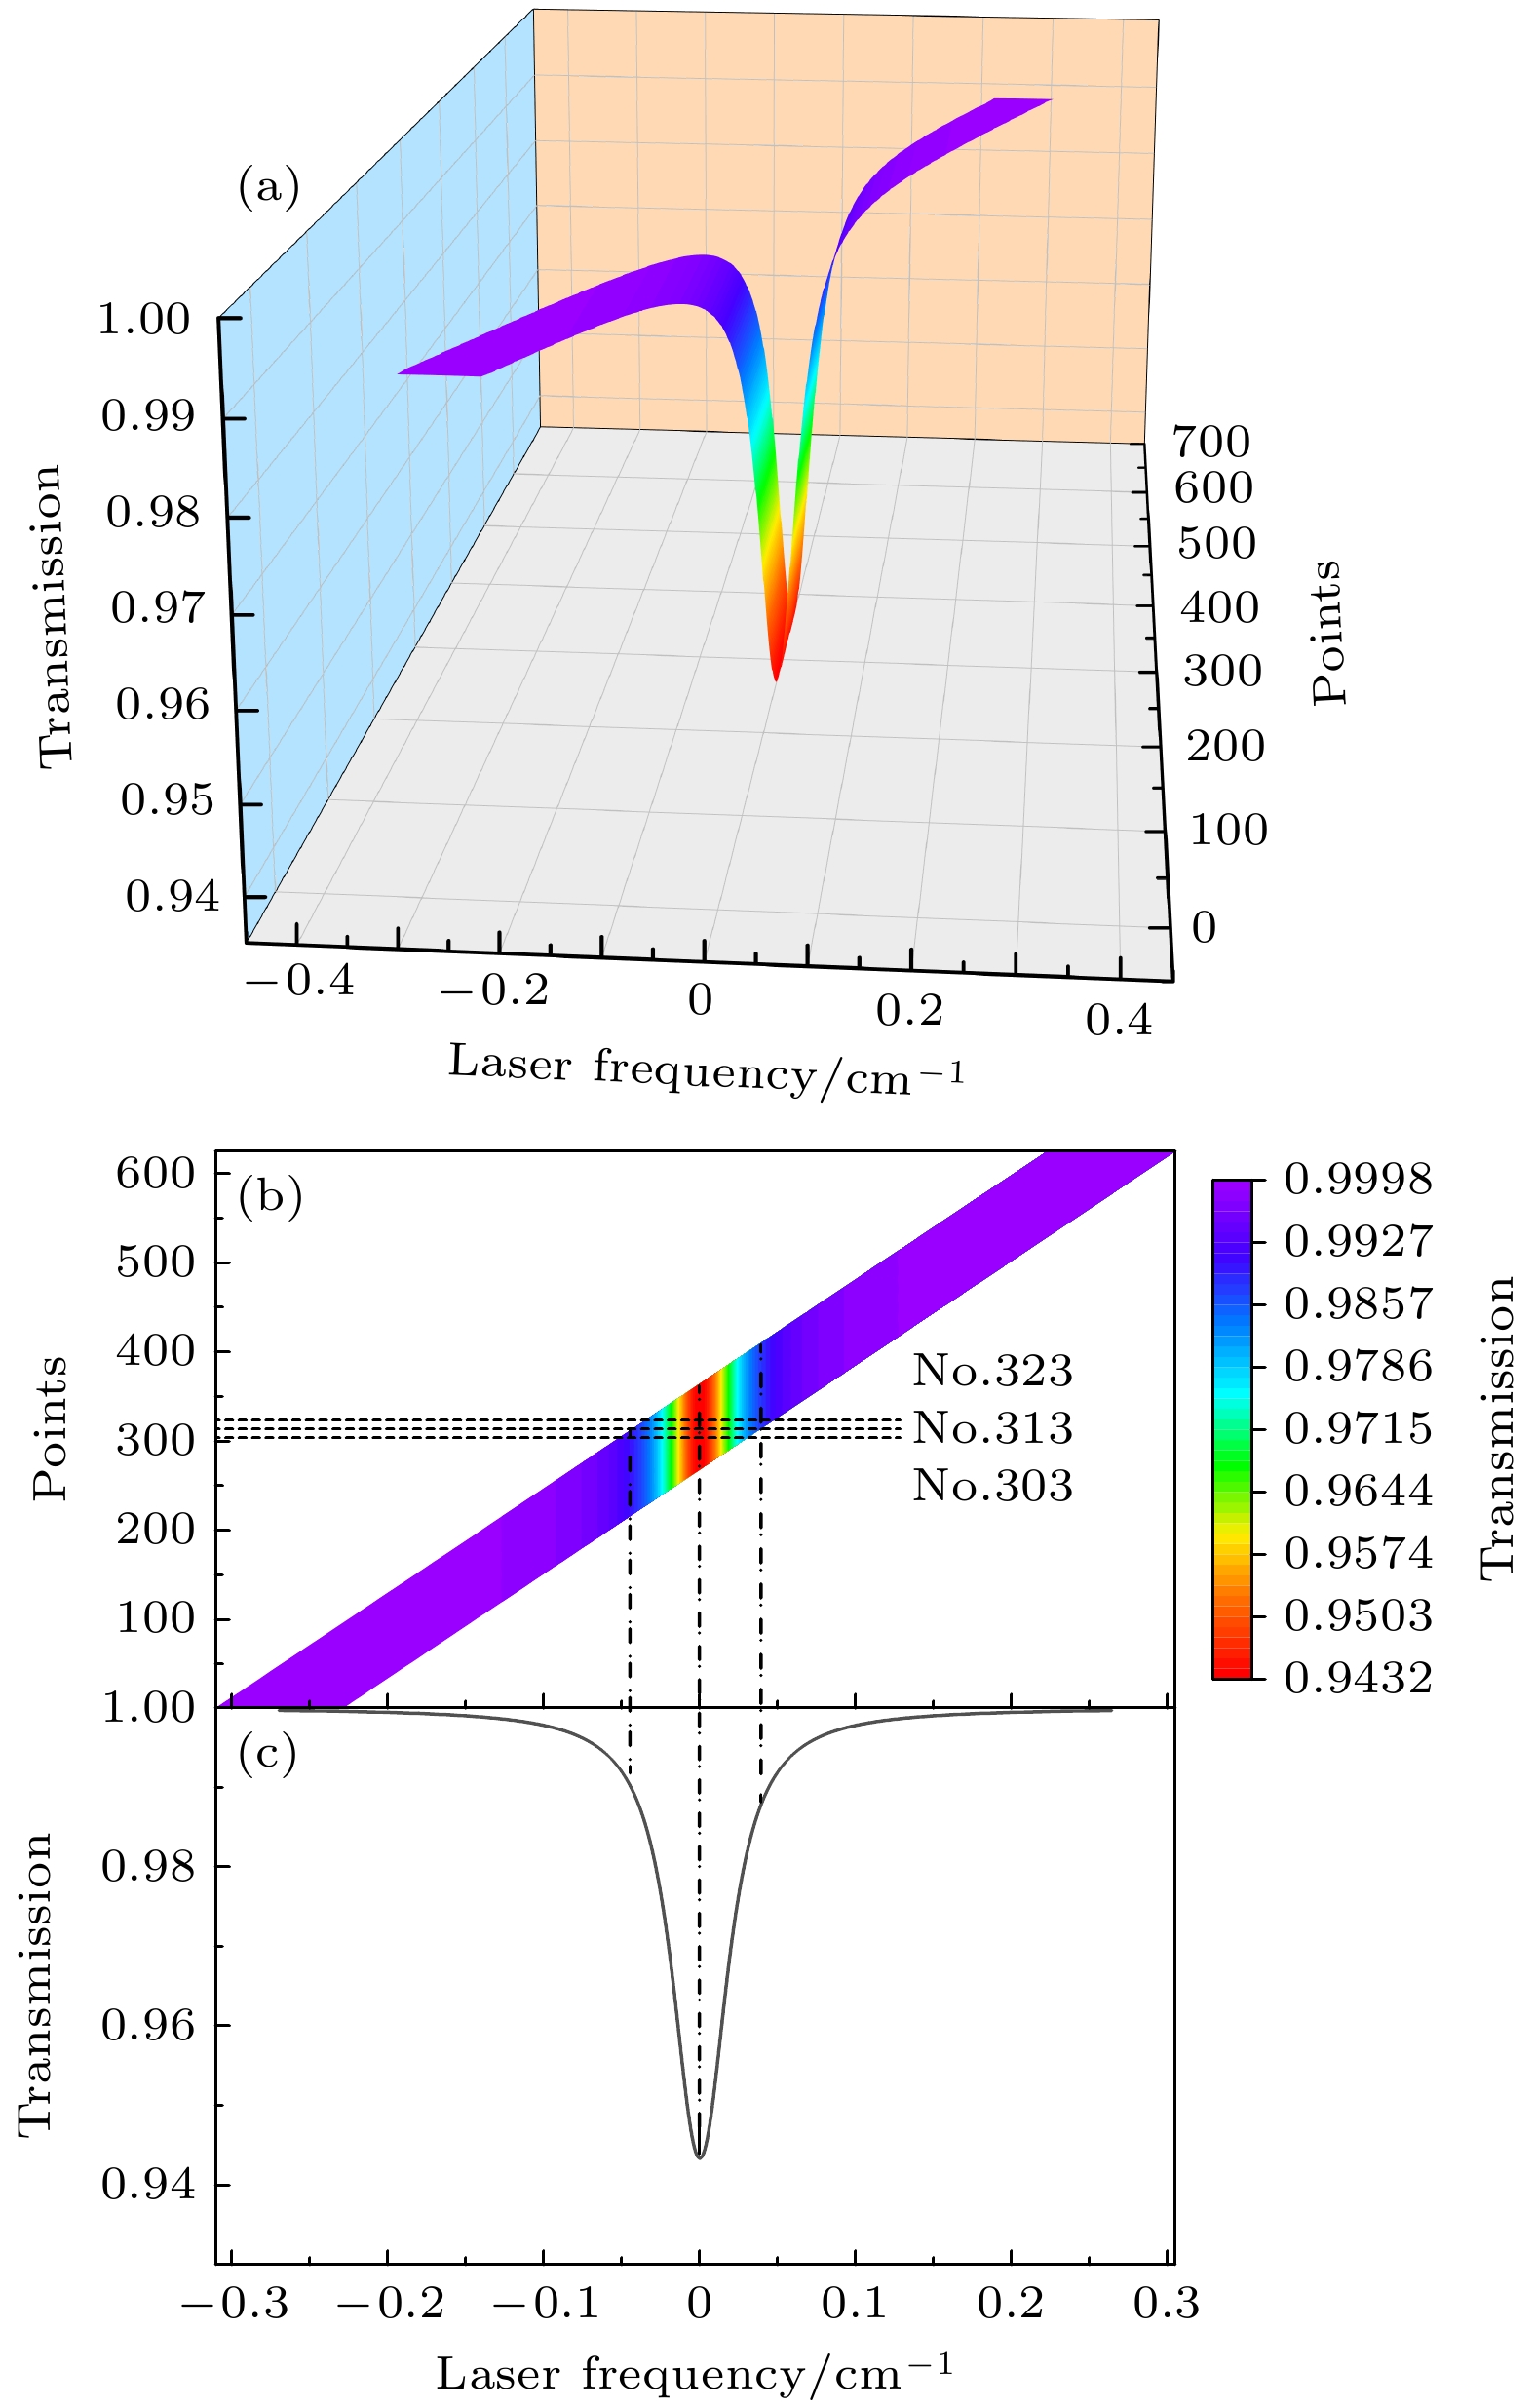
图 4 透过率数据矩阵 (a) 数据矩阵的三维曲面图; (b) 数据矩阵的等高图; (c) 透过率曲线
Fig. 4. Transmittance data matrix: (a) 3D surface diagram of data matrix; (b) contour map of the data matrix; (c) transmittance profile
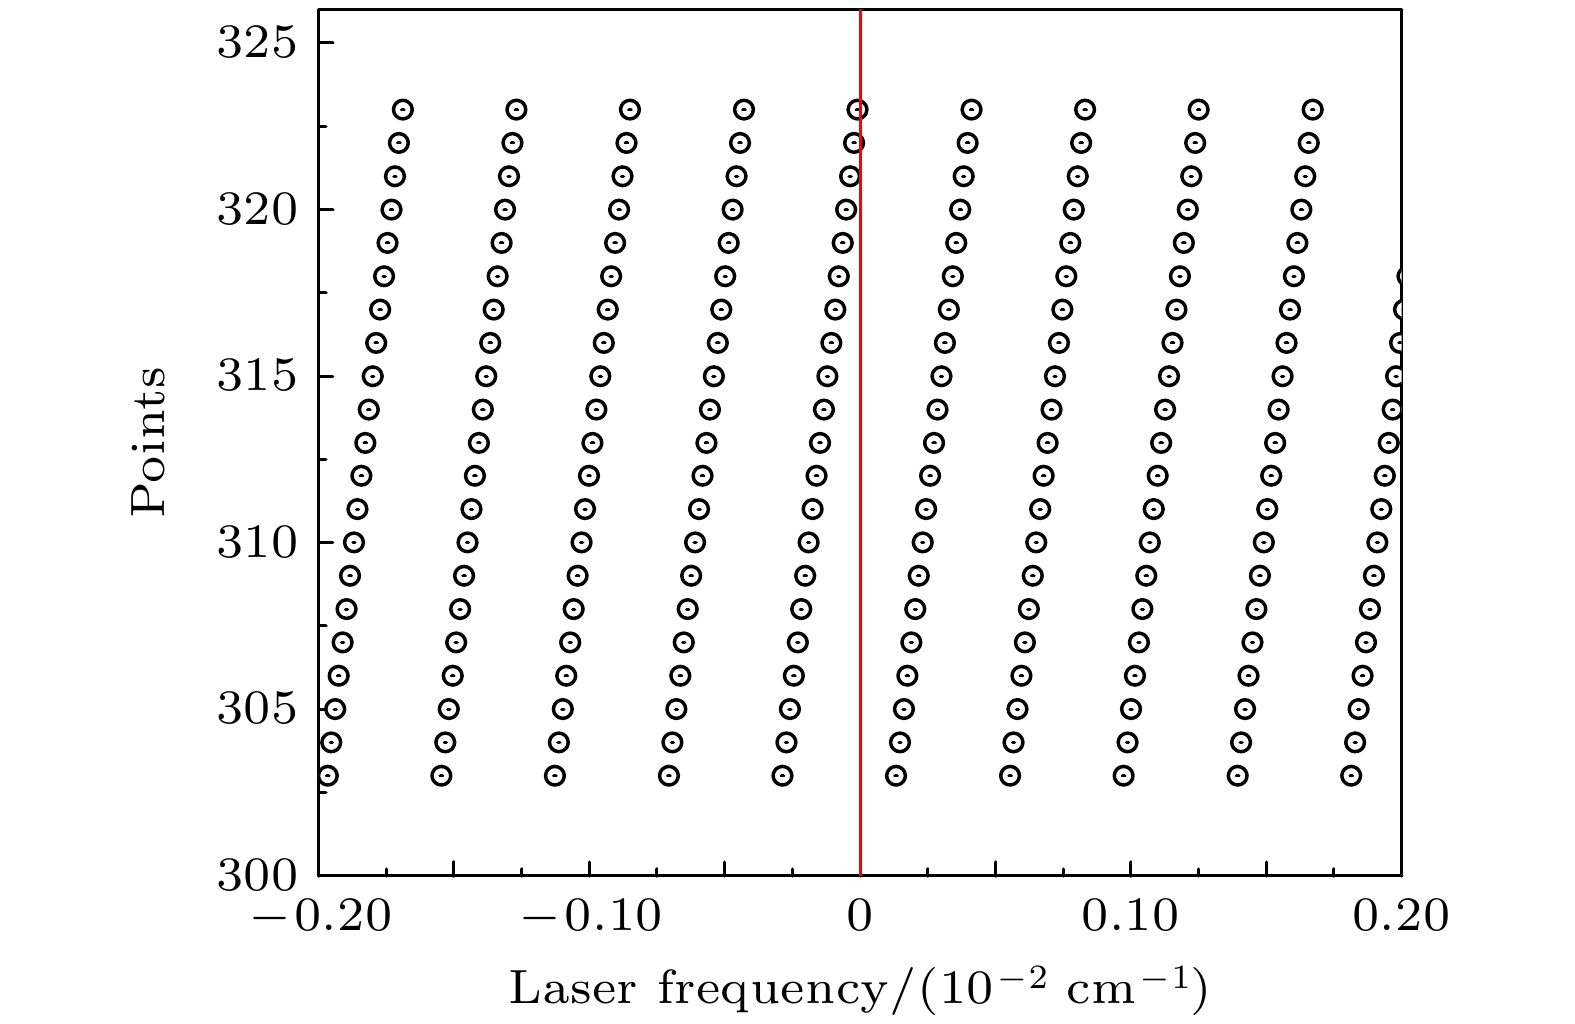
图 5 第303—323条透过率曲线在波长±2×10⁻³ cm–1范围内的点的波长散点示意图
Fig. 5. Scatter diagram of points in the wavelength range of ±2×10⁻³ cm–1 for the transmittance profile in Section 303–323.
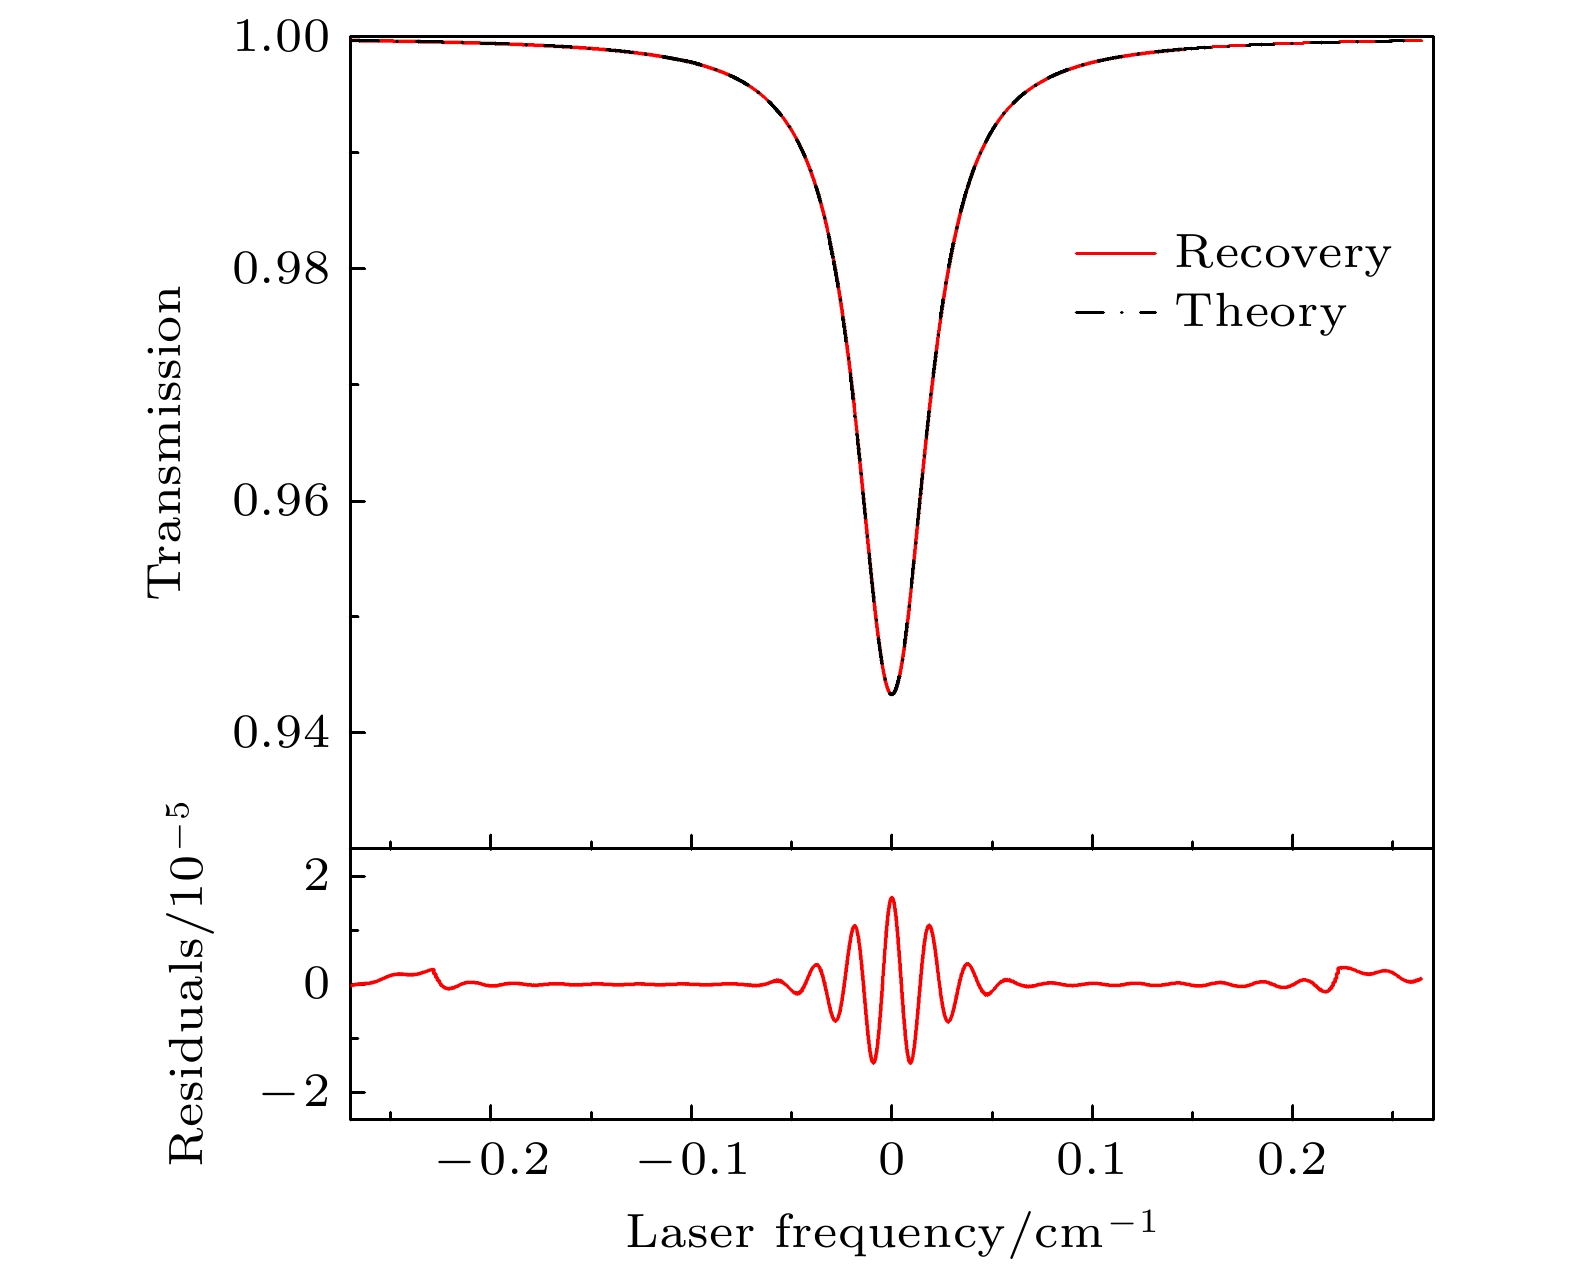
图 6 CO2单谱线重构透过率与透过率理论值及残差
Fig. 6. Reconstruction of the single spectral line transmittance and its theoretical value, as well as the residual.
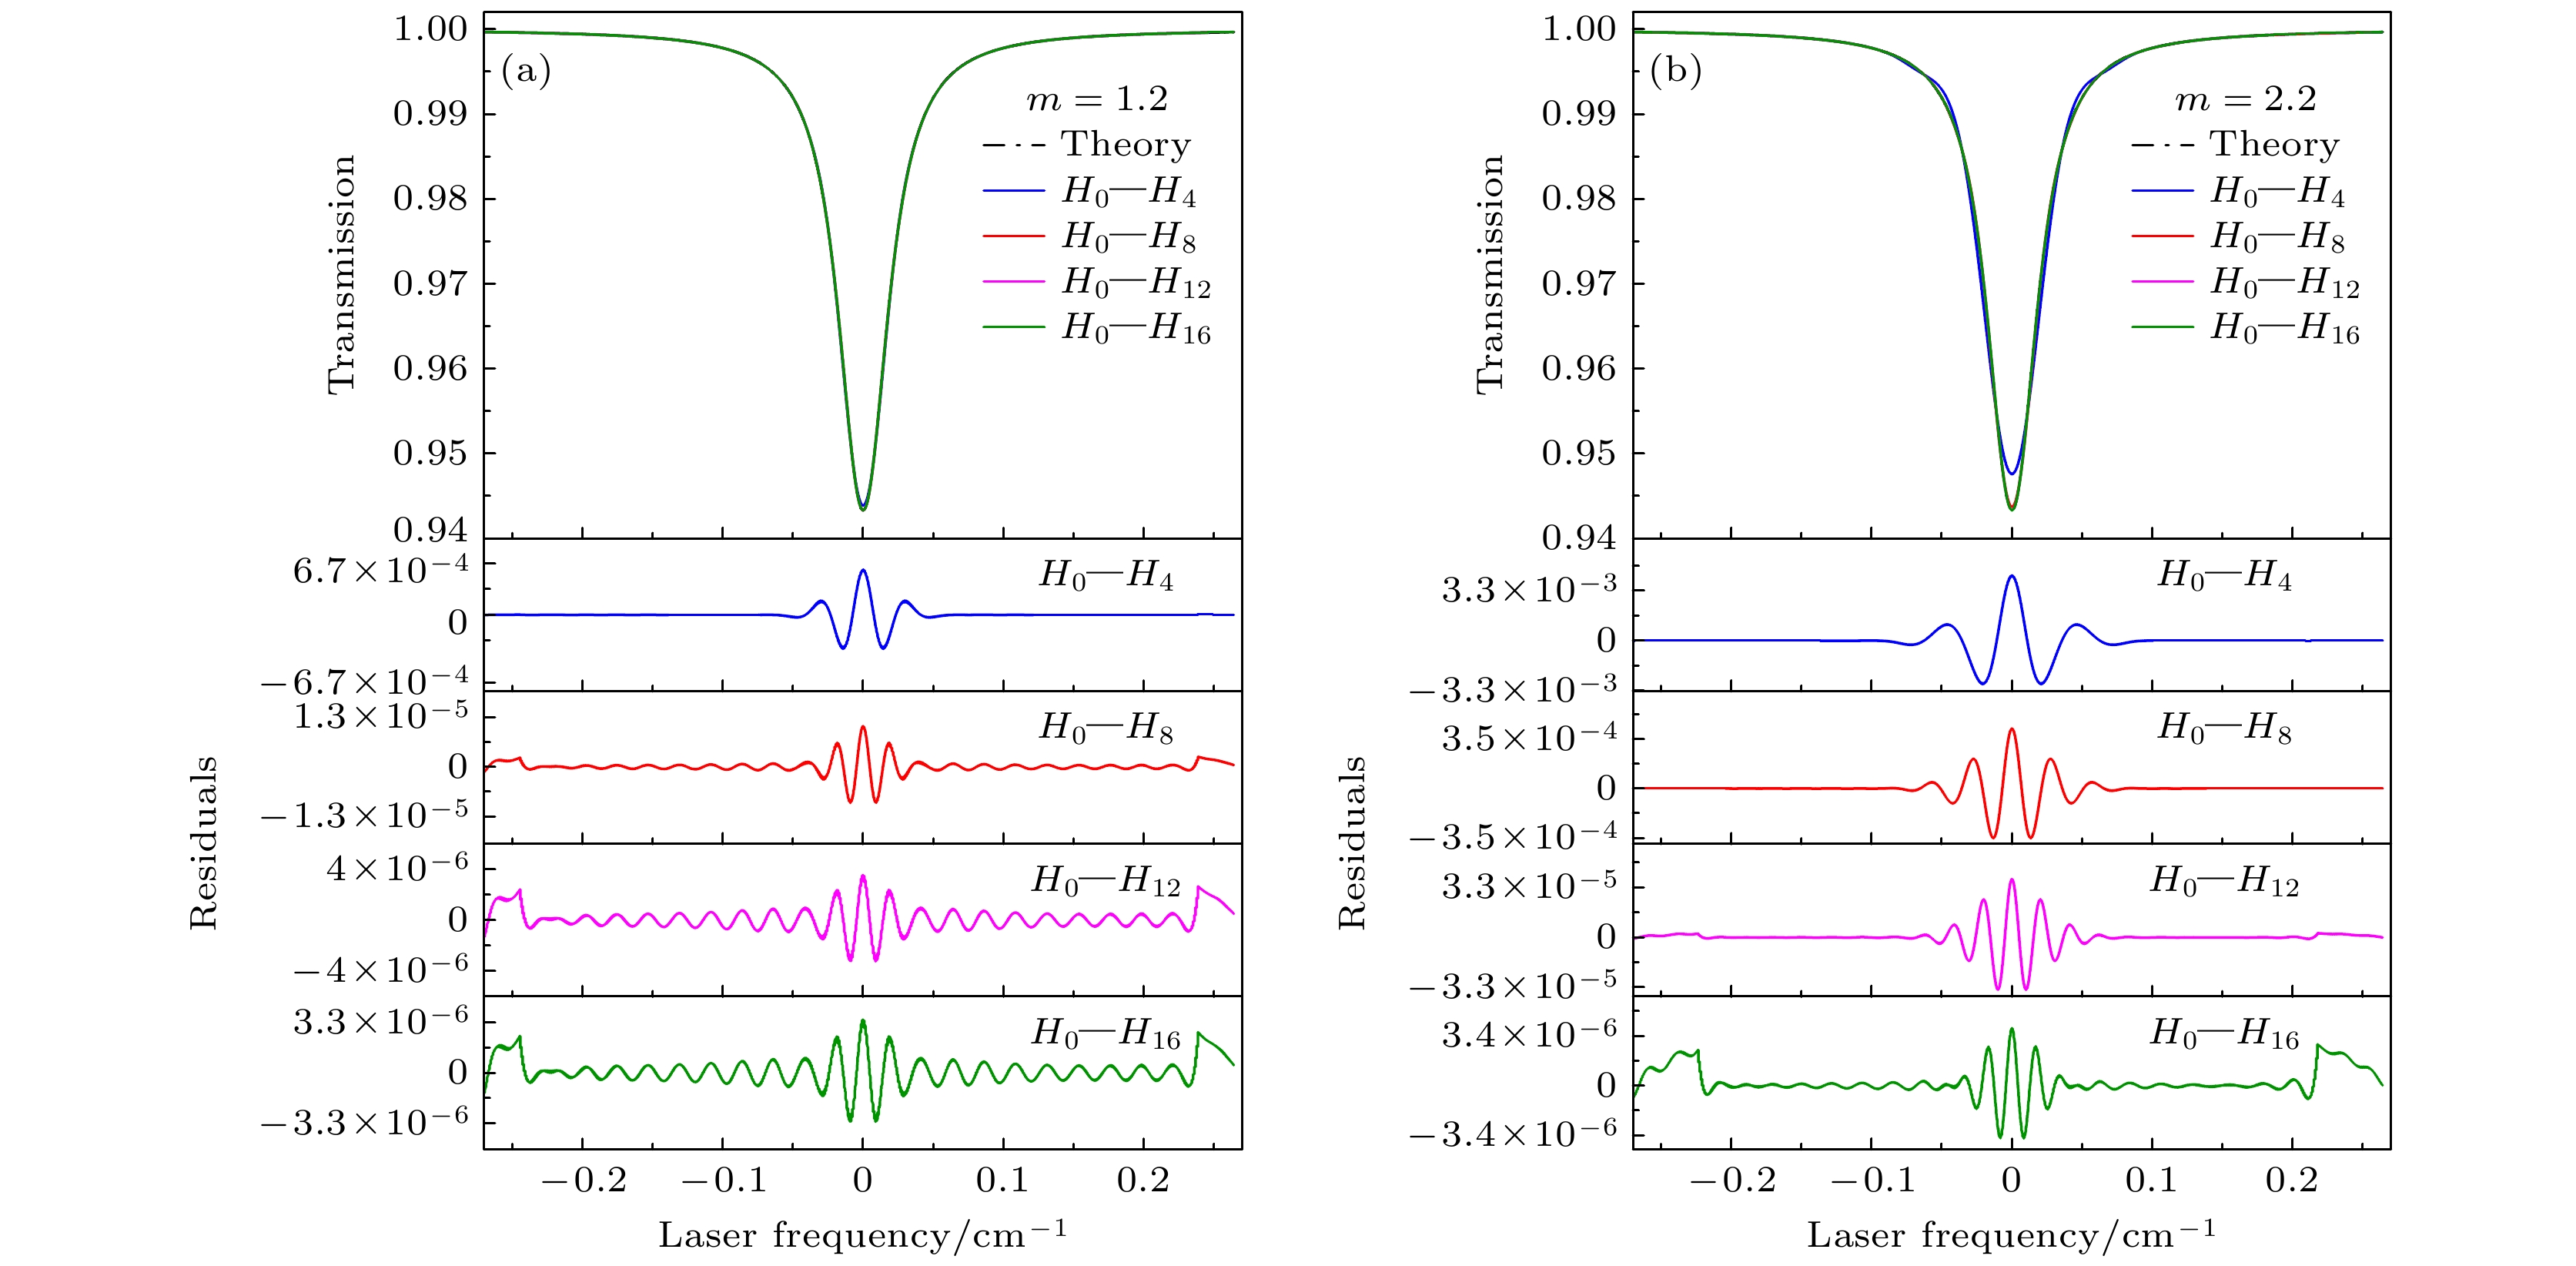
图 7 不同调制深度下, 不同谐波阶次重构透射率及其误差 (a) m = 1.2; (b) m = 2.2
Fig. 7. Reconstructed transmittance and error analysis for different harmonic orders at various modulation depths: (a) m = 1.2; (b) m = 2.2.
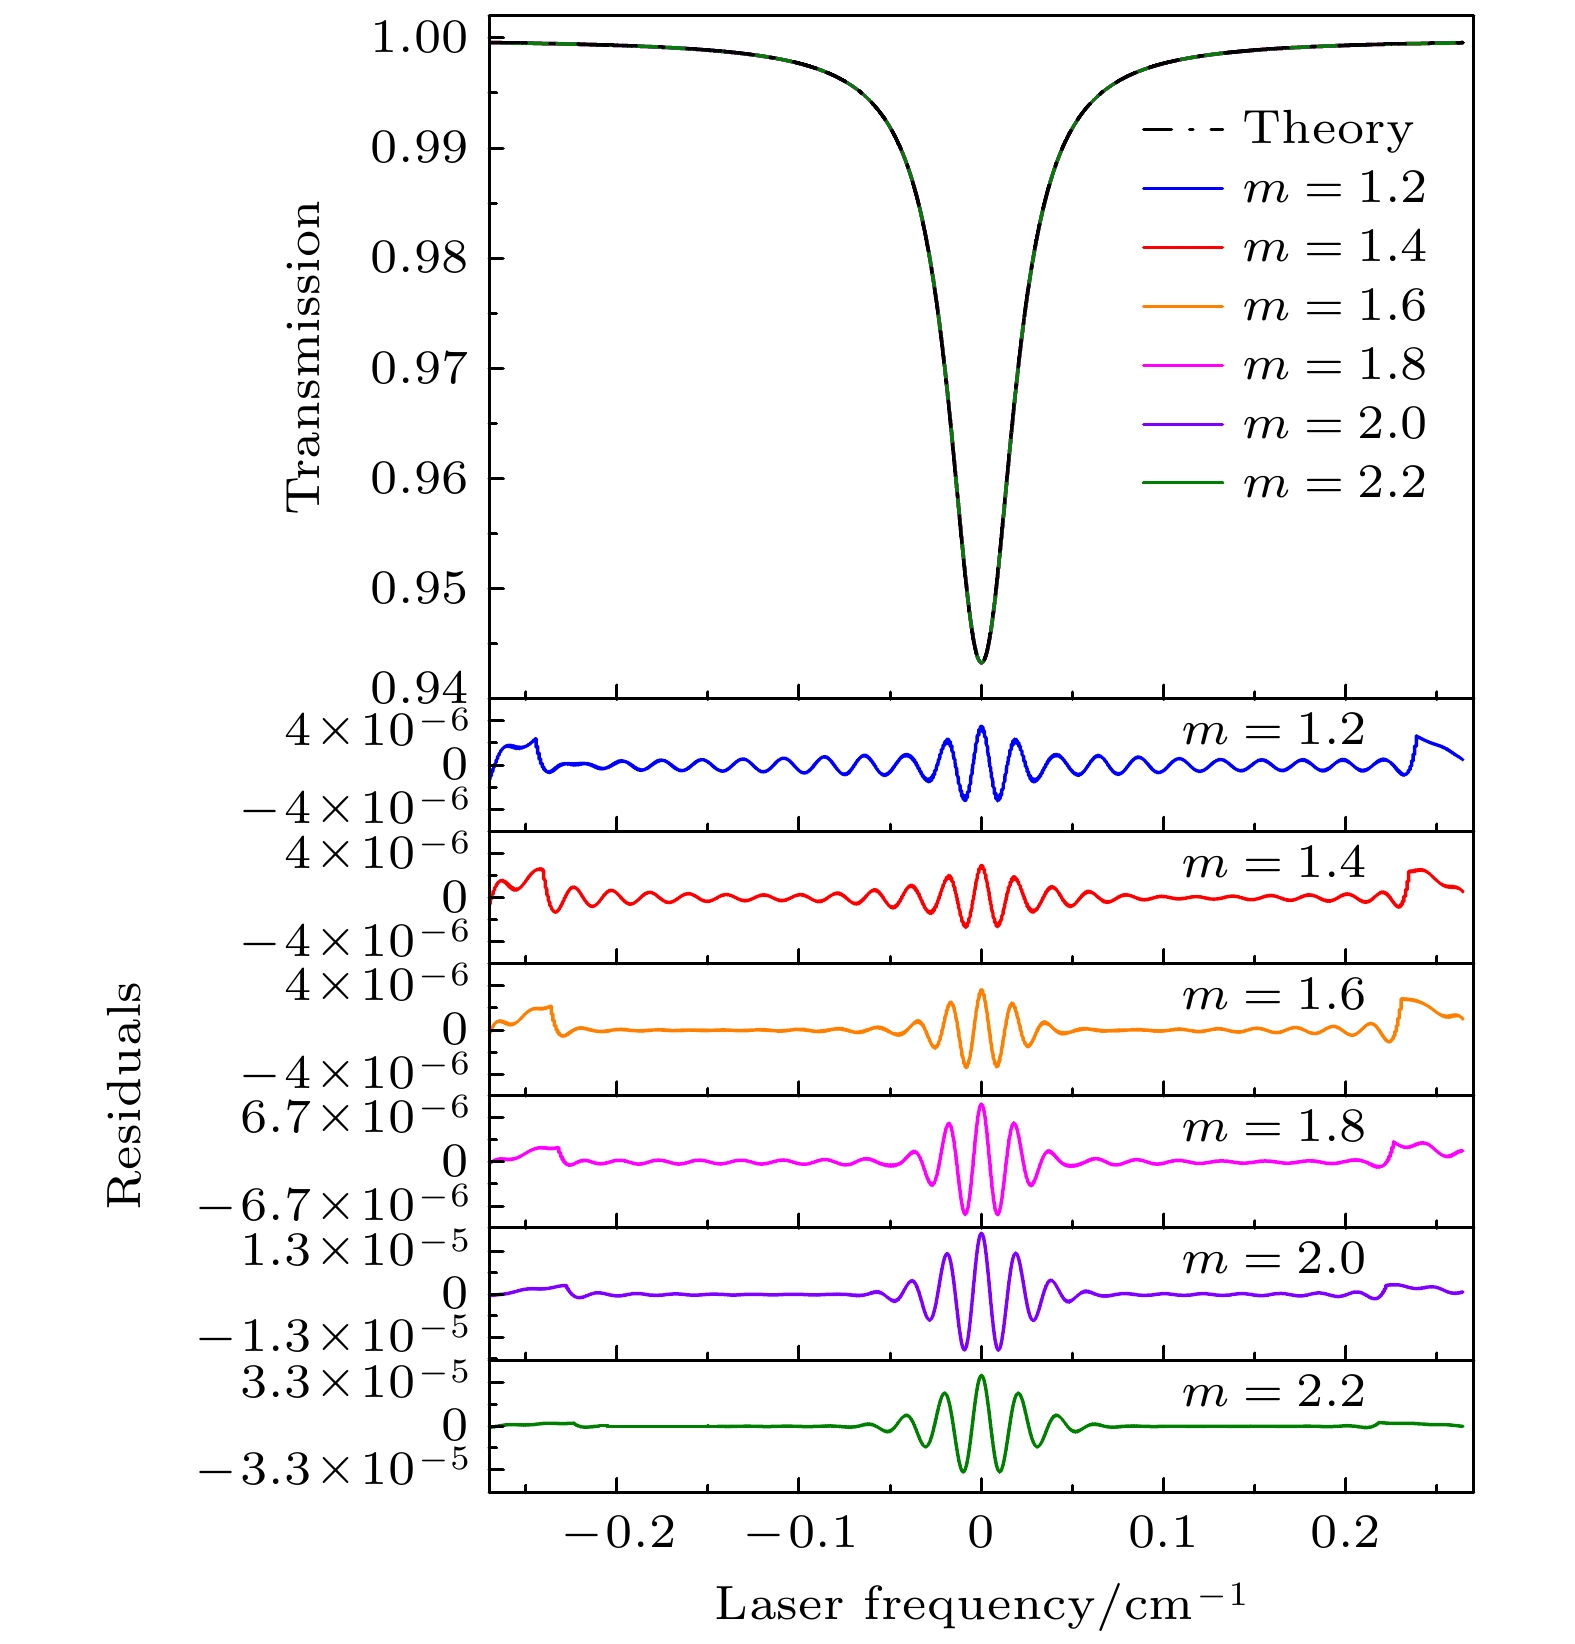
图 8 六种不同调制深度下重构透射率及其误差
Fig. 8. Reconstructed transmittance and its associated error for six distinct modulation depths.
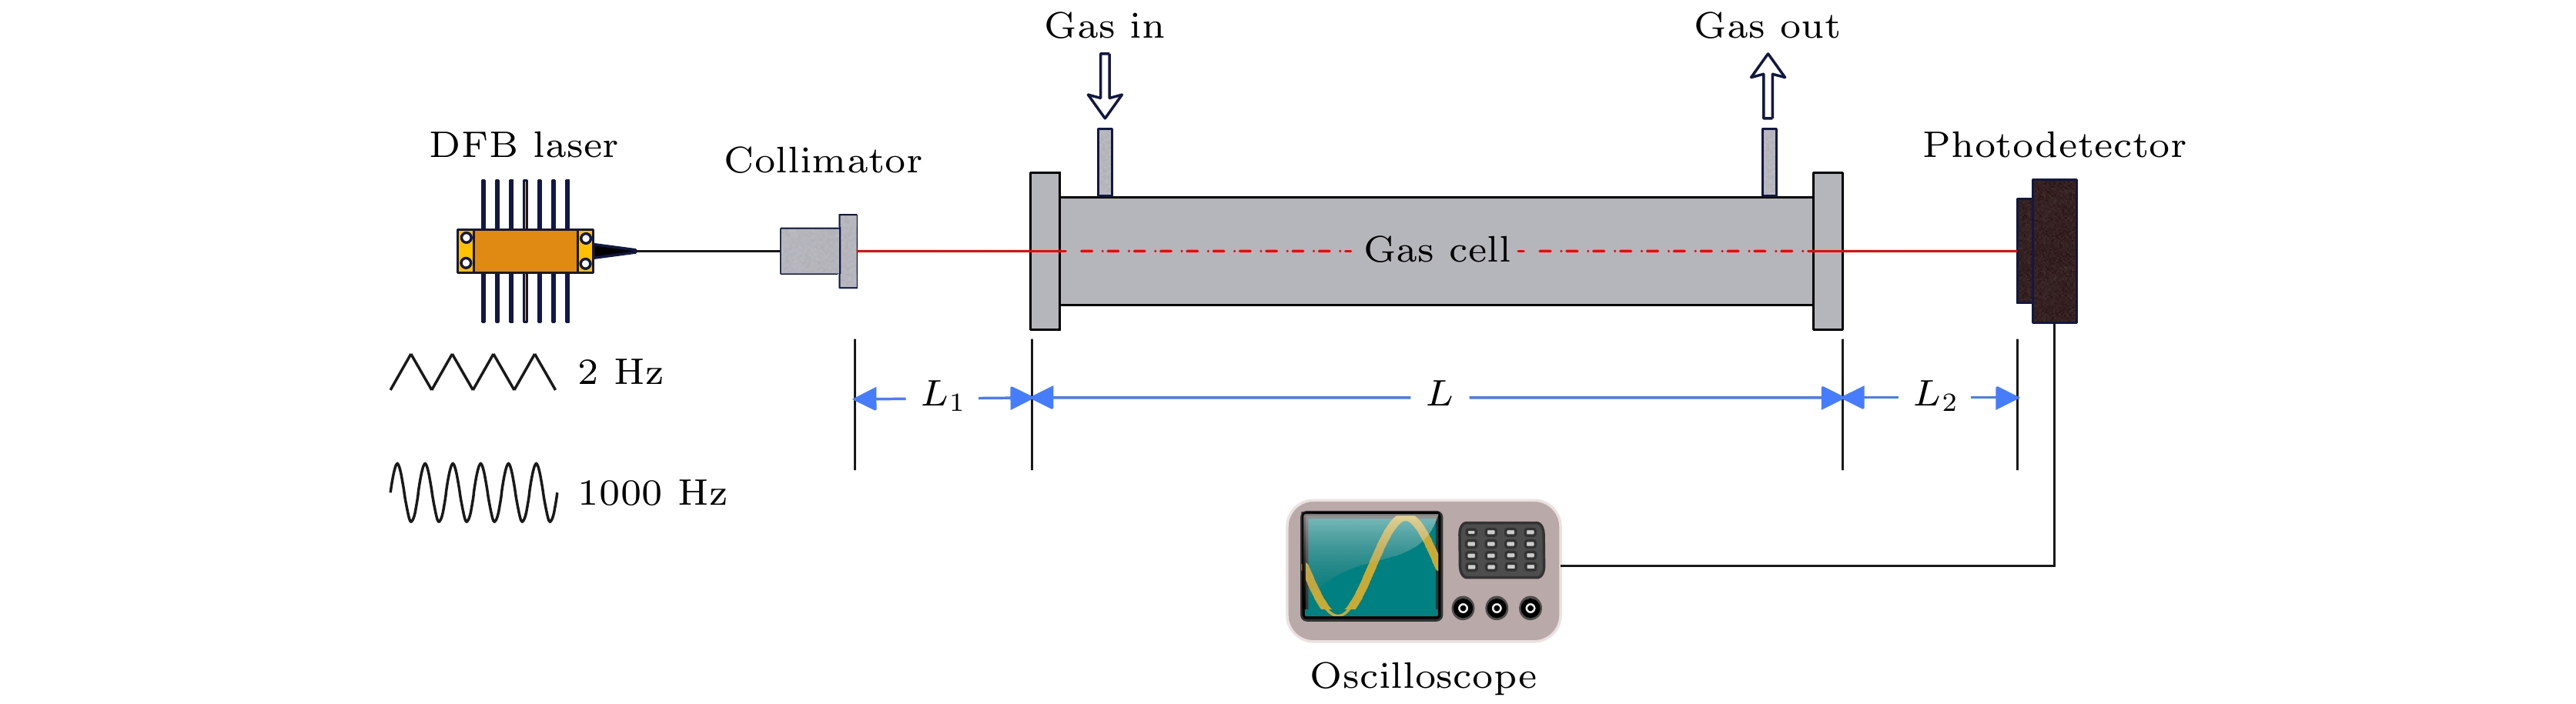
图 9 分时测量方案实验装置示意图
Fig. 9. Experimental device schematic of a time-sharing measurement scheme.
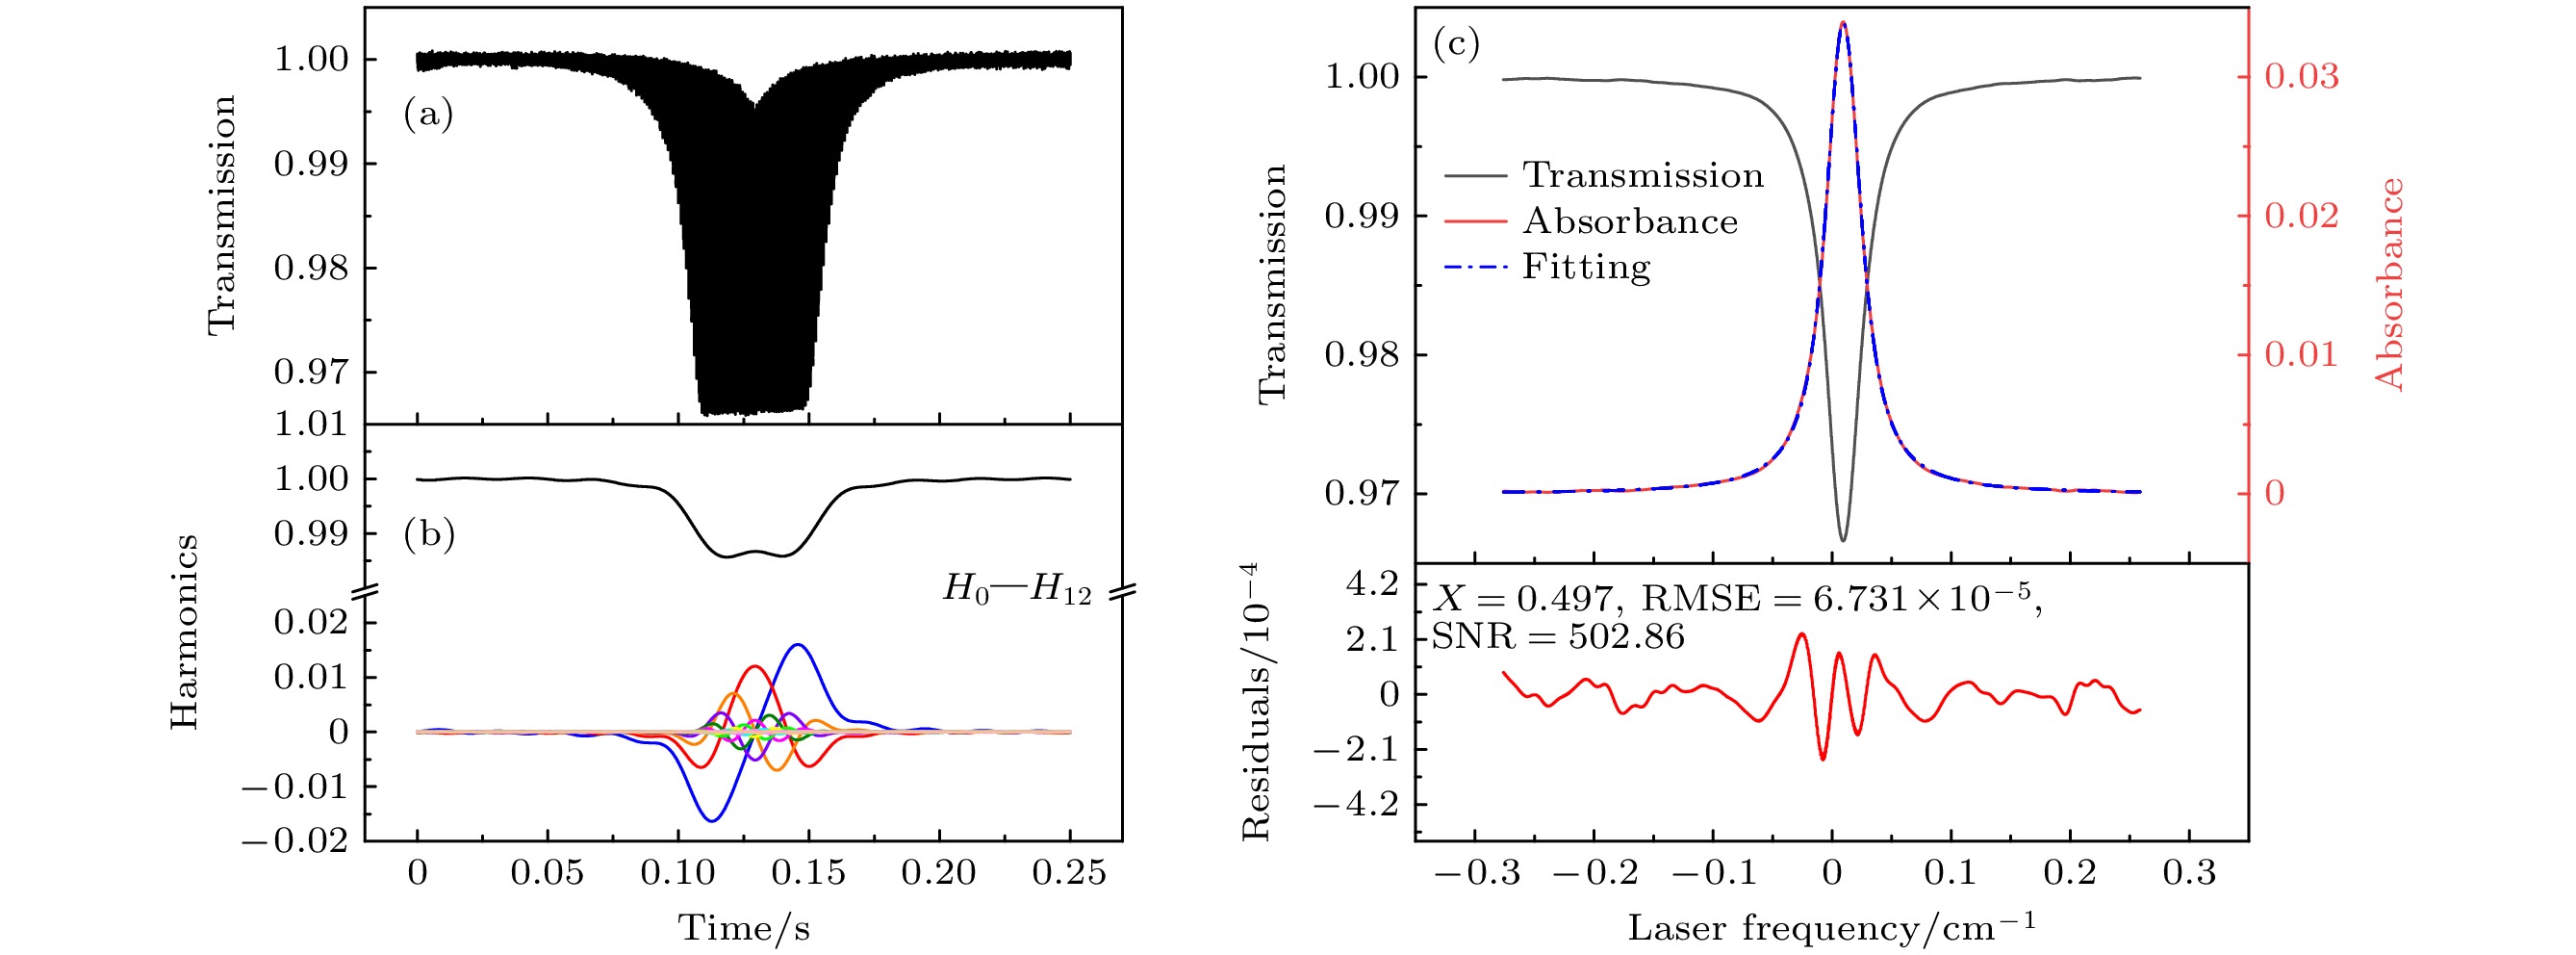
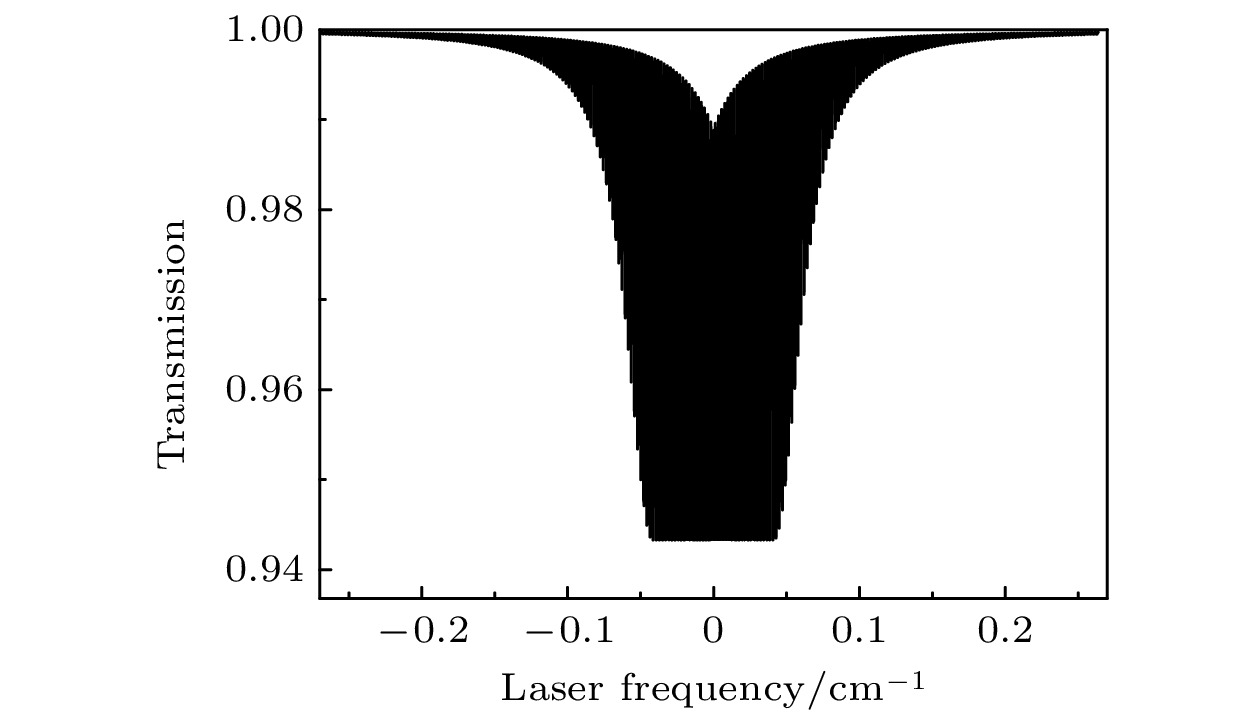
图 10 经1次稀释后的CO2标气6330.821 cm–1谱线吸收率函数重构结果 (a) 透过率随时间的变化; (b) H0—H12次谐波信号; (c)重构得到的透过率、吸收率及其拟合残差
Fig. 10. Reconstruction of the absorption profile for the spectral line at 6330.821 cm–1 of CO2 standard gas following a single dilution: (a) The temporal evolution of transmittance; (b) harmonic signals from H0 to H12; (c) reconstructed transmittance, absorbance and its fitting residuals.
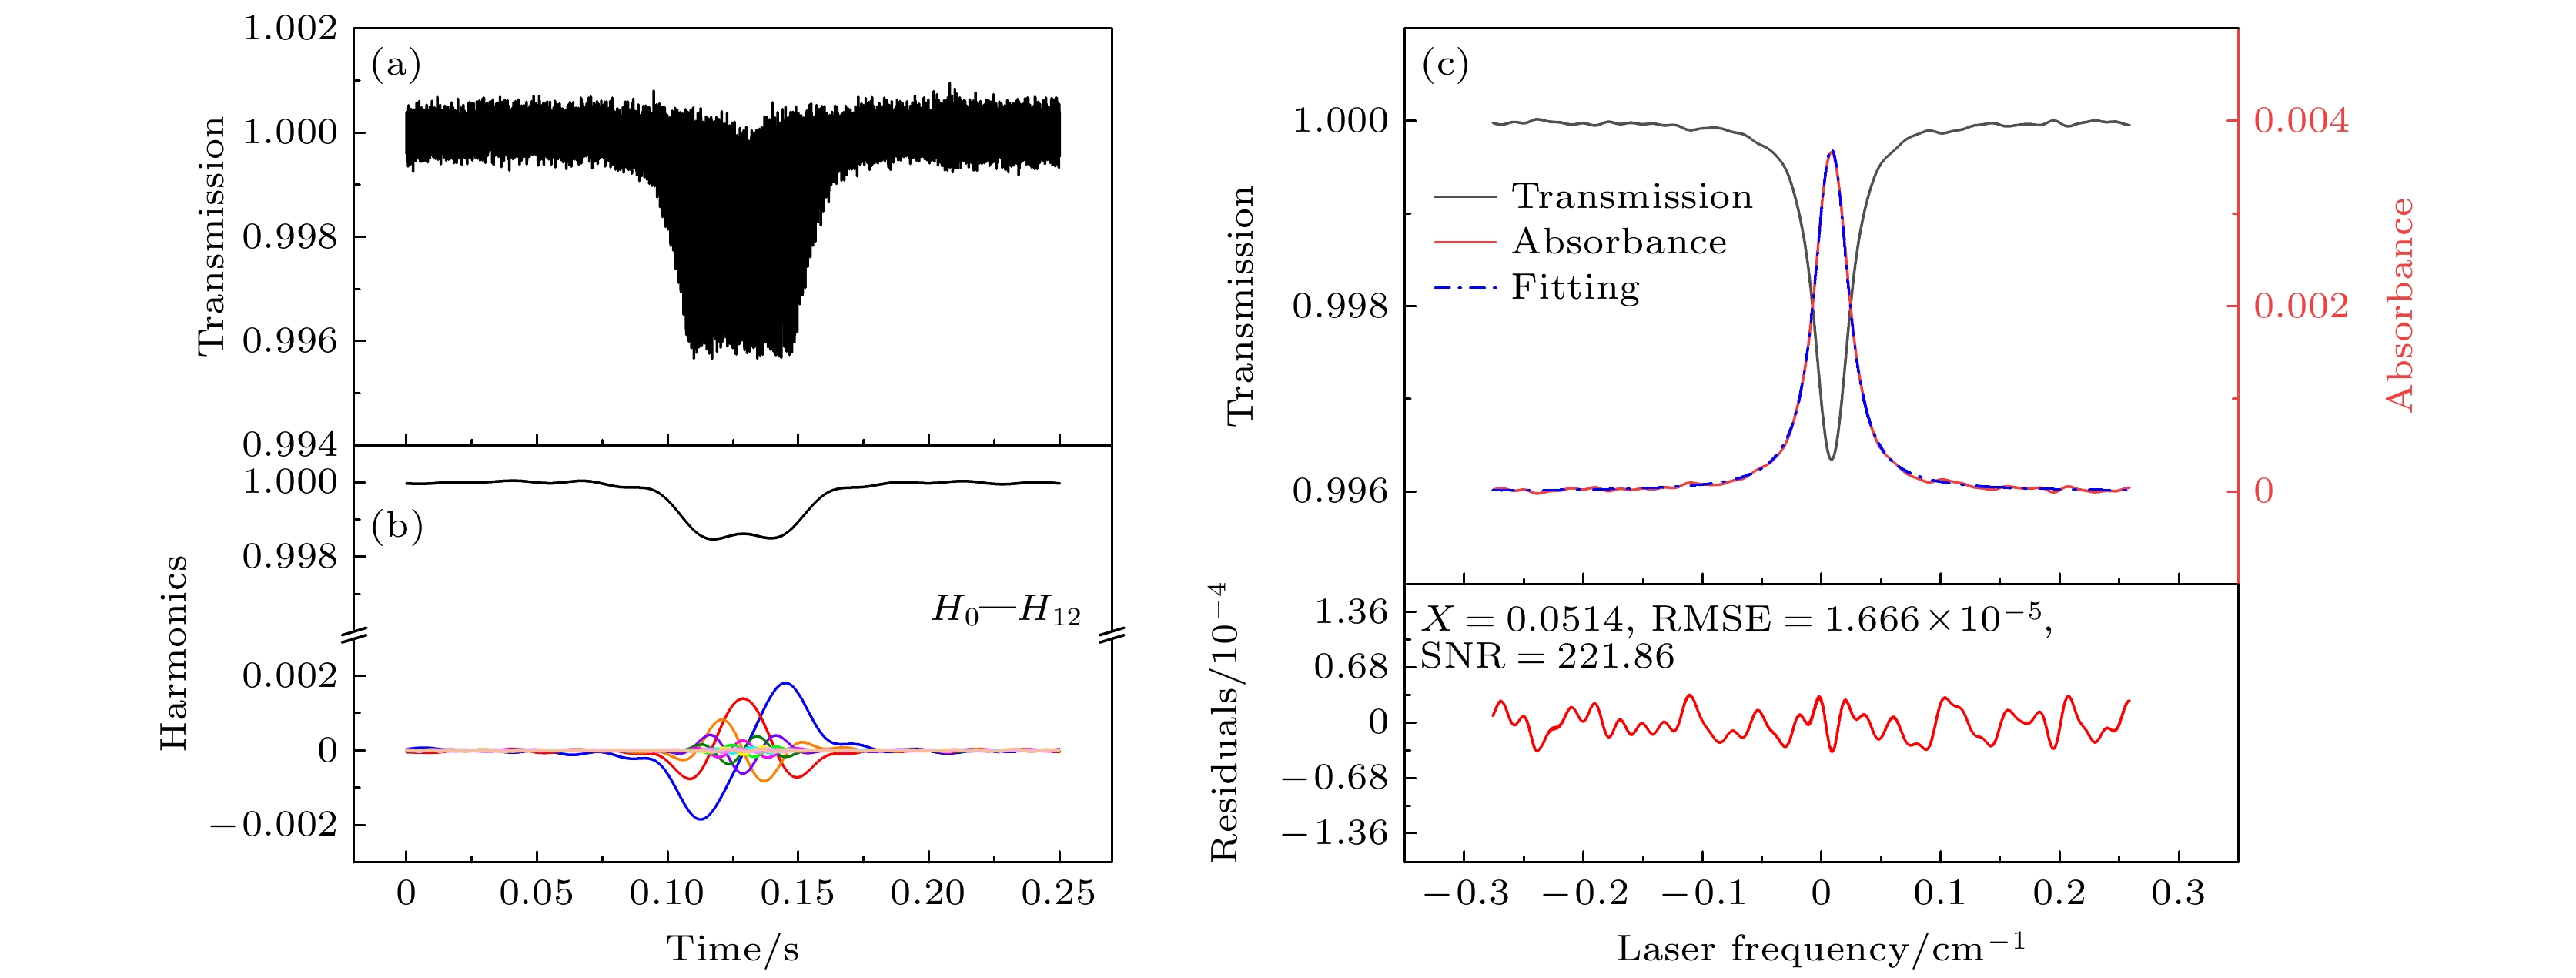
图 11 经4次稀释后的CO2标气6330.821 cm–1谱线吸收率函数重构结果 (a) 透过率随时间的变化; (b) H0—H12次谐波信号; (c)重构得到的透过率、吸收率及其拟合残差
Fig. 11. Reconstruction of the absorption profile for the spectral line at 6330.821 cm–1 of CO2 standard gas after being diluted four times: (a) The temporal evolution of transmittance; (b) harmonic signals from H0 to H12; (c) reconstructed transmittance, absorbance and its fitting residuals.
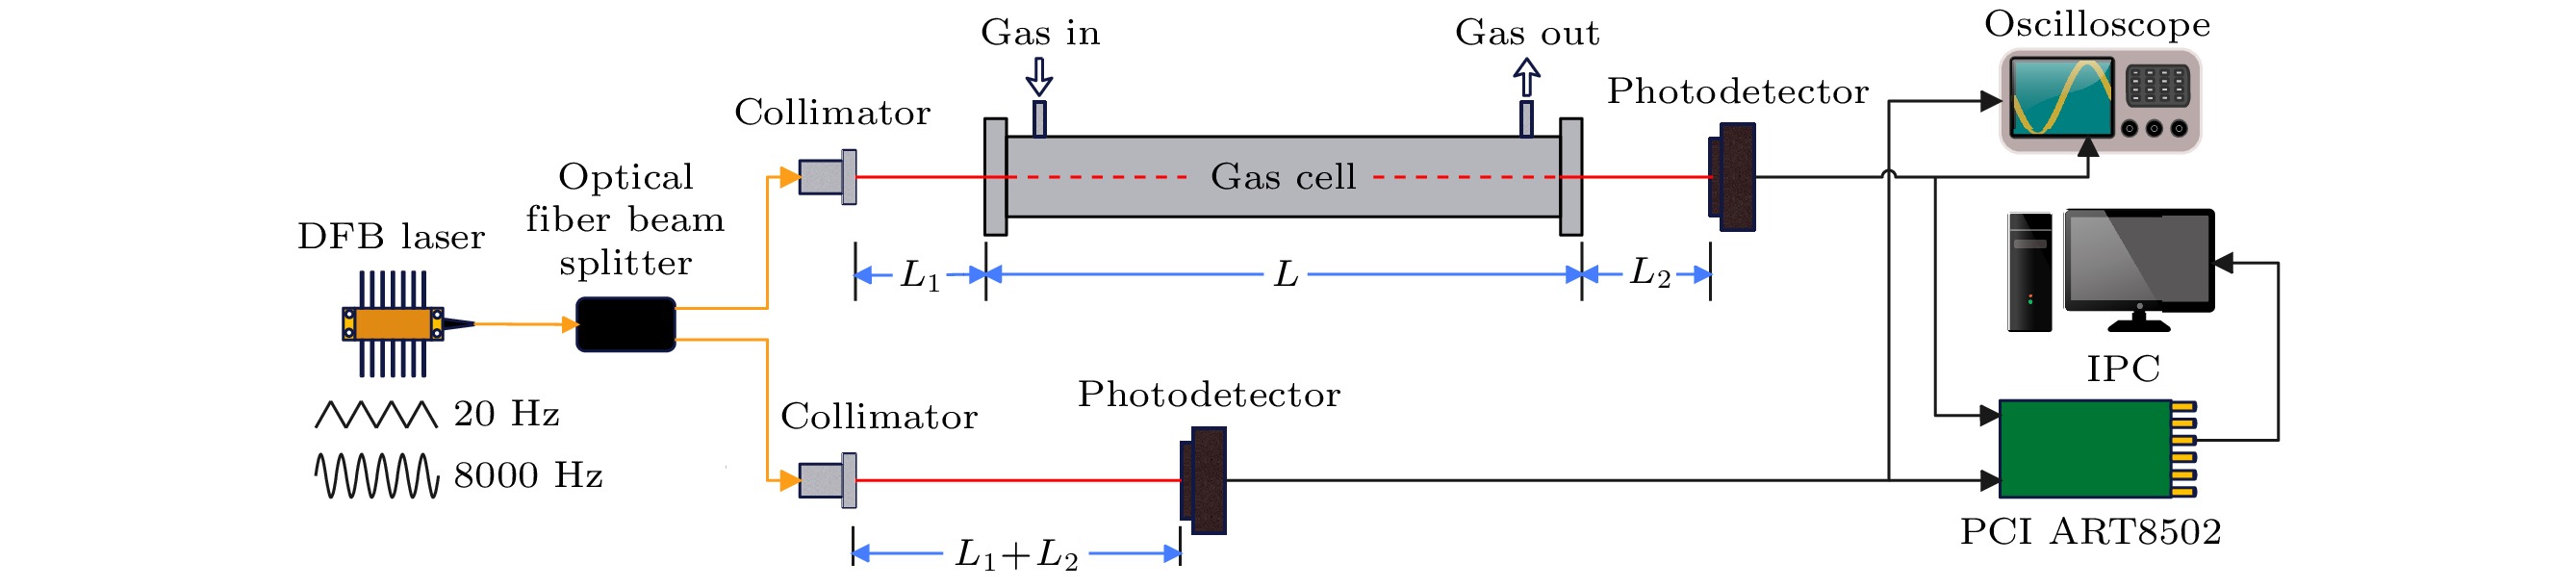
图 12 分束测量方案的实验装置示意图
Fig. 12. Schematic representation of the experimental setup for beam splitting measurement scheme.
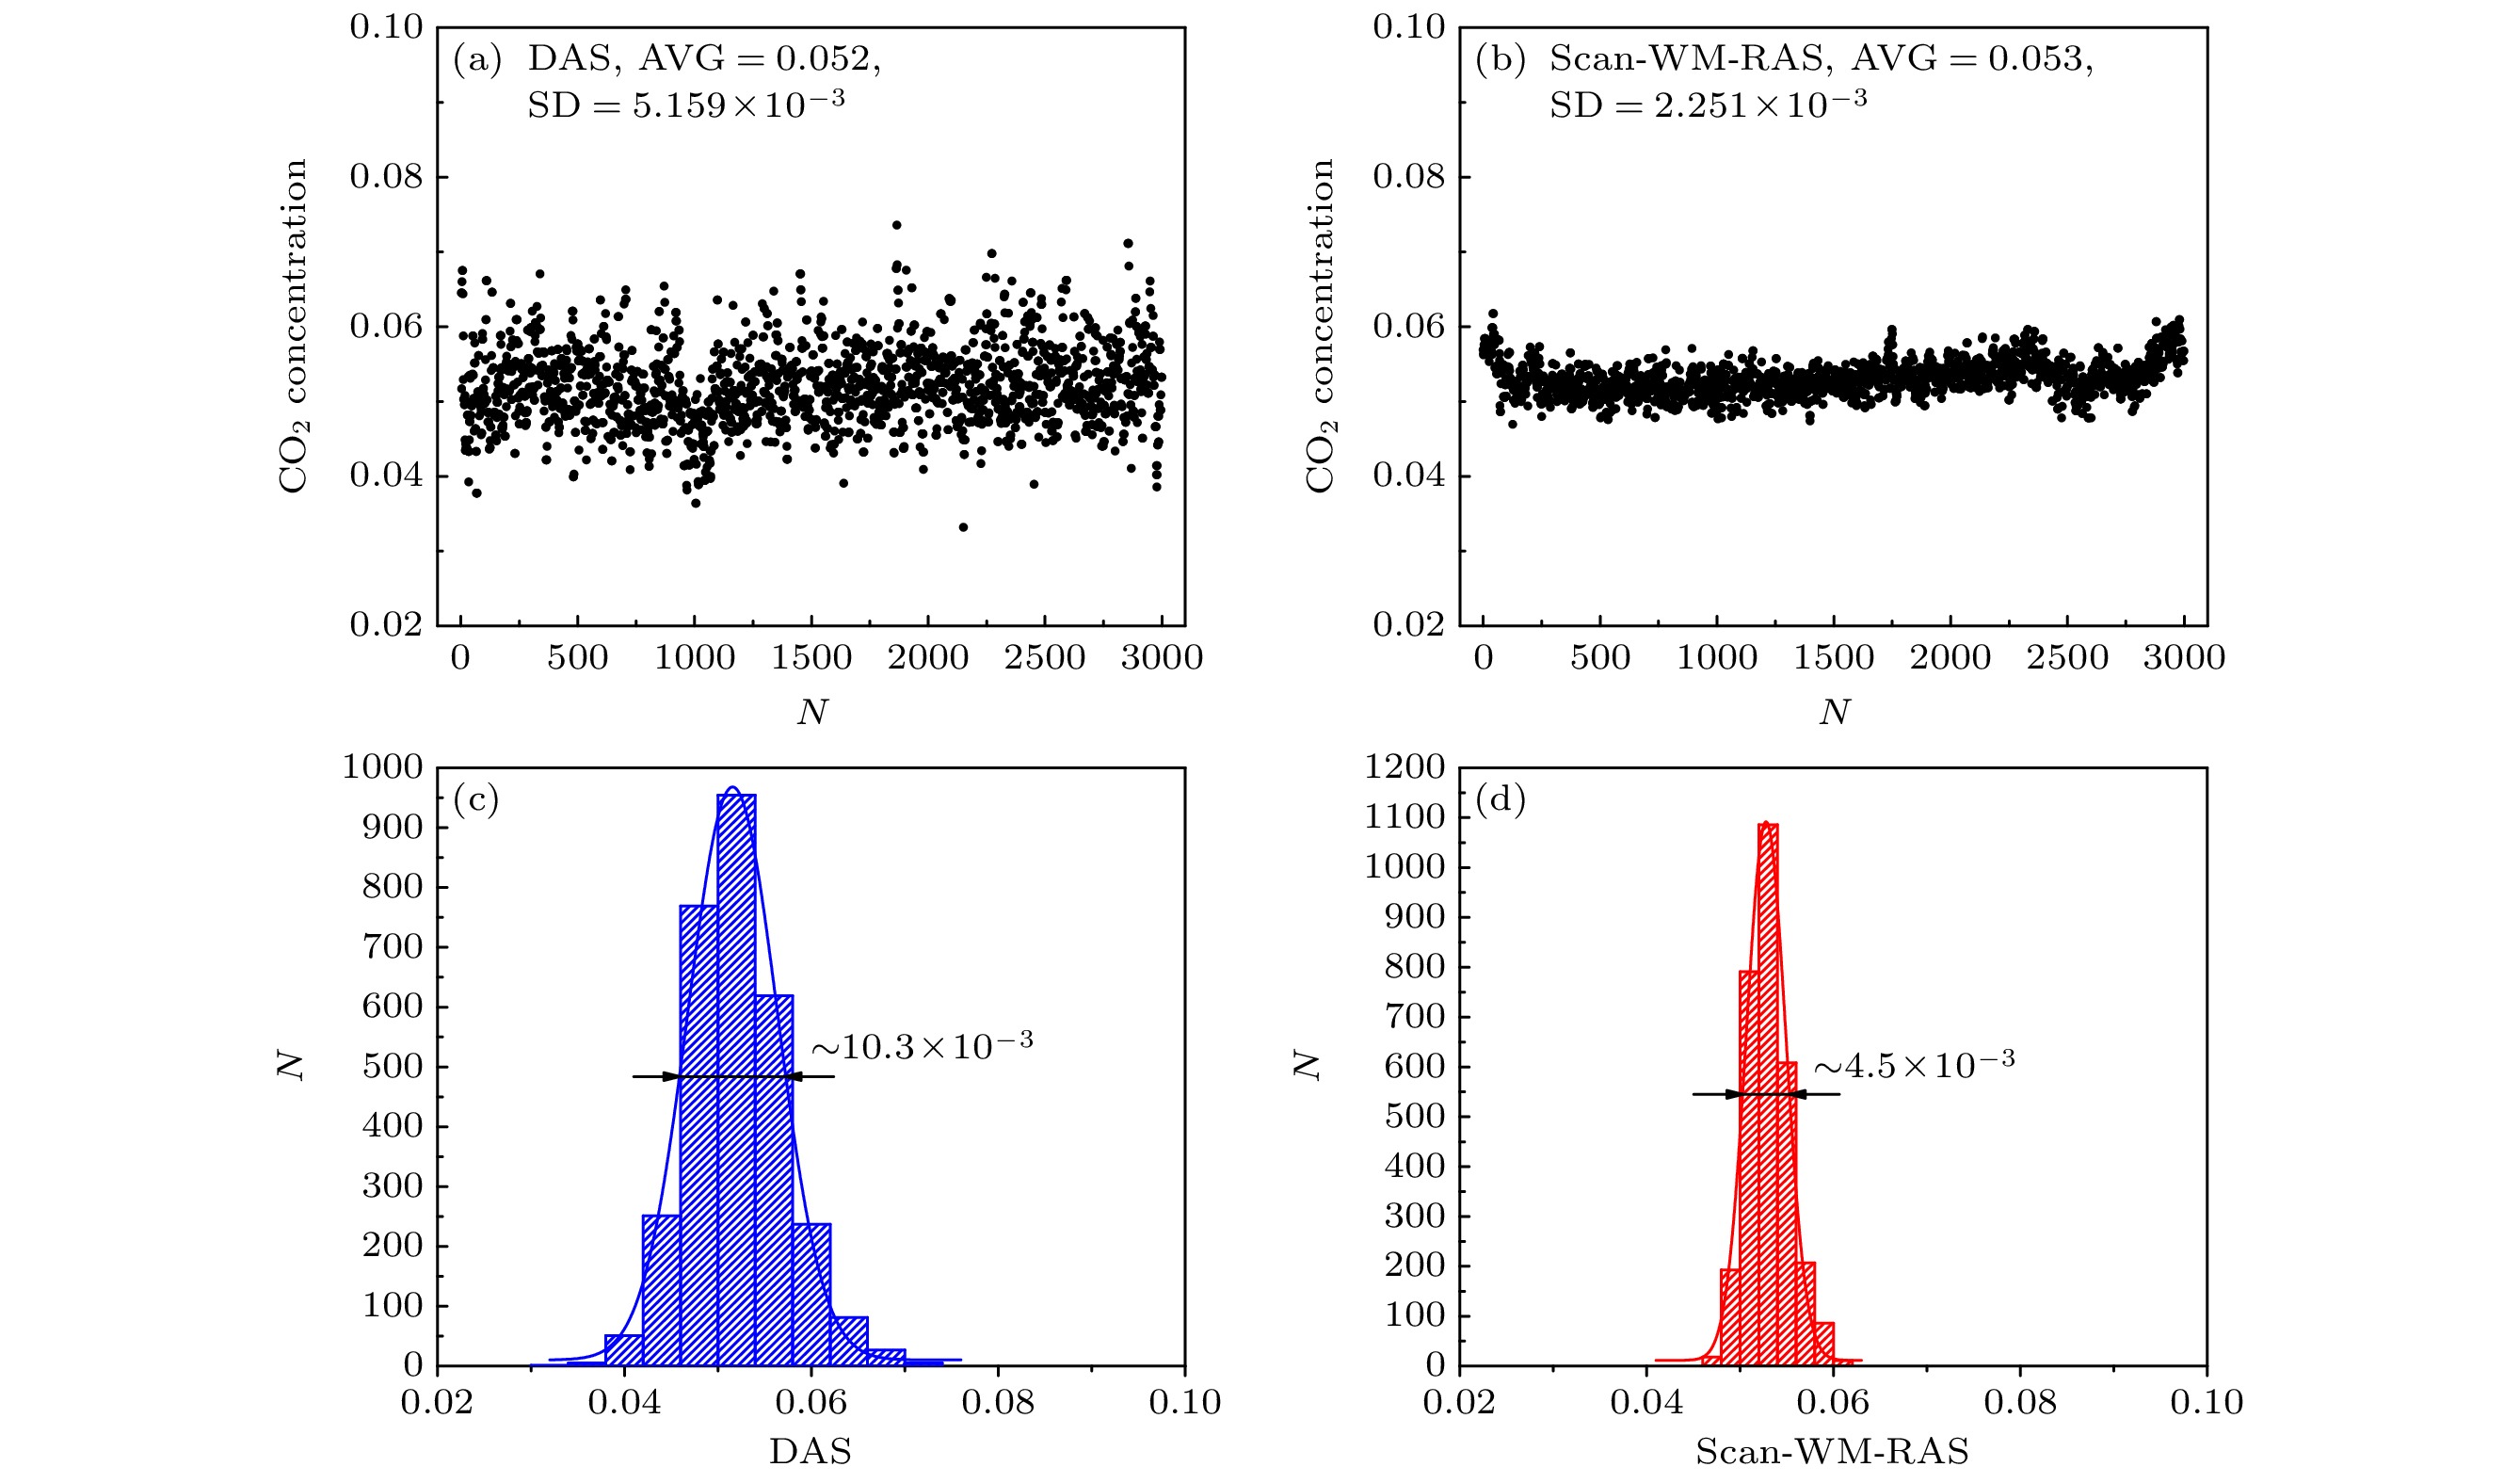
图 13 稀释1/16的CO2标气3000次连续在线浓度测量结果, 及其统计分布对比 (a) DAS的浓度测量结果; (b) Scan-WM-RAS的浓度测量结果; (c) DAS的浓度统计分布; (d) Scan-WM-RAS的浓度统计分布
Fig. 13. Results of 3000 continuous online concentration measurements of CO2 standard gas diluted at a ratio of 1/16 and their statistical distribution comparison: (a) The results of concentration measurements through DAS; (b) the results of concentration measurements through Scan-WM-RAS; (c) the statistical distribution of concentration through DAS; (d) the statistical distribution of concentration through Scan-WM-RAS.
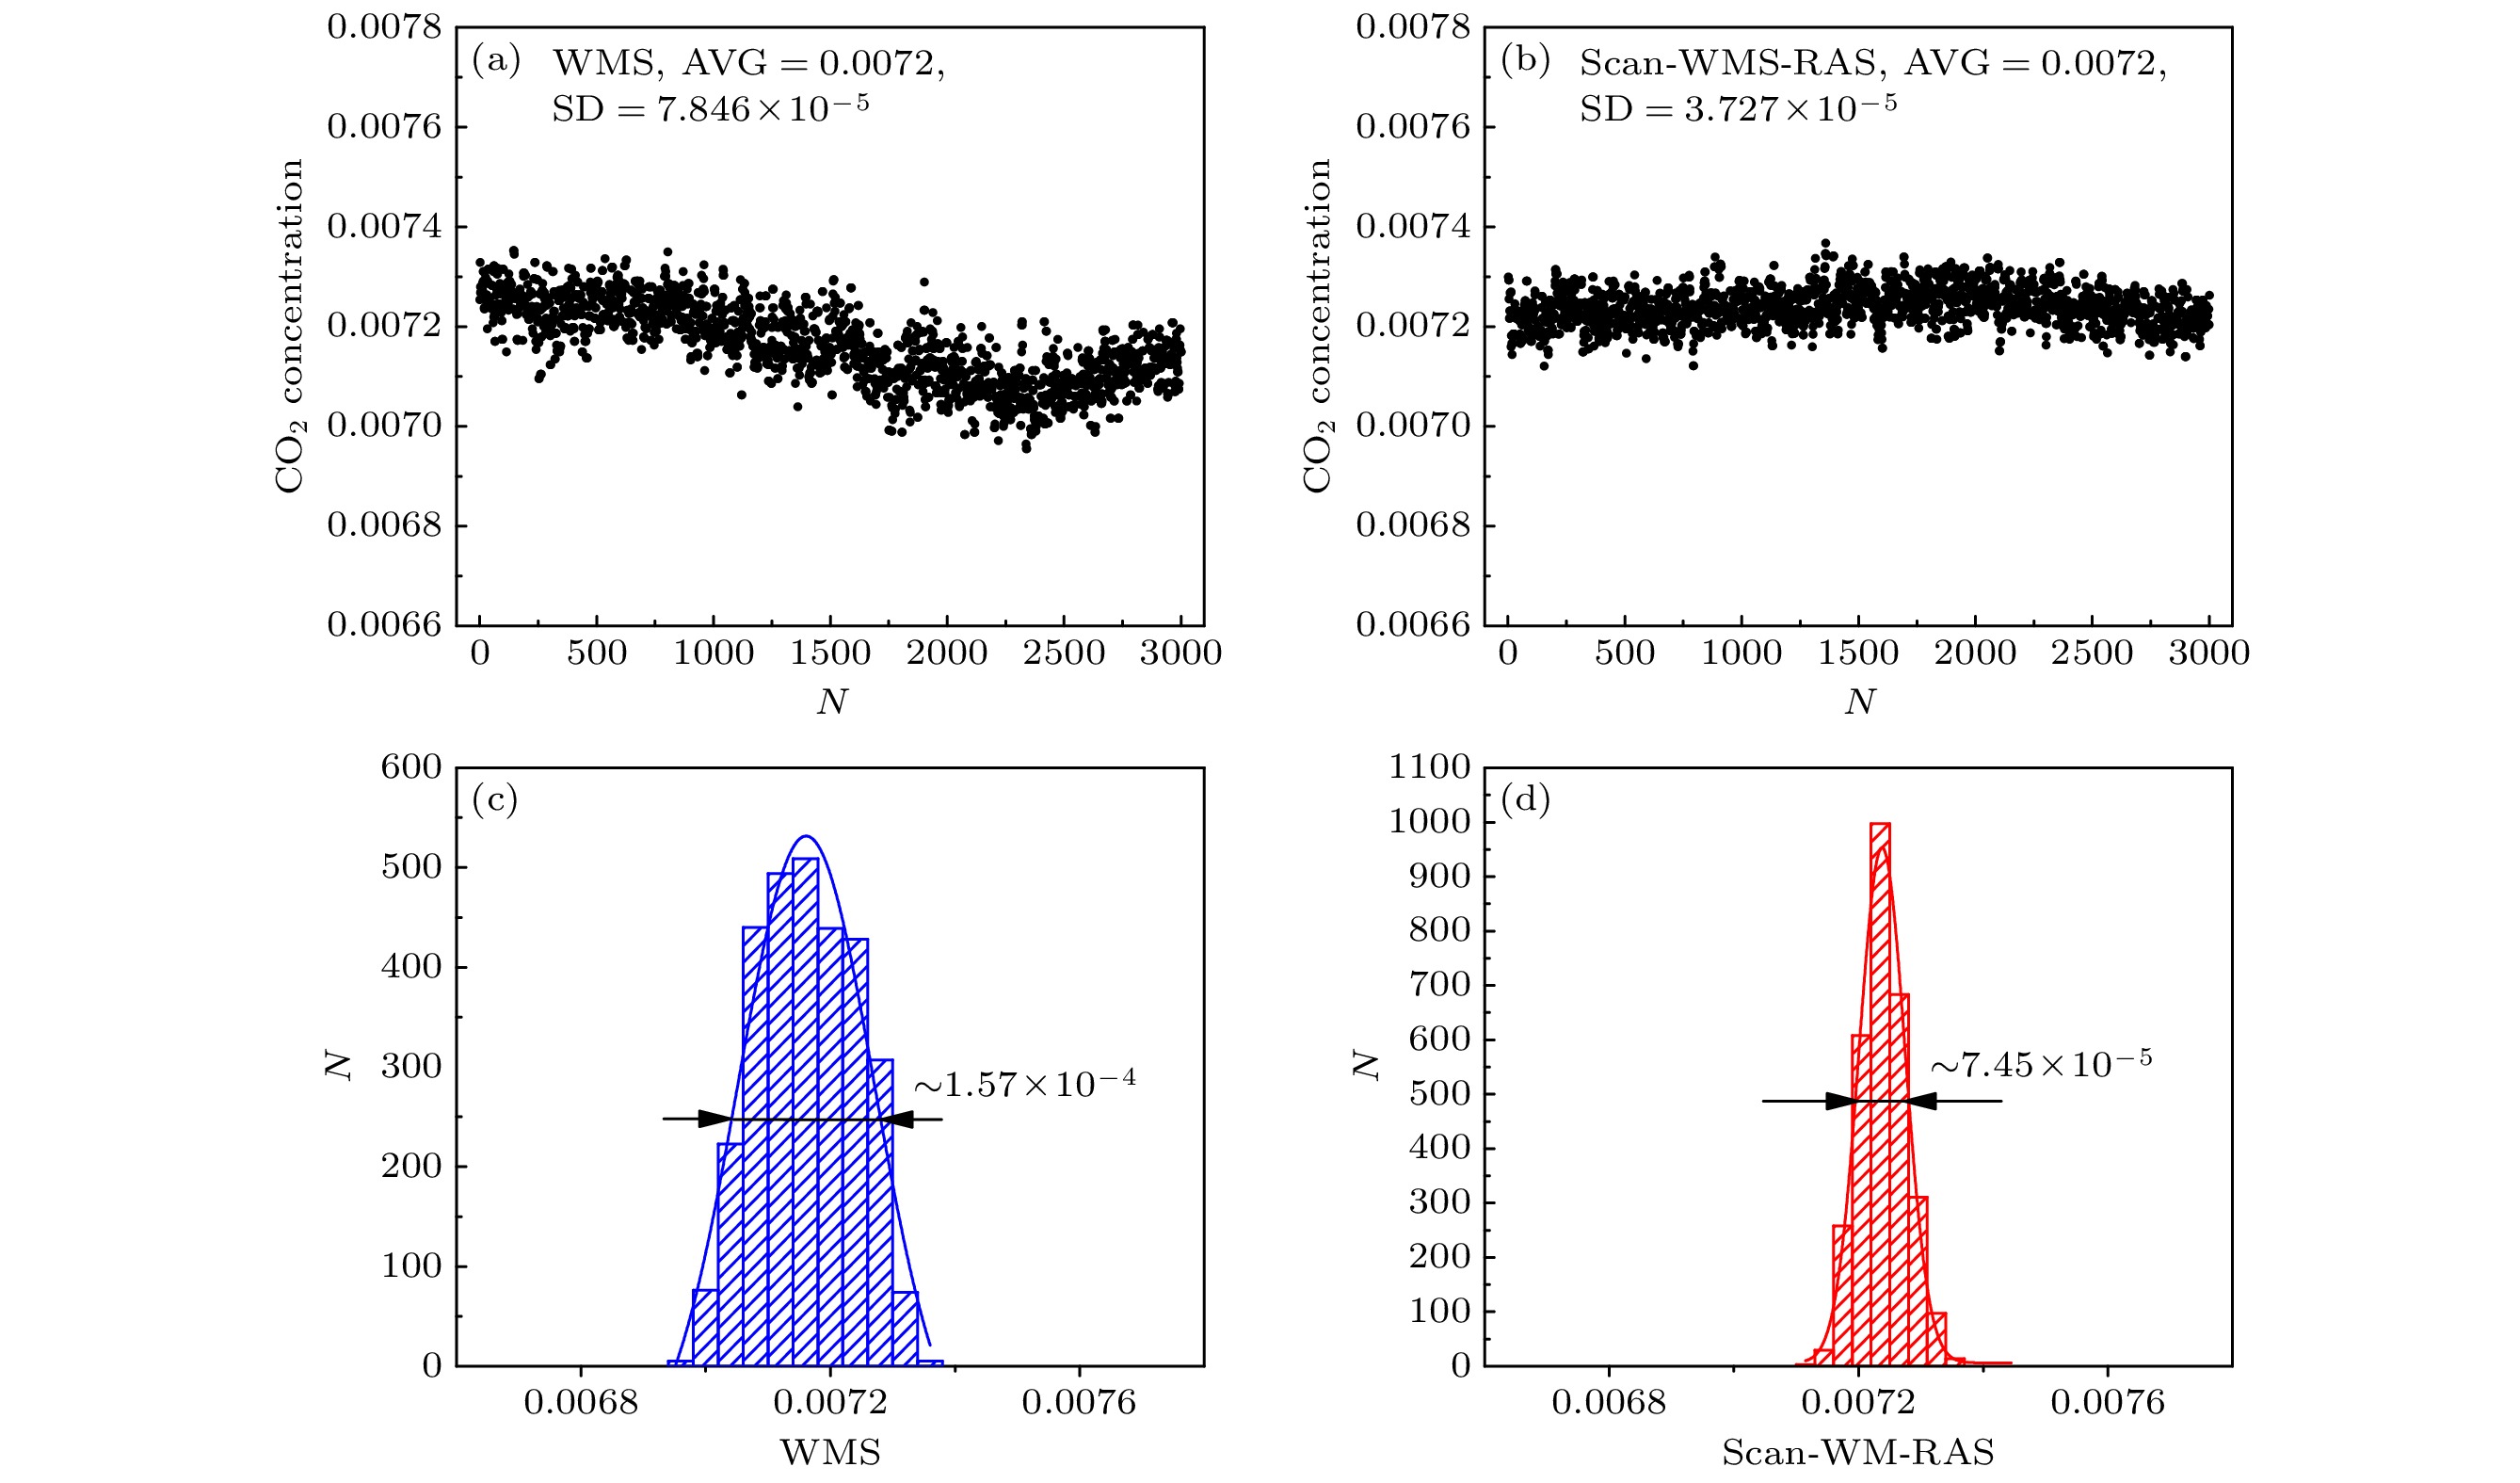
图 14 低浓度CO2标气3000次连续在线浓度测量结果, 及其统计分布对比 (a) WMS的浓度测量结果; (b) Scan-WM-RAS的浓度测量结果; (c) WMS的浓度统计分布; (d) Scan-WM-RAS的浓度统计分布
Fig. 14. Results of 3000 continuous online concentration measurements of low-concentration CO2 standard gas and their statistical distribution comparison: (a) The results of concentration measurements through WMS; (b) the results of concentration measurements through Scan-WM-RAS; (c) the statistical distribution of concentration through WMS; (d) the statistical distribution of concentration through Scan-WM-RAS.
表 1 CO2分子6330.821 cm–1处谱线光谱常数
Table 1. Spectral constants of the CO2 molecule's spectral line at 6330.821 cm–1.
$ {\nu }_{0} $/cm–1 S/(cm–2·atm–1) $ {\gamma }_{{\mathrm{a}}{\mathrm{i}}{\mathrm{r}}}/ $(cm–1·atm–1) $ {\gamma }_{{\mathrm{s}}{\mathrm{e}}{\mathrm{l}}{\mathrm{f}}}/ $(cm–1·atm–1) E''/cm–1 Line 6330.8212 1.522×10⁻²³ 0.0725 0.097 163.8684  下载: 导出CSV
表 2 4个阶次下6个调制深度透过率重构误差
Table 2. Reconstruction error of transmittance at six modulation depths across four orders.
m = 1.2 m = 1.4 m = 1.6 m = 1.8 m = 2.0 m = 2.2 H0—H4 1.045×10⁻⁴ 2.009×10⁻⁴ 3.313×10⁻⁴ 4.914×10⁻⁴ 6.750×10⁻⁴ 8.768×10⁻⁴ H0—H8 1.923×10⁻⁶ 4.938×10⁻⁶ 1.236×10⁻⁵ 2.697×10⁻⁵ 5.015×10⁻⁵ 8.373×10⁻⁵ H0—H12 9.197×10⁻⁷ 8.450×10⁻⁷ 9.185×10⁻⁷ 1.754×10⁻⁶ 3.591×10⁻⁶ 7.469×10⁻⁶ H0—H16 9.180×10⁻⁷ 8.202×10⁻⁷ 7.258×10⁻⁷ 8.501×10⁻⁷ 8.607×10⁻⁷ 1.014×10⁻⁶
下载: 导出CSV
-
[1] Adámek P, Olejníček J, Čada M, Kment Š, Hubička Z 2013 Opt. Lett. 38 2428
Google Scholar
[2] Goldenstein C S, Spearrin R M, Jeffries J B, Hanson R K 2017 Prog. Energ. Combust. 60 132
Google Scholar
[3] Witzel O, Klein A, Meffert C, Schulz C, Kaiser S A, Ebert V 2015 P. Combust. Inst. 35 3653
Google Scholar
[4] Fissiaux L, Delière Q, Blanquet G, Robert S, Vandaele A C, Lepère M 2014 J. Mol. Spectrosc. 297 35
Google Scholar
[5] Ghysels M, Durry G, Amarouche N 2013 Spectrochim. Acta A 107 55
Google Scholar
[6] McManus J B, Zahniser M S, Nelson D D, Shorter J H, Herndon S, Wood E 2010 Opt. Eng. 49 111124
Google Scholar
[7] McManus J B, Zahniser M S, Nelson D D, et al. 2015 Appl. Phys. B 119 203
Google Scholar
[8] Zhao G, Tan W, Jia M Y, et al. 2016 Sensors 16 1544
Google Scholar
[9] Cai W W, Kaminski C F 2014 Appl. Phys. Lett. 104 154106
Google Scholar
[10] Hangauer A, Chen J, Strzoda R, Ortsiefer M, Amann M, 2008 Opt. Lett. 33 1566
Google Scholar
[11] Bolshov M A, Kuritsyn Y A, Romanovskii Y V 2015 Spectrochim. Acta B 106 45
Google Scholar
[12] Neethu S, Verma R, Kamble S S, et al. 2014 Sensor. Actuat. B-Chem 192 70
Google Scholar
[13] Werle P A 1998 Spectrochim. Acta A 54 197
Google Scholar
[14] Bain J R P, Johnstone W, Ruxton K, Stewart G, Lengden M, Duffin K 2011 J. Lightw. Technol. 29 987
Google Scholar
[15] Reid J, Labrie D 1981 Appl. Phys. B 26 203
Google Scholar
[16] Rieker G B, Jeffffries J B, Hanson R K 2009 Appl. Optics. 48 5546
Google Scholar
[17] Wang Z H, Fu P F, Chao X 2019 Appl. Sci. 9 2723
Google Scholar
[18] Goldenstein C S, Strand C L, Schultz I A, Sun K, Jeffries J B, Hanson R K 2014 Appl. Optics. 53 356
Google Scholar
[19] Goldenstein C S, Hanson R K 2015 J. Quant. Spectrosc. RA. 152 127
Google Scholar
[20] Goldenstein C S, Jeffries J B, Hanson R K 2013 J. Quant. Spectrosc. RA. 130 100
Google Scholar
[21] Stewart G, Johnstone W, Bain J, Ruxton K, Duffin K 2011 J. Lightwave Technol. 29 811
Google Scholar
[22] Peng Z M, Du Y J, Che L, Li X H, Zheng K J 2011 Opt. Express 19 23104
Google Scholar
[23] Peng Z M, Du Y J, Che L, Yang Q S 2012 Opt. Express 20 11976
Google Scholar
[24] Rothman L S, Gordon I E, Babikov Y, et al. 2013 J. Quant. Spectrosc. RA. 130 4
Google Scholar
[25] Buchholz B, Böse N, Ebert V 2014 Appl. Phys. B 116 883
Google Scholar
[26] Pogány A, Klein A, Ebert V 2015 J. Quant. Spectrosc. RA. 165 108
Google Scholar

 下载:
下载:


计量
- 文章访问数: 1212
- PDF下载量: 44
- 被引次数: 0
