-
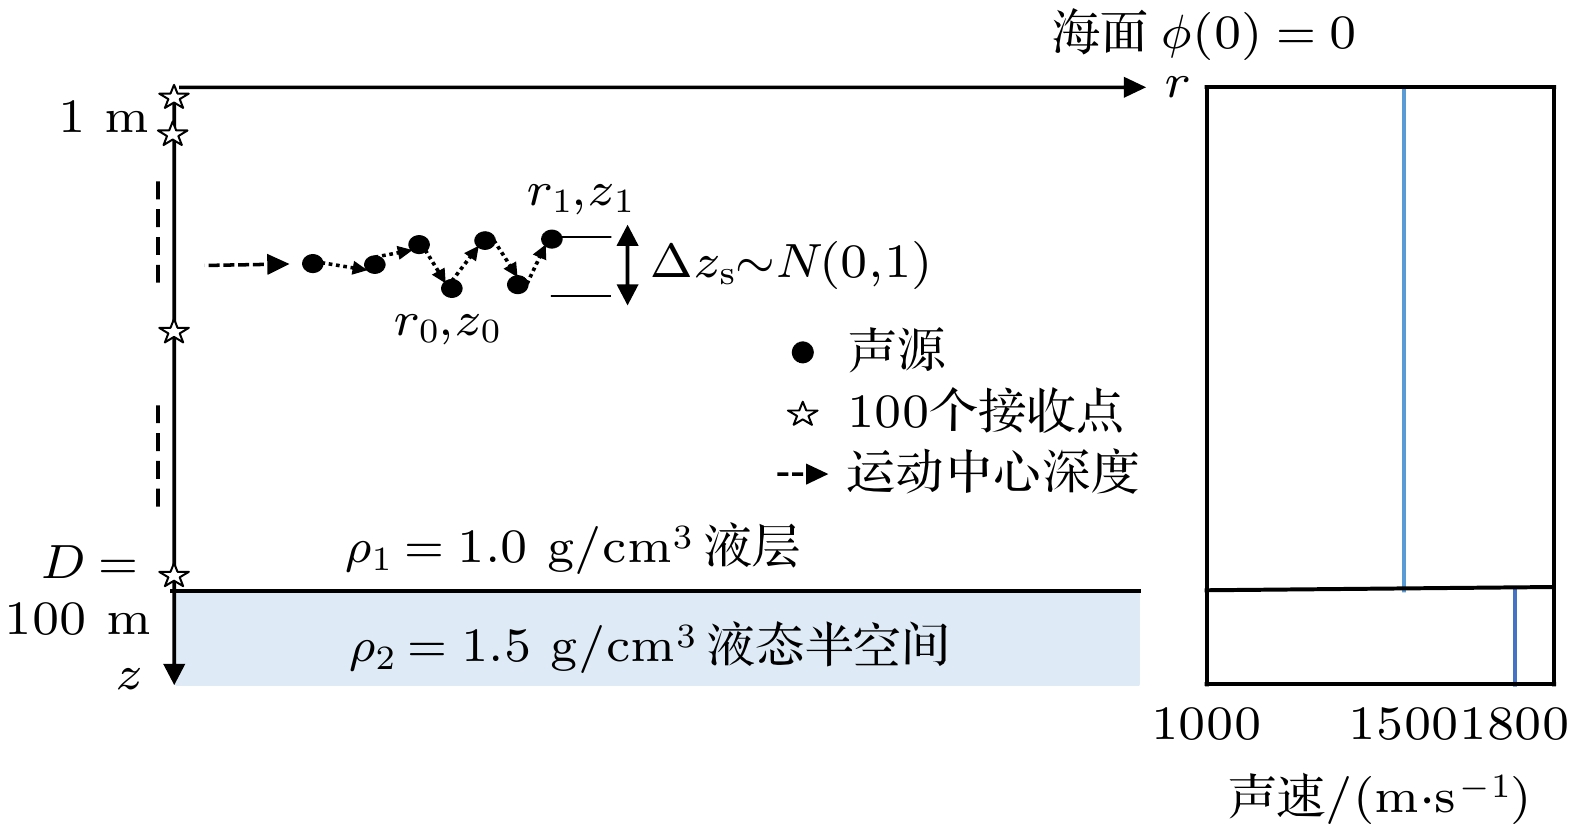
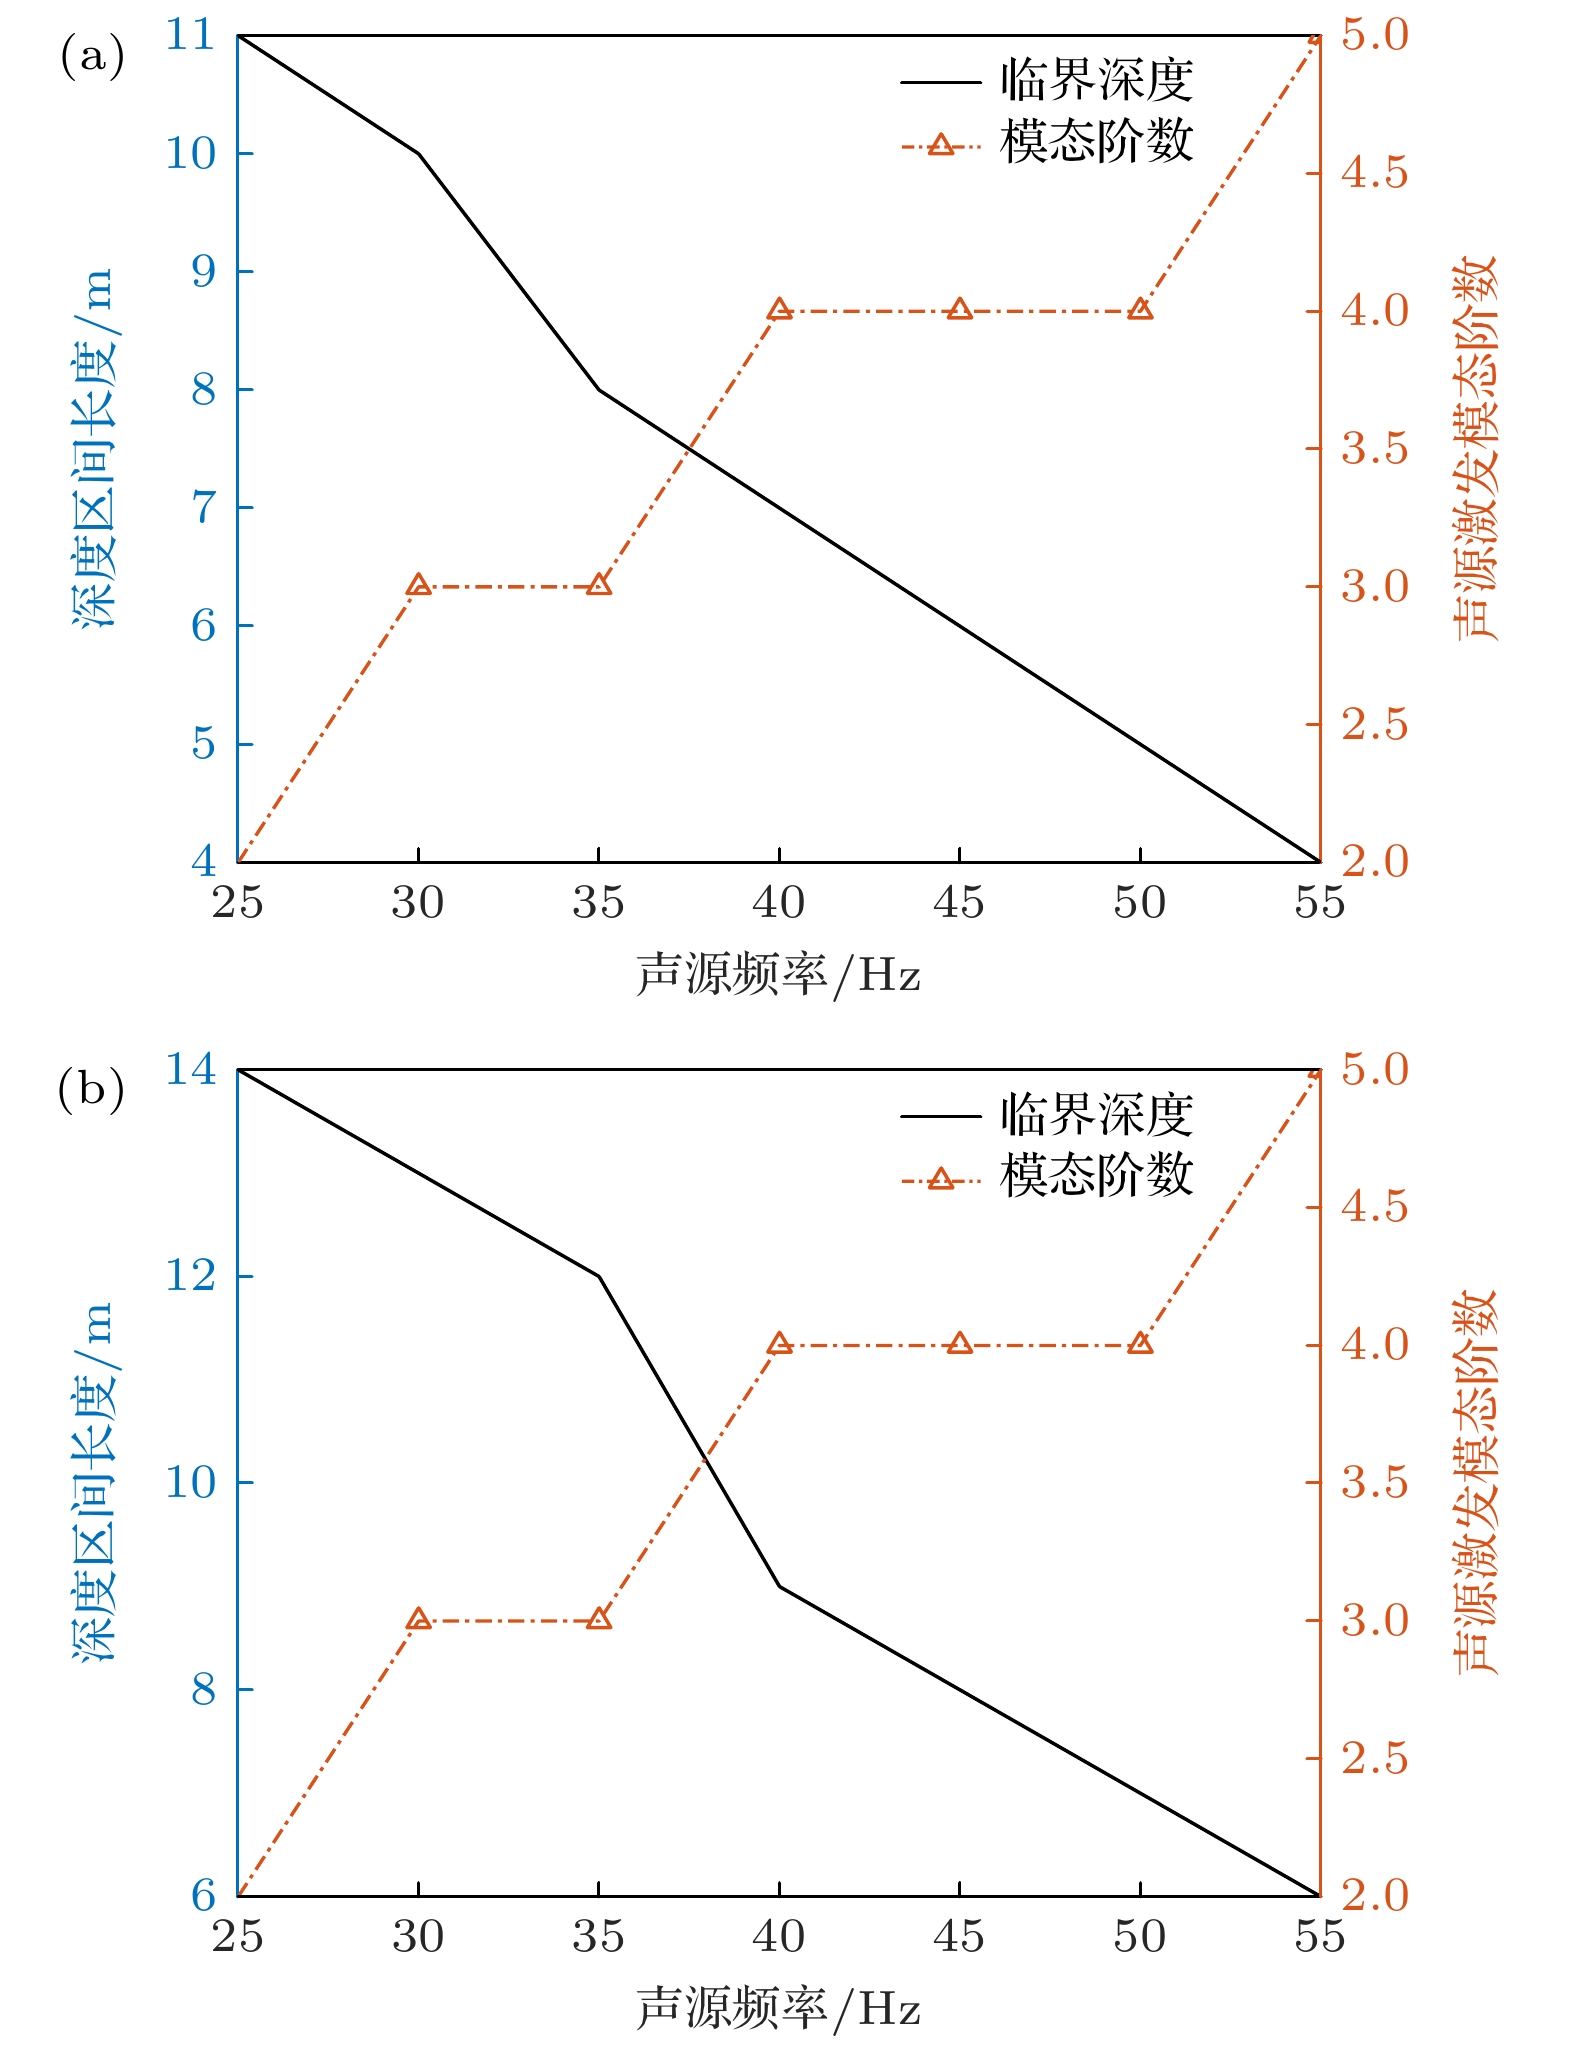
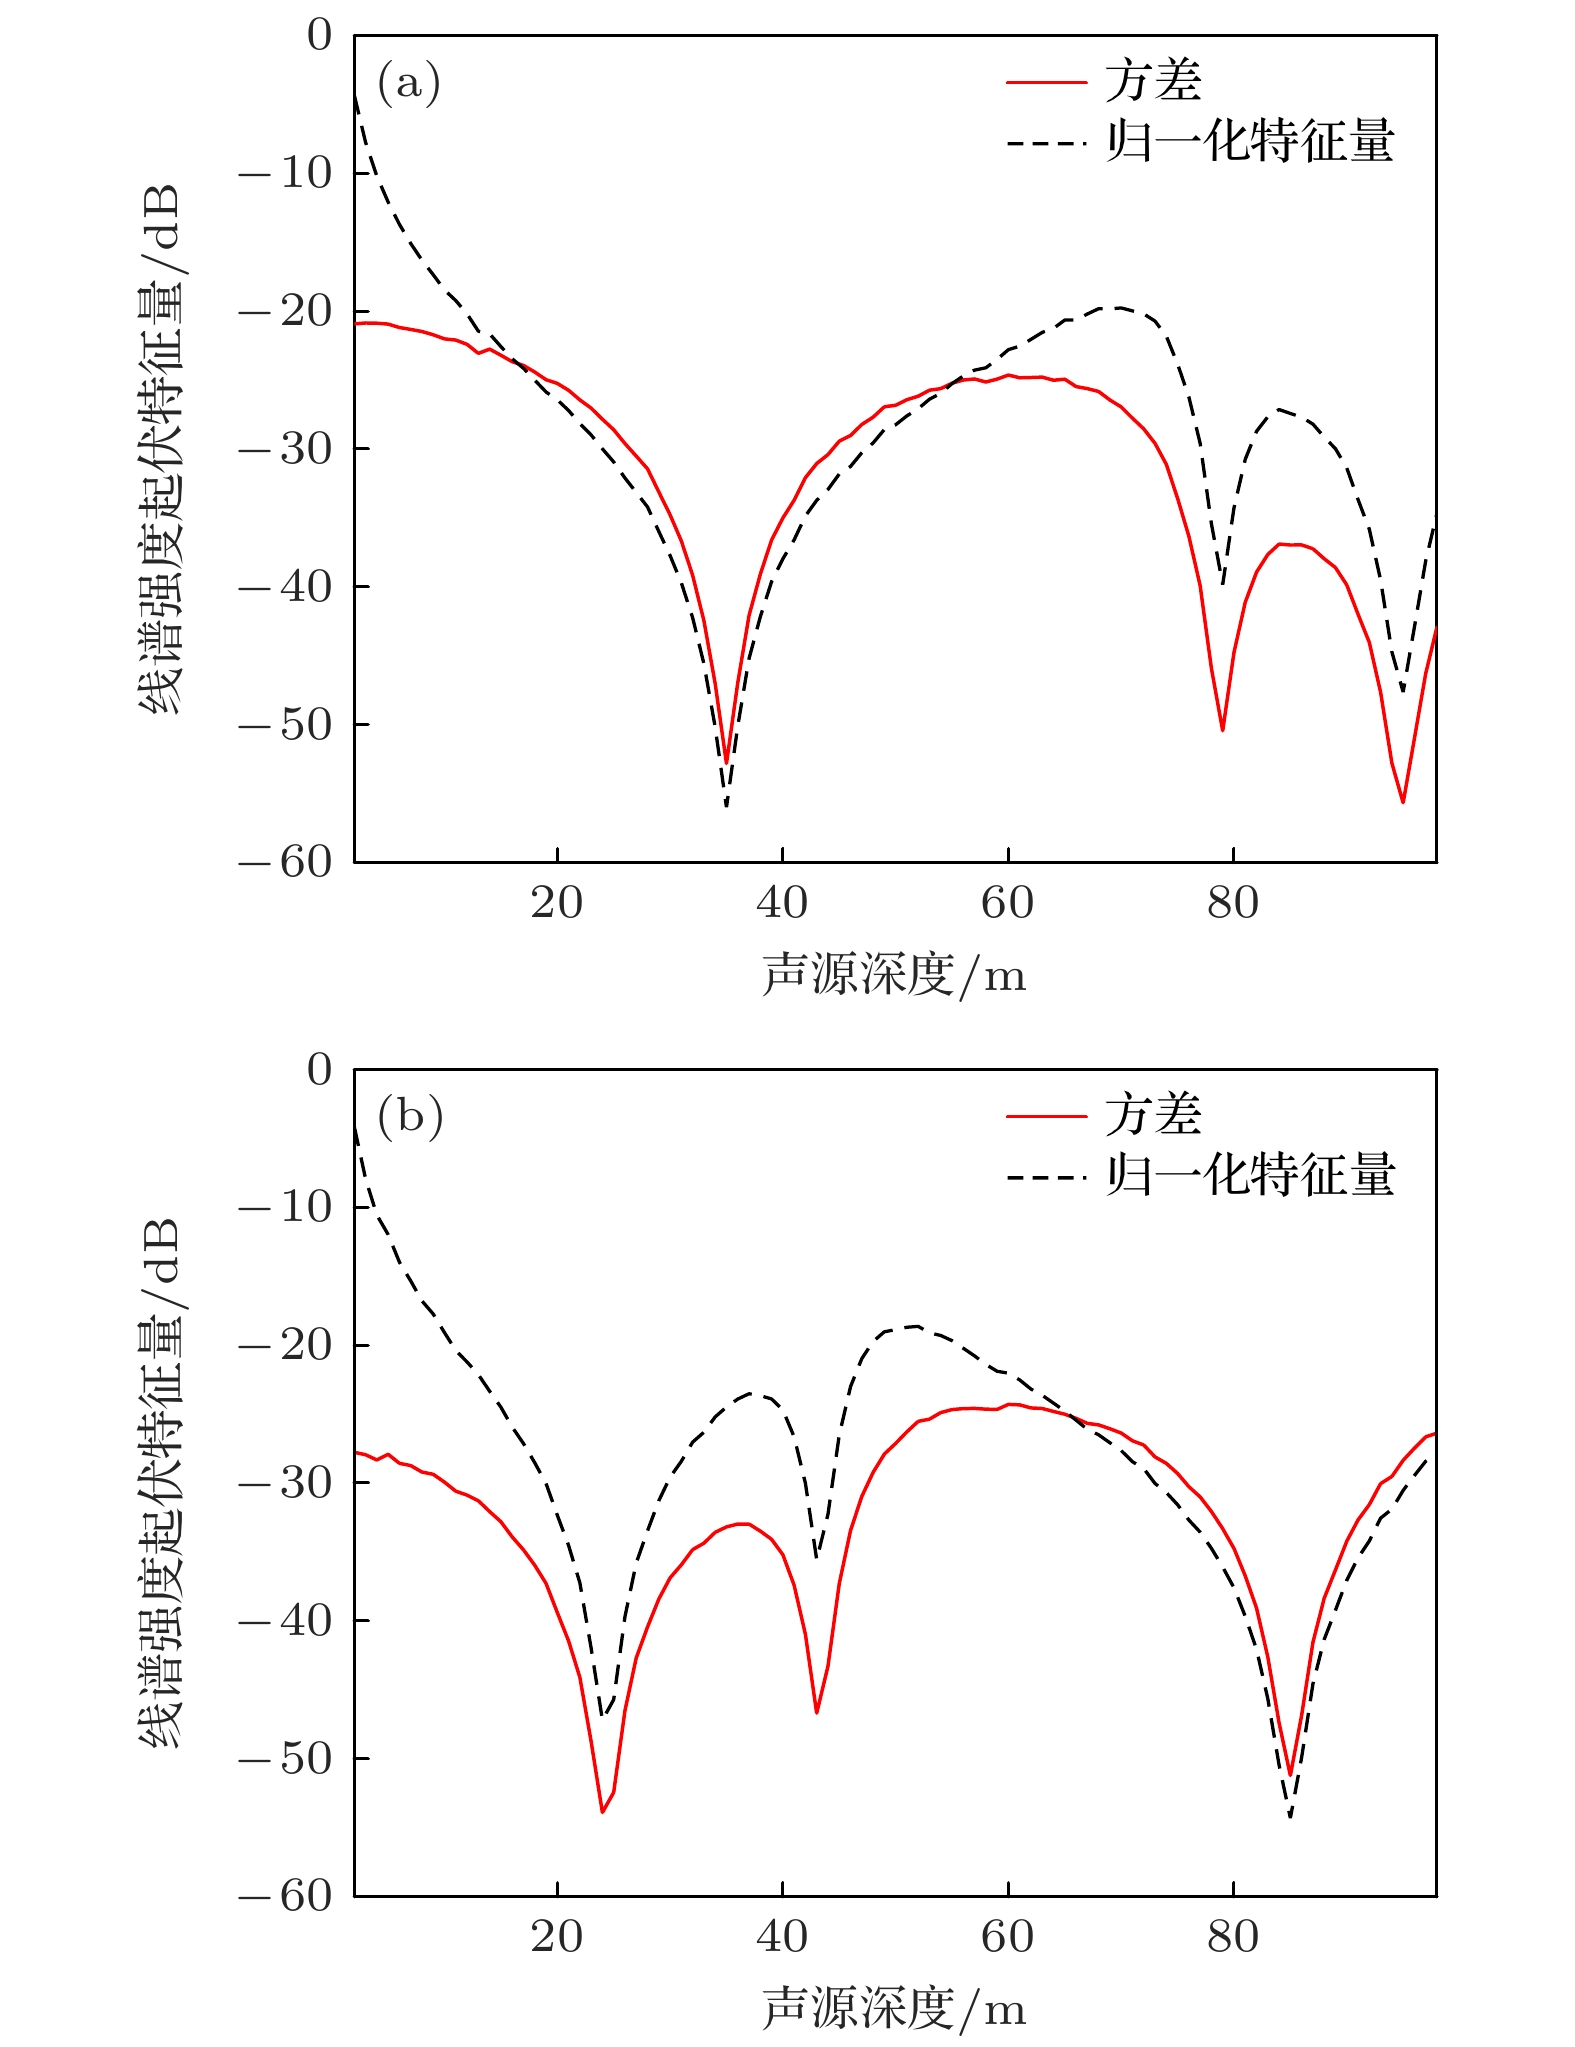
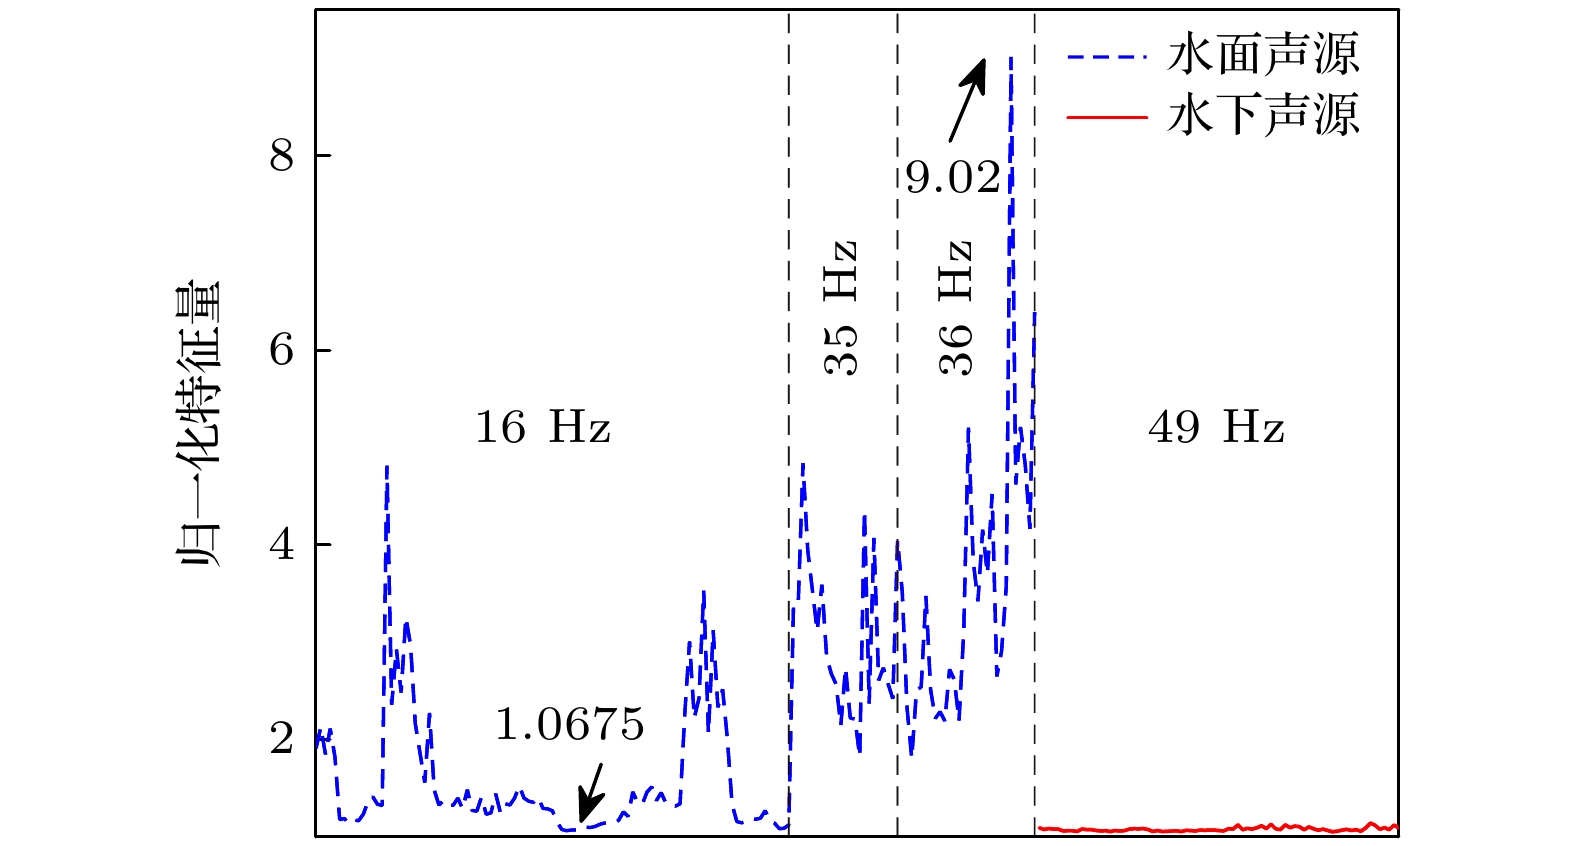
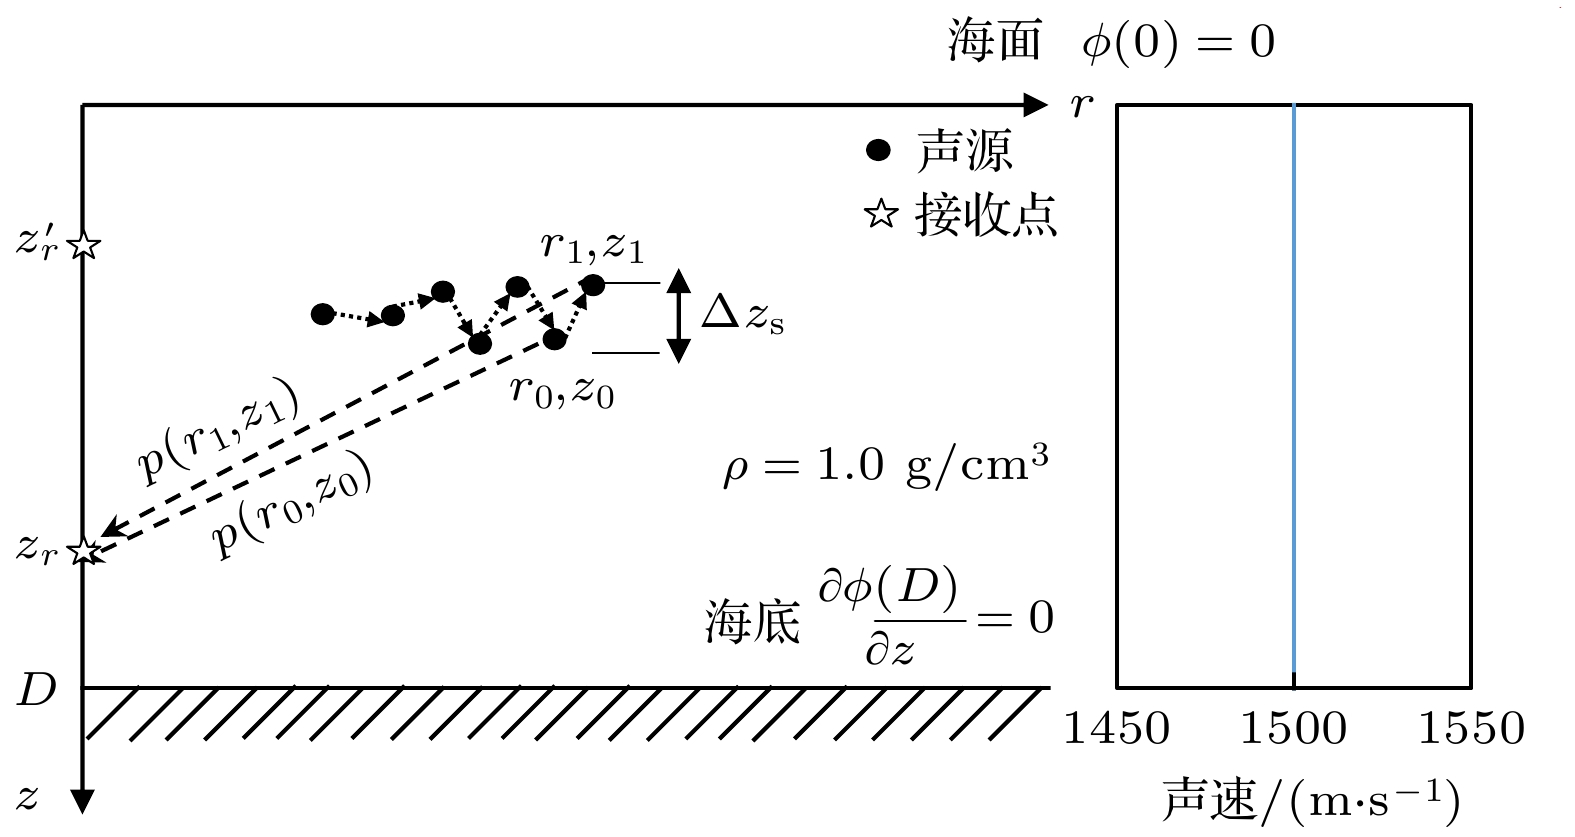
浅海环境中目标辐射线谱的起伏特征可用于水面、水下目标深度属性判别. 已有研究未给出表征水面、水下线谱起伏差异的物理量性质, 导致利用不同物理量进行目标深度属性判别时性能不佳. 针对这一问题, 本文从声源深度起伏所导致的线谱起伏出发, 采用微分方法与统计方法对线谱起伏规律进行分析, 研究了线谱起伏产生的物理机理, 得到了适合用于水面、水下目标深度属性判别的物理量. 首先, 分别推导了复声压实部、声功率与声压幅值关于声源深度的导数关系式, 得到了以上三种物理量在声源深度起伏时的起伏大小; 其次, 利用仿真实验数据从接收深度、声源水平距离、线谱频率等层面对理论推导进行验证, 并对线谱的归一化起伏特征进行了分析. 最后, 利用海试数据验证了相关结论. 结果表明, 当声源的深度起伏时, 水面、水下线谱的起伏差异源自各阶模态的相互作用. 声源频率、声源水平距离、接收深度三种因素决定了模态间相互作用的性质. 声压幅值适用于构建目标深度属性判别特征量, 可用于表征低频线谱的强度起伏差异. 数值仿真和海试数据处理结果表明, 相较于声压实部和声功率, 利用声压幅值构建的归一化水面、水下目标深度属性判别特征量具有更优性能.The difference in intensity fluctuation between a surface signal and a submerged signal can be used to discriminate the source depth in the shallow water waveguide. However, the properties of fluctuation distinction in intensity between surface source and submerge source are rarely studied, resulting in the poor performance of fluctuation-based methods sometimes. In this work, the intensity fluctuations caused by source depth fluctuations is analyzed by differential method and variance statistics method to figure out the physics of intensity fluctuations, and to present the suitable quantity for depth discrimination. Firstly, the derivative expression of real part, power and amplitude of the pressure field are respectively derived from the normal mode theory, hence their fluctuation quantities are specified. Then, the numerical examples, including the factor of receiver depth, source frequency and source range, are treated to verify the derivation and summarize the characteristic of fluctuations. The property of the intensity fluctuations is also compared with the distribution of normalized quantity on the depth dimension. Finally, the SWellEx-96 experimental data processing results validate the conclusions. The processing results of derivation, simulation data and experimental data show that the interactions between modes excited by the source give rise to the fluctuations. Meanwhile, the property of the interactions is affected by the received depth, source range and source frequency. Amplitude is capable of building a quantity based on fluctuations for source depth discrimination. For surface and submerged sources with lower frequency, their distinction in their fluctuations is stably represented by amplitude. In the SWellEx-96 experiment, the normalized values calculated from the amplitude of surface noise and submerged sound sources show the lowest difference of 0.5 and the highest difference of 2.5, indicating the effectiveness of using amplitude fluctuations to discriminate the sound source depth.
-
Keywords:
- intensity fluctuations /
- source depth discrimination /
- shallow water /
- normal mode
[1] 余赟, 惠俊英, 陈阳, 孙国仓, 滕超 2009 58 6335
 Google Scholar
Yu Y, Hui J Y, Chen Y, Sun G C, Teng C 2009 Acta Phys. Sin. 58 6335
 Google Scholar
[2] 刘志韬, 郭良浩, 闫超 2019 声学学报 44 28
 Google Scholar
Liu Z T, Guo L H, Yan C 2019 Acta Acust. 44 28
 Google Scholar
[3] Yang T C 2015 J. Acoust. Soc. Am. 138 1678
 Google Scholar
[4] 李晓彬, 孙超, 刘雄厚 2022 71 134302
 Google Scholar
Li X B, Sun C, Liu X H 2022 Acta Phys. Sin. 71 134302
 Google Scholar
[5] Urick R J 1977 J. Acoust. Soc. Am. 62 878
 Google Scholar
[6] 高大治, 翟林, 王好忠, 高博, 王宁 2017 声学学报 42 669
 Google Scholar
Gao D Z, Zhai L, Wang H Z, Gao B, Wang N 2017 Acta Acust. 42 669
 Google Scholar
[7] Zhou J B, Piao S C, Liu Y Q, Zhu H H 2017 Acta Phys. Sin. 66 014301 [周建波, 朴胜春, 刘亚琴, 祝捍皓 2017 66 014301]
 Google Scholar
Zhou J B, Piao S C, Liu Y Q, Zhu H H 2017 Acta Phys. Sin. 66 014301
 Google Scholar
[8] Georges A D, Kevin B S, Mohsen B, James H M, Gopu R P 2019 J. Acoust. Soc. Am. 146 1875
 Google Scholar
[9] 李沁然, 孙超, 谢磊 2022 71 024302
 Google Scholar
Li Q R, Sun C, Xie L 2022 Acta Phys. Sin. 71 024302
 Google Scholar
[10] 何兆阳, 雷波, 杨益新 2023 72 144301
 Google Scholar
He Z Y, Lei B, Yang Y X 2023 Acta Phys. Sin. 72 144301
 Google Scholar
[11] Joseph A S 1961 J. Acoust. Soc. Am. 33 239
 Google Scholar
[12] Clay C S, Wang Y Y, Shang E C 1985 J. Acoust. Soc. Am. 77 424
 Google Scholar
[13] Jacob G 1996 J. Acoust. Soc. Am. 99 3439
 Google Scholar
[14] Jemmott C W, Culver R L 2011 IEEE J. Oceanic Eng. 36 696
 Google Scholar
[15] Premus V 1999 J. Acoust. Soc. Am. 105 2170
 Google Scholar
[16] 谢志诚, 葛辉良 2015 声学与电子工程 2015 24
Xie Z C, Ge H L 2015 Acoust. Electron. Eng. 2015 24
[17] An L, Fang S L, Chen L J 2013 Journal of Southeast University (English Edition) 29 235
[18] Shi J J, Sun D J, Fu H L, Liu Q Y, Zhang W S 2019 IET Radar Sonar Navig. 13 2151
 Google Scholar
[19] Li X B, Sun C, Liu X H 2021 OES China Ocean Acoustics (COA) Harbin, China, 2021 p976
[20] Wagstaff R A 1997 IEEE J. Oceanic Eng. 22 110
 Google Scholar
[21] 张莉 2021 硕士学位论文 (南京: 东南大学)
Zhang L 2021 M. S. Thesis (Nanjing: Southeast University
[22] 恽宗杨 1965 声学学报 2 144
 Google Scholar
Yun Z Y 1965 Acta Acust. 2 144
 Google Scholar
[23] 毕雪洁 2019 博士学位论文 (哈尔滨: 哈尔滨工程大学)
Bi X J 2019 Ph. D. Dissertation (Harbin: Harbin Engineering University
[24] Marine Physical Lab http:// swellex96.ucsd.edu/ [2023-11-08]
[25] 汪德昭, 尚尔昌 2013 水声学(第二版) (北京: 科学出版社) 第345页—352页
Wang D Z, Shang E C 2013 Hydroacoustics (2nd Ed.) (Beijing: Science Press) pp345–352
-
表 1 仿真用接收点-声源参数
Table 1. Parameters for simulation.
参数 数值 接收深度/m 35 声源频率/Hz 30 声源级/dB 184, 194 声源运动中心深度/m [2:1:98] 声源水平距离/km 5 声源激发模态阶数 3 声源深度起伏次数 100 注: [2:1:98]表示深度的变化区间, 从2 m到98 m每间隔1 m取一个深度点 表 2 复声压实部的模态加权系数符号
Table 2. Sign of modal weighting coefficient.
接收深度/m 35 90 水平距离5 km – – – – + – 水平距离4 km + – + + + + 表 3 待分析样本
Table 3. Samples to be analyzed.
声源深度属性 水面 水下 声源频率/Hz 16 35 35 35 36 36 49 49 起始时刻/min 6.6 26.2 28.8 30.2 9.2 19.4 52 60 结束时刻/min 10.6 26.8 28.8 30.4 9.6 20 53.6 61.4 -
[1] 余赟, 惠俊英, 陈阳, 孙国仓, 滕超 2009 58 6335
 Google Scholar
Yu Y, Hui J Y, Chen Y, Sun G C, Teng C 2009 Acta Phys. Sin. 58 6335
 Google Scholar
[2] 刘志韬, 郭良浩, 闫超 2019 声学学报 44 28
 Google Scholar
Liu Z T, Guo L H, Yan C 2019 Acta Acust. 44 28
 Google Scholar
[3] Yang T C 2015 J. Acoust. Soc. Am. 138 1678
 Google Scholar
[4] 李晓彬, 孙超, 刘雄厚 2022 71 134302
 Google Scholar
Li X B, Sun C, Liu X H 2022 Acta Phys. Sin. 71 134302
 Google Scholar
[5] Urick R J 1977 J. Acoust. Soc. Am. 62 878
 Google Scholar
[6] 高大治, 翟林, 王好忠, 高博, 王宁 2017 声学学报 42 669
 Google Scholar
Gao D Z, Zhai L, Wang H Z, Gao B, Wang N 2017 Acta Acust. 42 669
 Google Scholar
[7] Zhou J B, Piao S C, Liu Y Q, Zhu H H 2017 Acta Phys. Sin. 66 014301 [周建波, 朴胜春, 刘亚琴, 祝捍皓 2017 66 014301]
 Google Scholar
Zhou J B, Piao S C, Liu Y Q, Zhu H H 2017 Acta Phys. Sin. 66 014301
 Google Scholar
[8] Georges A D, Kevin B S, Mohsen B, James H M, Gopu R P 2019 J. Acoust. Soc. Am. 146 1875
 Google Scholar
[9] 李沁然, 孙超, 谢磊 2022 71 024302
 Google Scholar
Li Q R, Sun C, Xie L 2022 Acta Phys. Sin. 71 024302
 Google Scholar
[10] 何兆阳, 雷波, 杨益新 2023 72 144301
 Google Scholar
He Z Y, Lei B, Yang Y X 2023 Acta Phys. Sin. 72 144301
 Google Scholar
[11] Joseph A S 1961 J. Acoust. Soc. Am. 33 239
 Google Scholar
[12] Clay C S, Wang Y Y, Shang E C 1985 J. Acoust. Soc. Am. 77 424
 Google Scholar
[13] Jacob G 1996 J. Acoust. Soc. Am. 99 3439
 Google Scholar
[14] Jemmott C W, Culver R L 2011 IEEE J. Oceanic Eng. 36 696
 Google Scholar
[15] Premus V 1999 J. Acoust. Soc. Am. 105 2170
 Google Scholar
[16] 谢志诚, 葛辉良 2015 声学与电子工程 2015 24
Xie Z C, Ge H L 2015 Acoust. Electron. Eng. 2015 24
[17] An L, Fang S L, Chen L J 2013 Journal of Southeast University (English Edition) 29 235
[18] Shi J J, Sun D J, Fu H L, Liu Q Y, Zhang W S 2019 IET Radar Sonar Navig. 13 2151
 Google Scholar
[19] Li X B, Sun C, Liu X H 2021 OES China Ocean Acoustics (COA) Harbin, China, 2021 p976
[20] Wagstaff R A 1997 IEEE J. Oceanic Eng. 22 110
 Google Scholar
[21] 张莉 2021 硕士学位论文 (南京: 东南大学)
Zhang L 2021 M. S. Thesis (Nanjing: Southeast University
[22] 恽宗杨 1965 声学学报 2 144
 Google Scholar
Yun Z Y 1965 Acta Acust. 2 144
 Google Scholar
[23] 毕雪洁 2019 博士学位论文 (哈尔滨: 哈尔滨工程大学)
Bi X J 2019 Ph. D. Dissertation (Harbin: Harbin Engineering University
[24] Marine Physical Lab http:// swellex96.ucsd.edu/ [2023-11-08]
[25] 汪德昭, 尚尔昌 2013 水声学(第二版) (北京: 科学出版社) 第345页—352页
Wang D Z, Shang E C 2013 Hydroacoustics (2nd Ed.) (Beijing: Science Press) pp345–352
计量
- 文章访问数: 3658
- PDF下载量: 173
- 被引次数: 0


 下载:
下载:

