-
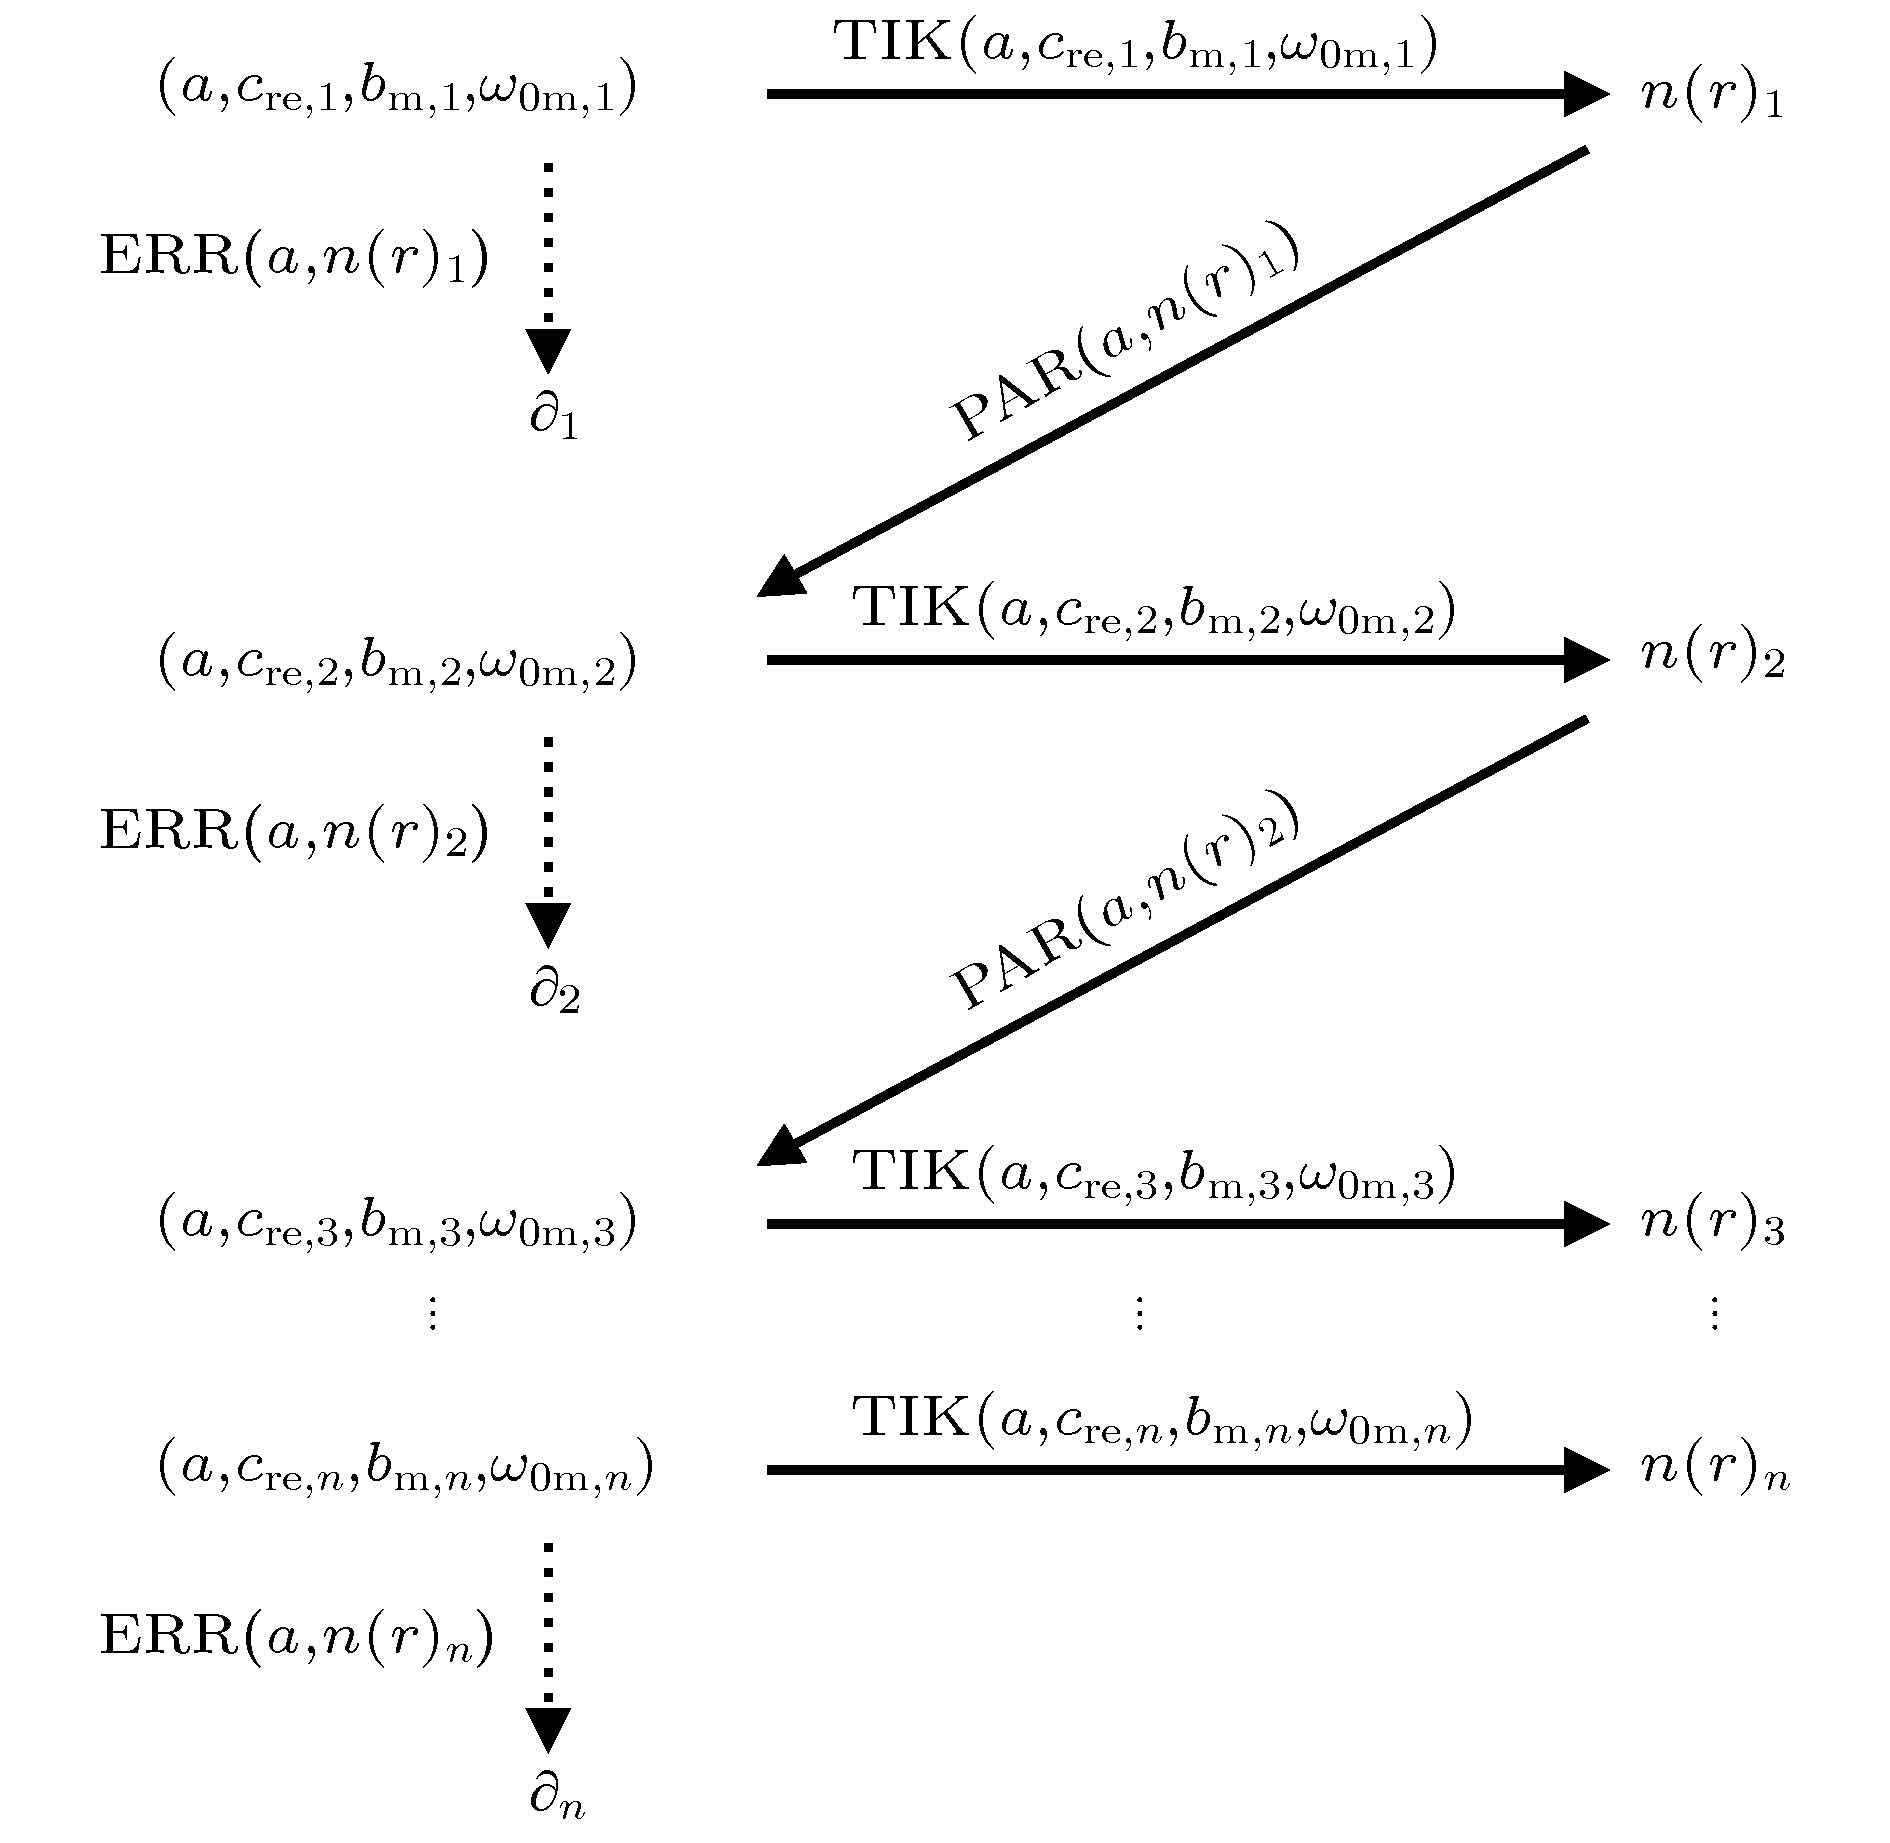
通过测量含气泡水的声衰减反演气泡群参数是获取水中气泡分布的重要方法, 但是经典方法忽略了较高浓度气泡水中的强频散特性和气泡振动参数的改变, 导致反演较高浓度气泡群分布时会产生巨大误差. 为解决这个问题, 本文基于等效媒质理论建立起了声衰减和相速度的联系, 并考虑了含气泡水平均量对气泡阻尼系数和共振频率的影响. 在此基础上, 通过将反演气泡分布和修正相速度及气泡振动参数交替迭代的方法, 有效地消除了高浓度气泡水中由频散和气泡振动特性改变引起的误差. 与实验数据对比发现, 气泡群孔隙率达到10–5时, 考虑含气泡水的频散特性会显著降低反演误差; 而当气泡群孔隙率达到10–3时, 气泡阻尼系数和共振频率的修正会对反演结果变得重要. 本文方法在反演孔隙率为10–3—10–2的高浓度气泡群时, 仍有较好效果, 这可为获取水下较高浓度气泡群分布提供方法借鉴.Measurement of the bubble size distribution (BSD) and the void fraction in bubbly liquids is very important for many areas, such as ocean science, cavitation inception studies, and military applications. The methods of using acoustical attenuation caused by bubbly liquid to estimate the BSD can date back to Medwin’s research in which the resonant bubble approximation (RBA) was proposed [Medwin H 1970 J.Geophys.Res. 75 599]. In the traditional theory, the methods used to invert the acoustical attenuation for obtaining the BSD are well developed and useful for the low void fraction. However, the comparison between the results from the conventional methods and the experimental results is not satisfactory when the void fraction is higher than 10–5. In fact, the frequency dispersion and the bubble interaction in bubbly liquid should be considered in the process of inverting the BSD for the high-density bubble group. In this paper, the relationship between the attenuation and the phase velocity of bubbly liquid is analyzed based on the effective medium theory, and the bubbles’ interaction is considered by calculating the change of vibration parameters of bubbles. On this basis, we propose an iterative method to accurately determine the BSD of the high-density bubble group. In this iterative method, the errors of the inversion results are reduced by estimating the phase velocity and the vibration parameters of bubbles from sound attenuation. This iterative method is numerically tested for the bubble distributions of log-normal and power-law functions. The simulation results are in good agreement with the given bubble distributions for the void fractions higher than 10–3. Further, the influence of the frequency dispersion and the bubble interaction on inversion results are discussed. Compared with the experimental data, the inversion results calculated by the iterative method show that considering the dispersion can significantly reduce the errors, when the void fraction of bubbly liquid increases up to 10–5. And the correction to bubble damping coefficient and resonance frequency have an important effect on the inversion result when the void fraction of bubbly liquid is higher than 10–3, indicating that the iterative method proposed by this paper can be a useful tool for inverting the BSD of the high-density bubble group in the liquid.
[1] 蒋涛, 刘凯, 张江 2010 兵工学报 31 860
Jiang T, Liu K, Zhang J 2010 Acta Armam. 31 860
[2] 王少雄, 李玉星, 刘翠伟, 梁杰, 李安琪, 薛源 2020 化工学报 71 1898
Wang S X, Li Y X, Liu C W, Liang J, Li A Q, Xue Y 2020 J. Chem. Ind. Eng. (China) 71 1898
[3] 王勇, 林书玉, 张小丽 2013 62 064304
 Google Scholar
Wang Y, Lin S Y, Zhang X L 2013 Acta Phys. Sin. 62 064304
 Google Scholar
[4] Medwin H 1970 J. Geophys. Res. 75 599
 Google Scholar
[5] Medwin H 1974 J. Acoust. Soc. Am. 56 1100
 Google Scholar
[6] Medwin H 1977 J. Geophys. Res. 82 971
 Google Scholar
[7] Qian Z W 1993 J. Sound Vib. 168 327
 Google Scholar
[8] Commander K W, Moritz E 1989 J. Acoust. Soc. Am. 85 2665
 Google Scholar
[9] Commander K W, Moritz E 1989 Oceans' 89 Conference Proceedings Florida, America, September 18−21, 1989 pp1181−1185
[10] Caruthers J W, Elmore P A 1999 J. Acoust. Soc. Am. 106 117
[11] Choi B K, Yoon S W 2001 IEEE J. Oceanic Eng. 26 125
 Google Scholar
[12] Choi B K, Kim B C, Kim B N 2006 Ocean Sci. J. 41 195
 Google Scholar
[13] Czerski, H. 2012 J. Atmos. Oceanic Technol. 29 1139
 Google Scholar
[14] Mantouka A, Dogan H, White P R 2016 J. Acoust. Soc. Am. 140 274
 Google Scholar
[15] 谢萍 硕士学位论文 (青岛: 中国海洋大学)
Xie P 2011 M. S. Thesis (Qingdao: Ocean University of China) (in Chinese)
[16] 王众, 张静远, 张洪刚 2019 海军工程大学学报 31 74
 Google Scholar
Wang Z, Zhang J Y, Zhang H G 2019 J. Nav. Univ. Eng. 31 74
 Google Scholar
[17] Duraiswami R, Prabhukumar S, Chahine G L 1998 J. Acoust. Soc. Am. 27 2569
[18] Wu X J, Chahine G L 2010 J. Hydrodyn. Ser. B 22 330
[19] Chahine G L 2009 J. Hydrodyn. 21 316
 Google Scholar
[20] Leighton T G, Baik K, Jiang J 2012 Proc. Roy. Soc. A-Math. Phys. 468 2461
[21] Silberman E. 1957 J. Acoust. Soc. Am. 29 925
 Google Scholar
[22] Leroy V, Strybulevych A, Page J H, Scanlon M G 2008 J. Acoust. Soc. Am. 123 1931
 Google Scholar
[23] Kargl S G 2002 J. Acoust. Soc. Am. 111 168
 Google Scholar
[24] Fuster D, Conoir J M, Colonius T 2014 Phys. Rev. E 90 063010
 Google Scholar
[25] Foldy L L 1945 Phys. Rev. 67 107
 Google Scholar
[26] Commander K W, Prosperetti A 1989 J. Acoust. Soc. Am. 85 732
 Google Scholar
[27] Lukas M A 1993 Numer. Math. 66 41
 Google Scholar
[28] Wilson P S, Roy R A, Carey W M 2005 J. Acoust. Soc. Am. 117 1895
 Google Scholar
-
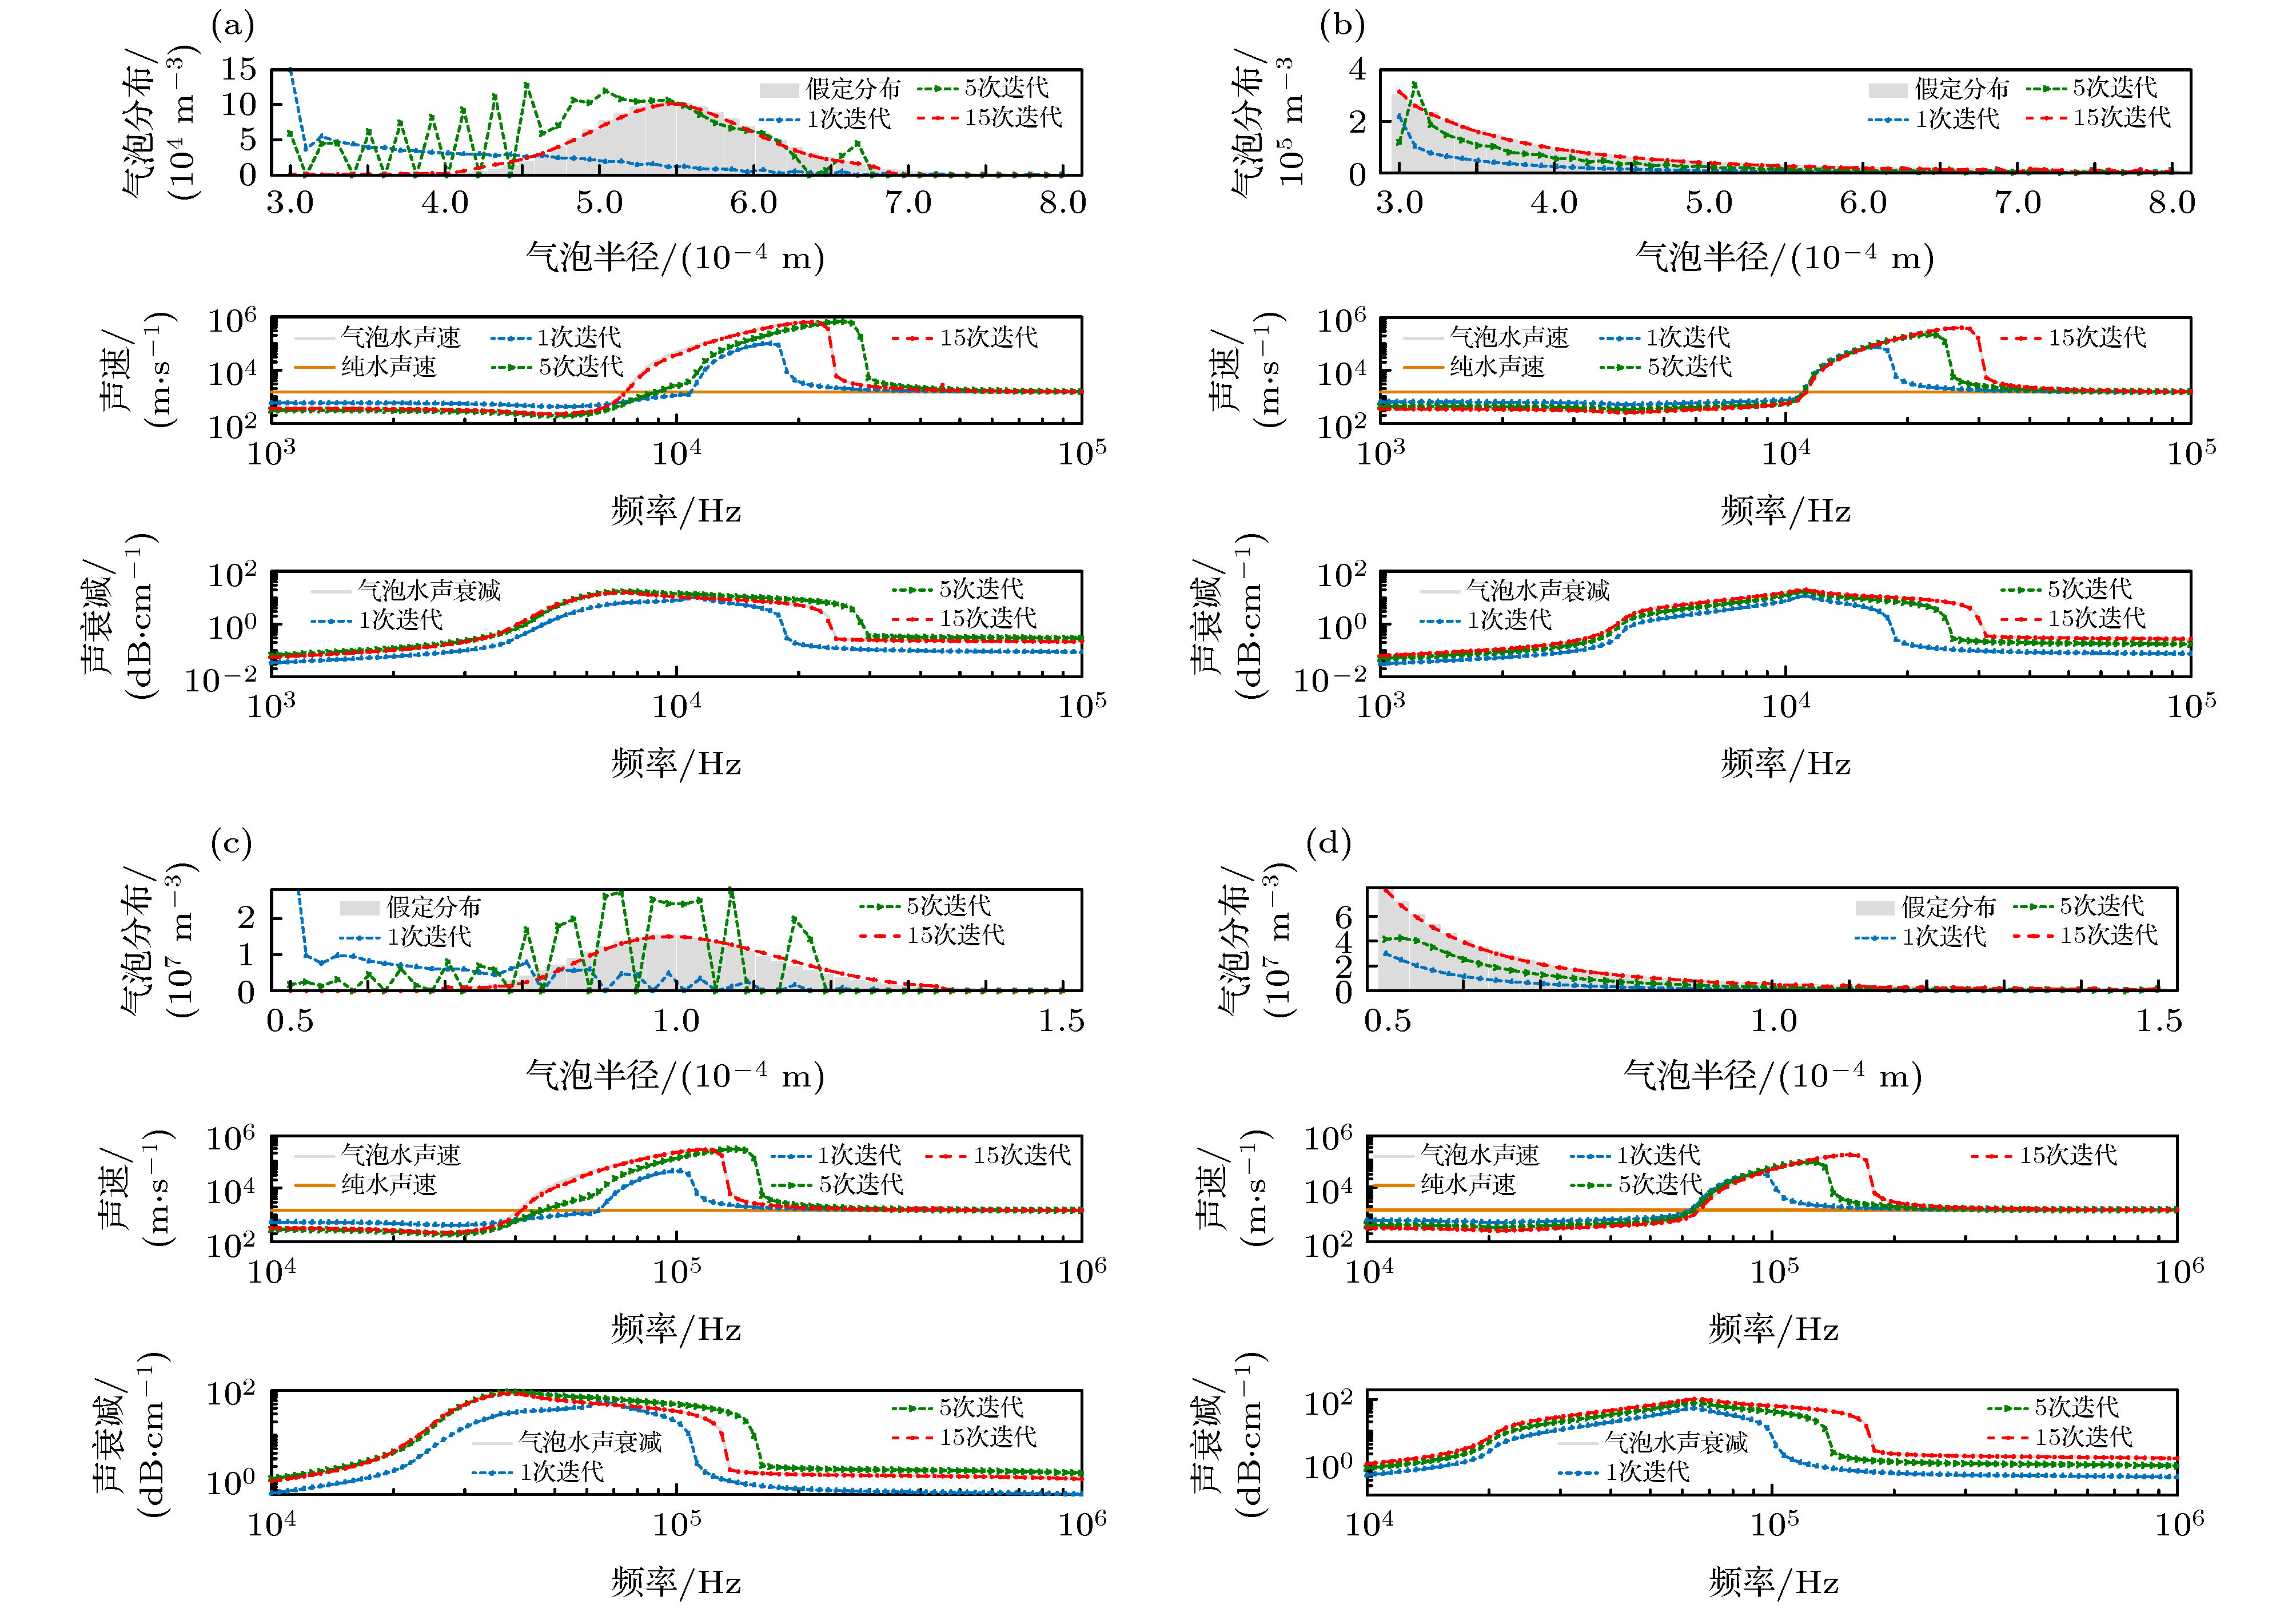
图 2 迭代算法反演结果 (a) 对数正态分布,
$r \in \left[ {3 \times {{10}^{ - 4}}\;{\rm{ m}}, 8 \times {{10}^{ - 4}}\;{\rm{ m}}} \right]$ ; (b) 幂律分布,$r \in \left[ {3 \times {{10}^{ - 4}}\;{\rm{ m}}, 8 \times {{10}^{ - 4}}\;{\rm{ m}}} \right]$ ; (c) 对数正态分布,$r \in \left[ {0.5 \times {{10}^{ - 4}}\;{\rm{ m}}, 1.5 \times {{10}^{ - 4}}\;{\rm{ m}}} \right]$ ; (d) 幂律分布,$r \in \left[ {0.5 \times {{10}^{ - 4}}\;{\rm{ m}}, 1.5 \times {{10}^{ - 4}}\;{\rm{ m}}} \right]$ Fig. 2. The inversion results: (a) Log-normal,
$r \in \left[ {3 \times {{10}^{ - 4}}\;{\rm{ m}}, 8 \times {{10}^{ - 4}}\;{\rm{ m}}} \right]$ ; (b) Power-law,$r \in \left[ {3 \times {{10}^{ - 4}}\;{\rm{ m}}, 8 \times {{10}^{ - 4}}\;{\rm{ m}}} \right]$ ; (c) Log-normal,$r \in \left[ {0.5 \times {{10}^{ - 4}}\;{\rm{ m}}, 1.5 \times {{10}^{ - 4}}\;{\rm{ m}}} \right]$ ; (d) Power-law,$r \in \left[ {0.5 \times {{10}^{ - 4}}\;{\rm{ m}}, 1.5 \times {{10}^{ - 4}}\;{\rm{ m}}} \right]$ .图 3 例1数据的反演结果图, 气泡群孔隙率
$\beta = 6.2 \times {10^{ - 5}}$ , 平均半径$\overline r = 6.36 \times {10^{ - 4}}\;{\rm{ m}}$ (a) 气泡分布反演结果; (b) 相速度计算结果; (c) 声衰减计算结果Fig. 3. Inversion results of Example 1, void fraction
$\beta = 6.2 \times {10^{ - 5}}$ , mean radius$\overline r = 6.36 \times {10^{ - 4}}\;{\rm{ m}}$ : (a) Bubble distributions; (b) phase speed; (c) sound attenuation.图 4 例2数据的反演结果图, 气泡群孔隙率
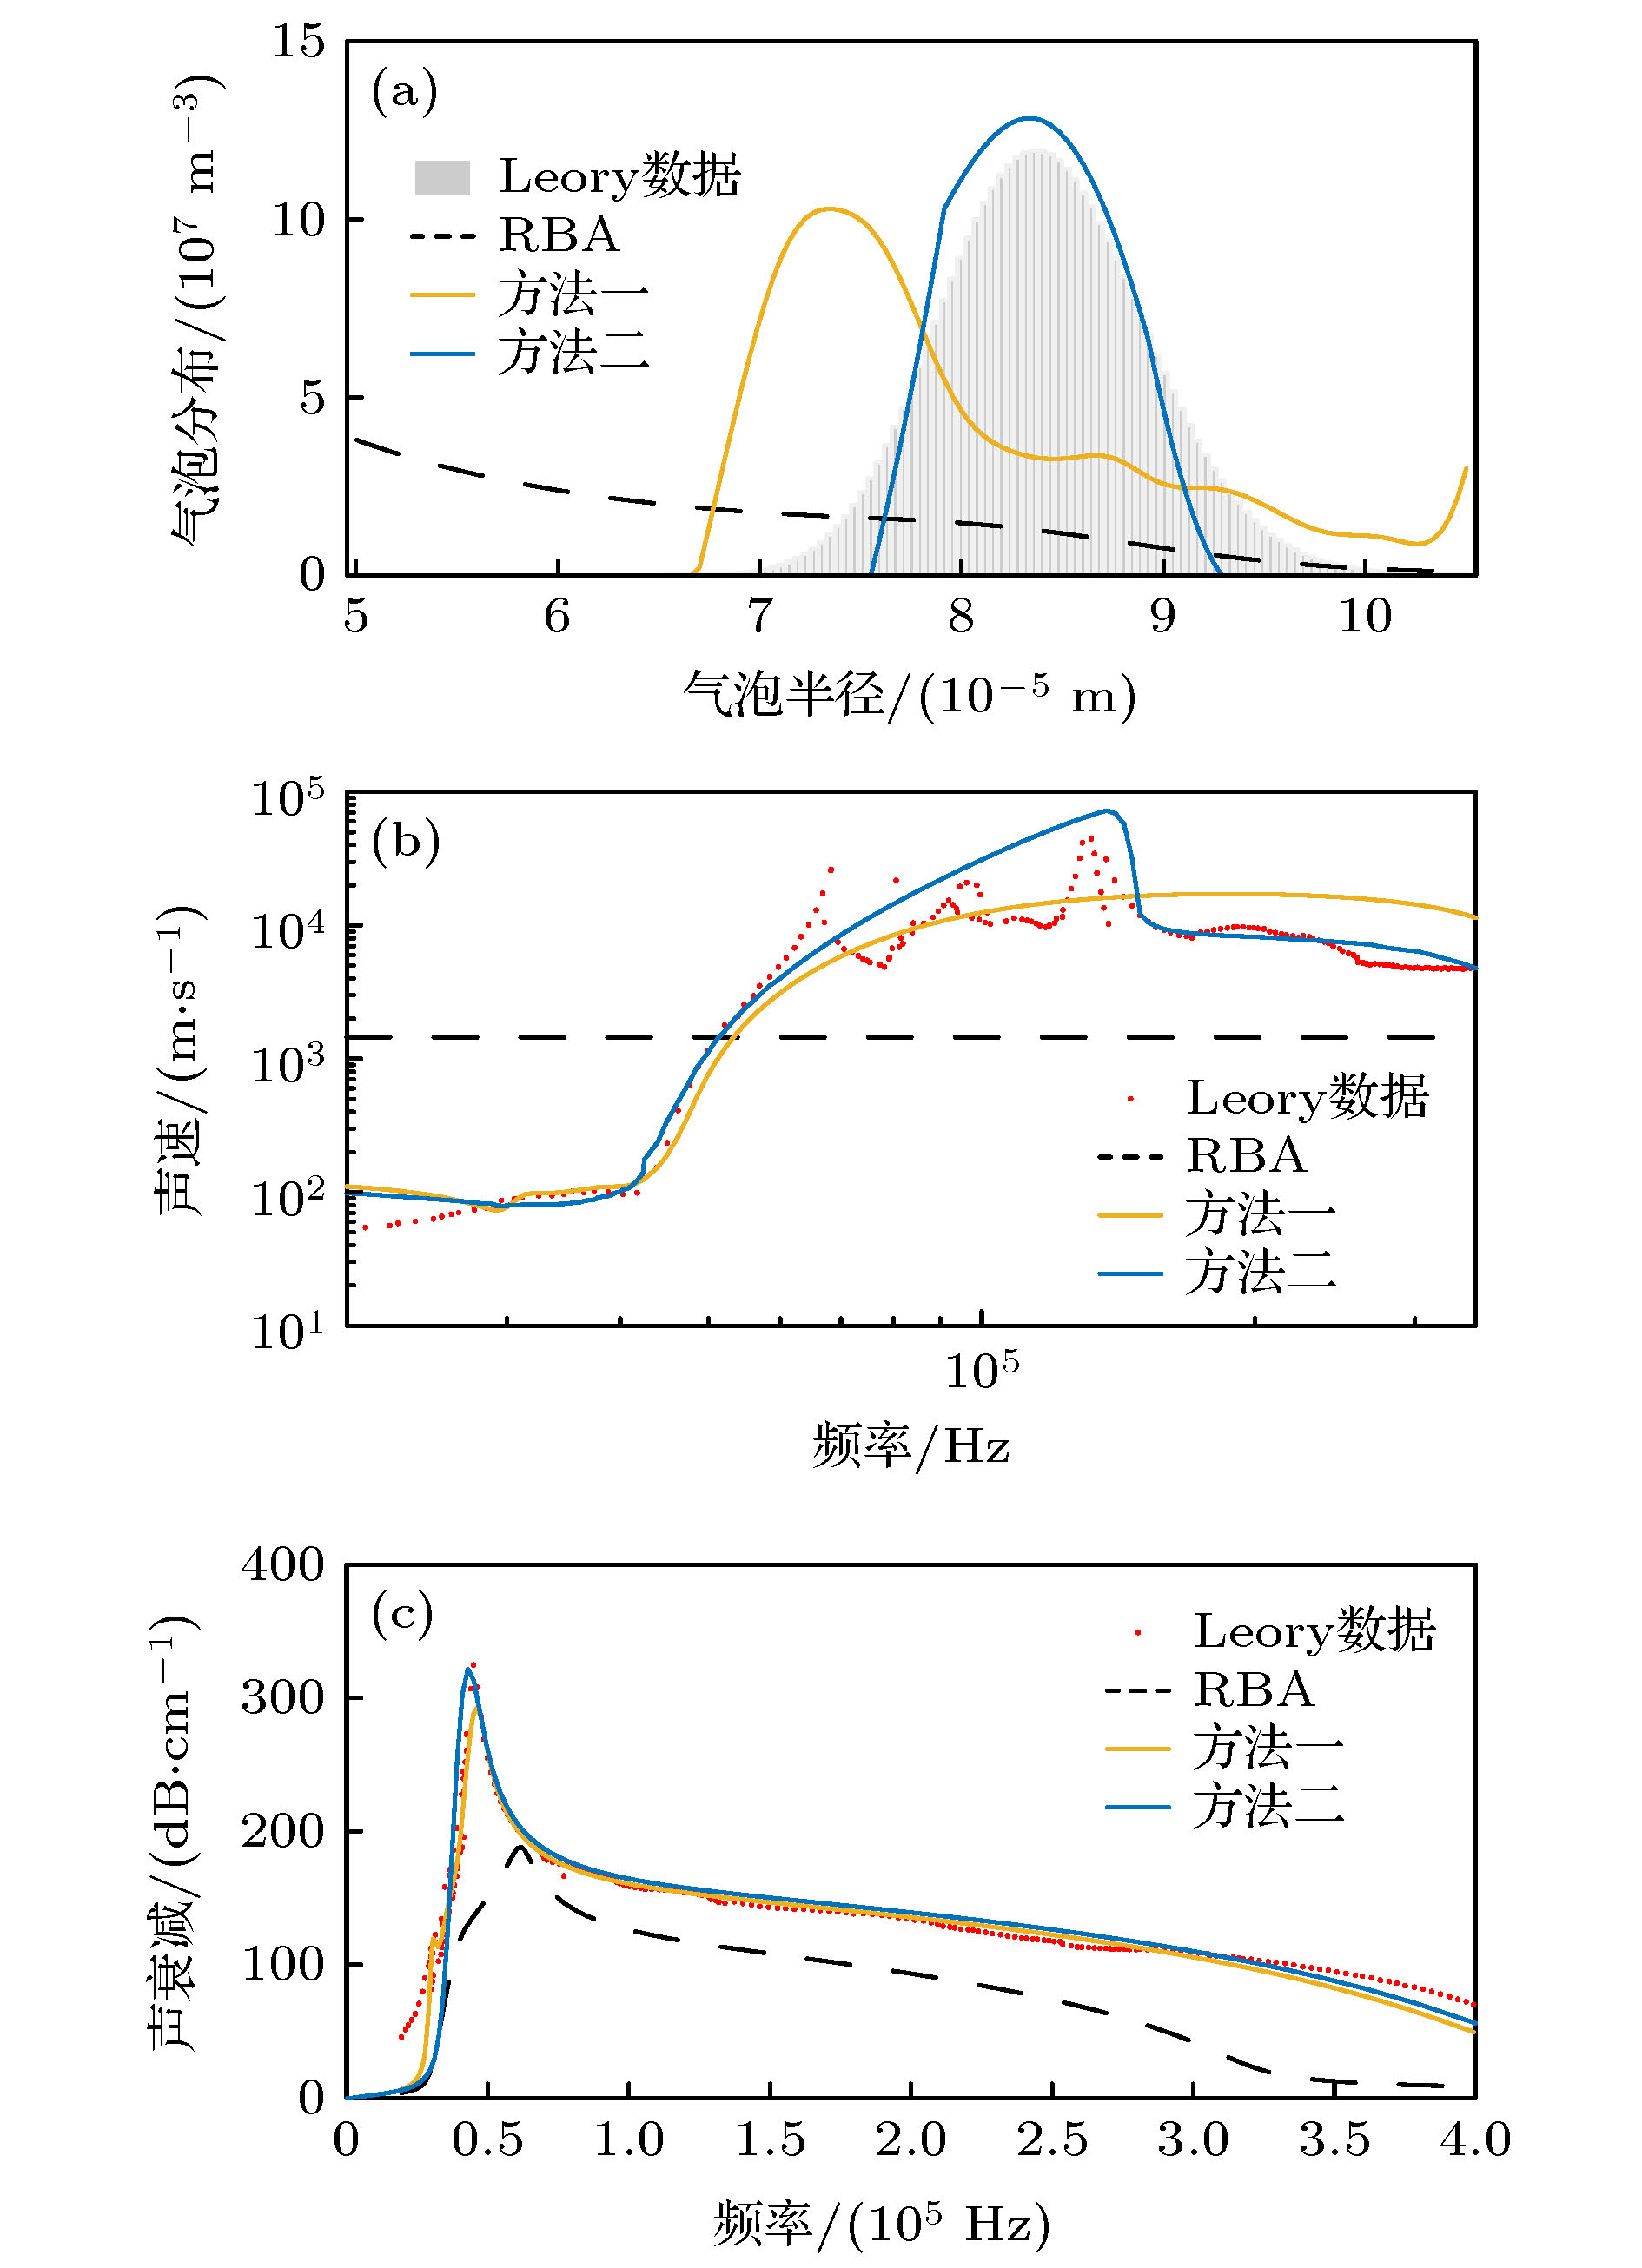
$\beta = 1.5 \times {10^{ - 3}}$ , 平均半径$\overline r = 8.2 \times {10^{ - 5}}\;{\rm{ m}}$ (a) 气泡分布反演结果; (b) 相速度计算结果; (c) 声衰减计算结果Fig. 4. Inversion results of example 2, void fraction
$\beta = 1.5 \times {10^{ - 3}}$ , mean radius$\overline r = 8.2 \times {10^{ - 5}}\;{\rm{ m}}$ : (a) Bubble distributions; (b) phase speed; (c) sound attenuation.图 5 例3数据的反演结果图, 气泡群孔隙率
$\beta {\rm{ = 9}}{\rm{.4}} \times {10^{{\rm{ - 3}}}}$ , 平均半径$\overline r = 8.6 \times {10^{ - 5}}\;{\rm{ m}}$ (a) 气泡分布反演结果; (b) 相速度计算结果; (c) 声衰减计算结果Fig. 5. Inversion results of example 3, void fraction
$\beta = 9{\rm{.4}} \times {10^{{\rm{ - 3}}}}$ , mean radius$\overline r = 8.6 \times {10^{ - 5}}\;{\rm{ m}}$ : (a) Bubble distributions; (b) phase speed; (c) sound attenuation.图 7 例4数据的反演结果图, 气泡群孔隙率
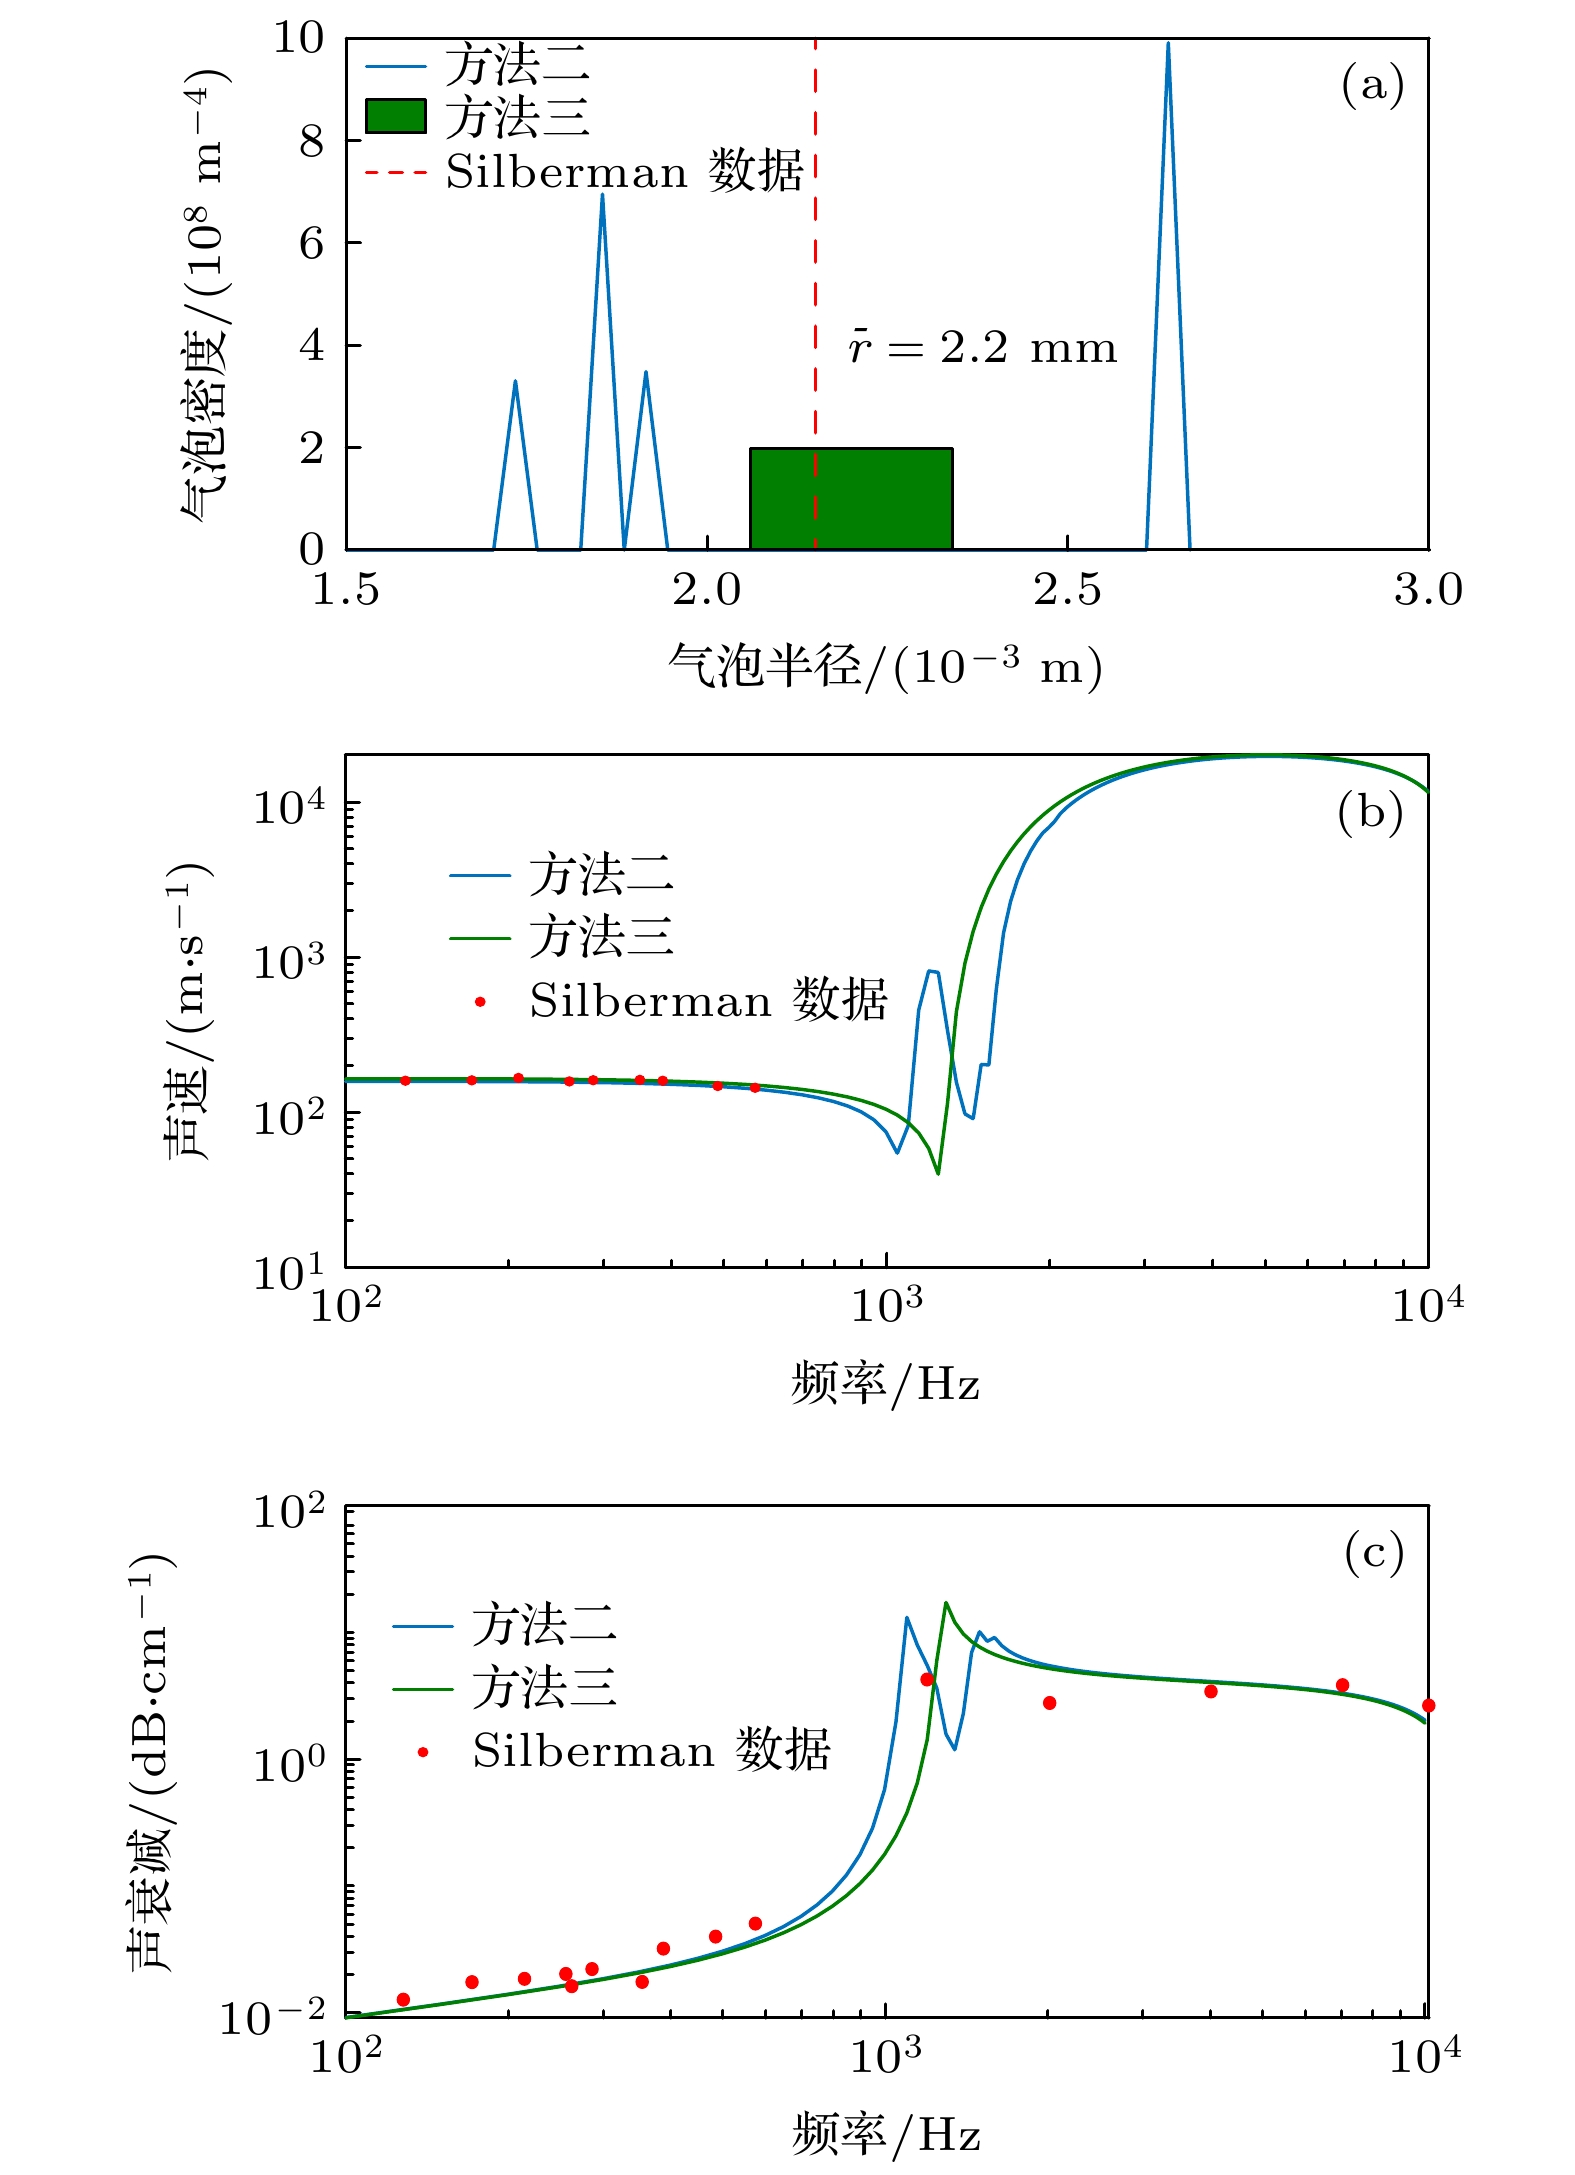
$\beta = 5.3 \times {10^{ - 3}}$ , 平均半径$\overline r = 2.2\;{\rm{ mm}}$ (a) 气泡分布反演结果; (b)相速度计算结果; (c)声衰减计算结果Fig. 7. Inversion results of example 4, void fraction
$\beta = 5.3 \times {10^{ - 3}}$ , mean radius$\overline r = 2.2\;{\rm{ mm}}$ : (a) Bubble distributions; (b) phase speed; (c) sound attenuation.表 1 各实验算例中的气泡分布
Table 1. Bubble distribution of 4 experimental examples
-
[1] 蒋涛, 刘凯, 张江 2010 兵工学报 31 860
Jiang T, Liu K, Zhang J 2010 Acta Armam. 31 860
[2] 王少雄, 李玉星, 刘翠伟, 梁杰, 李安琪, 薛源 2020 化工学报 71 1898
Wang S X, Li Y X, Liu C W, Liang J, Li A Q, Xue Y 2020 J. Chem. Ind. Eng. (China) 71 1898
[3] 王勇, 林书玉, 张小丽 2013 62 064304
 Google Scholar
Wang Y, Lin S Y, Zhang X L 2013 Acta Phys. Sin. 62 064304
 Google Scholar
[4] Medwin H 1970 J. Geophys. Res. 75 599
 Google Scholar
[5] Medwin H 1974 J. Acoust. Soc. Am. 56 1100
 Google Scholar
[6] Medwin H 1977 J. Geophys. Res. 82 971
 Google Scholar
[7] Qian Z W 1993 J. Sound Vib. 168 327
 Google Scholar
[8] Commander K W, Moritz E 1989 J. Acoust. Soc. Am. 85 2665
 Google Scholar
[9] Commander K W, Moritz E 1989 Oceans' 89 Conference Proceedings Florida, America, September 18−21, 1989 pp1181−1185
[10] Caruthers J W, Elmore P A 1999 J. Acoust. Soc. Am. 106 117
[11] Choi B K, Yoon S W 2001 IEEE J. Oceanic Eng. 26 125
 Google Scholar
[12] Choi B K, Kim B C, Kim B N 2006 Ocean Sci. J. 41 195
 Google Scholar
[13] Czerski, H. 2012 J. Atmos. Oceanic Technol. 29 1139
 Google Scholar
[14] Mantouka A, Dogan H, White P R 2016 J. Acoust. Soc. Am. 140 274
 Google Scholar
[15] 谢萍 硕士学位论文 (青岛: 中国海洋大学)
Xie P 2011 M. S. Thesis (Qingdao: Ocean University of China) (in Chinese)
[16] 王众, 张静远, 张洪刚 2019 海军工程大学学报 31 74
 Google Scholar
Wang Z, Zhang J Y, Zhang H G 2019 J. Nav. Univ. Eng. 31 74
 Google Scholar
[17] Duraiswami R, Prabhukumar S, Chahine G L 1998 J. Acoust. Soc. Am. 27 2569
[18] Wu X J, Chahine G L 2010 J. Hydrodyn. Ser. B 22 330
[19] Chahine G L 2009 J. Hydrodyn. 21 316
 Google Scholar
[20] Leighton T G, Baik K, Jiang J 2012 Proc. Roy. Soc. A-Math. Phys. 468 2461
[21] Silberman E. 1957 J. Acoust. Soc. Am. 29 925
 Google Scholar
[22] Leroy V, Strybulevych A, Page J H, Scanlon M G 2008 J. Acoust. Soc. Am. 123 1931
 Google Scholar
[23] Kargl S G 2002 J. Acoust. Soc. Am. 111 168
 Google Scholar
[24] Fuster D, Conoir J M, Colonius T 2014 Phys. Rev. E 90 063010
 Google Scholar
[25] Foldy L L 1945 Phys. Rev. 67 107
 Google Scholar
[26] Commander K W, Prosperetti A 1989 J. Acoust. Soc. Am. 85 732
 Google Scholar
[27] Lukas M A 1993 Numer. Math. 66 41
 Google Scholar
[28] Wilson P S, Roy R A, Carey W M 2005 J. Acoust. Soc. Am. 117 1895
 Google Scholar
计量
- 文章访问数: 8246
- PDF下载量: 88
- 被引次数: 0


 下载:
下载:


