-
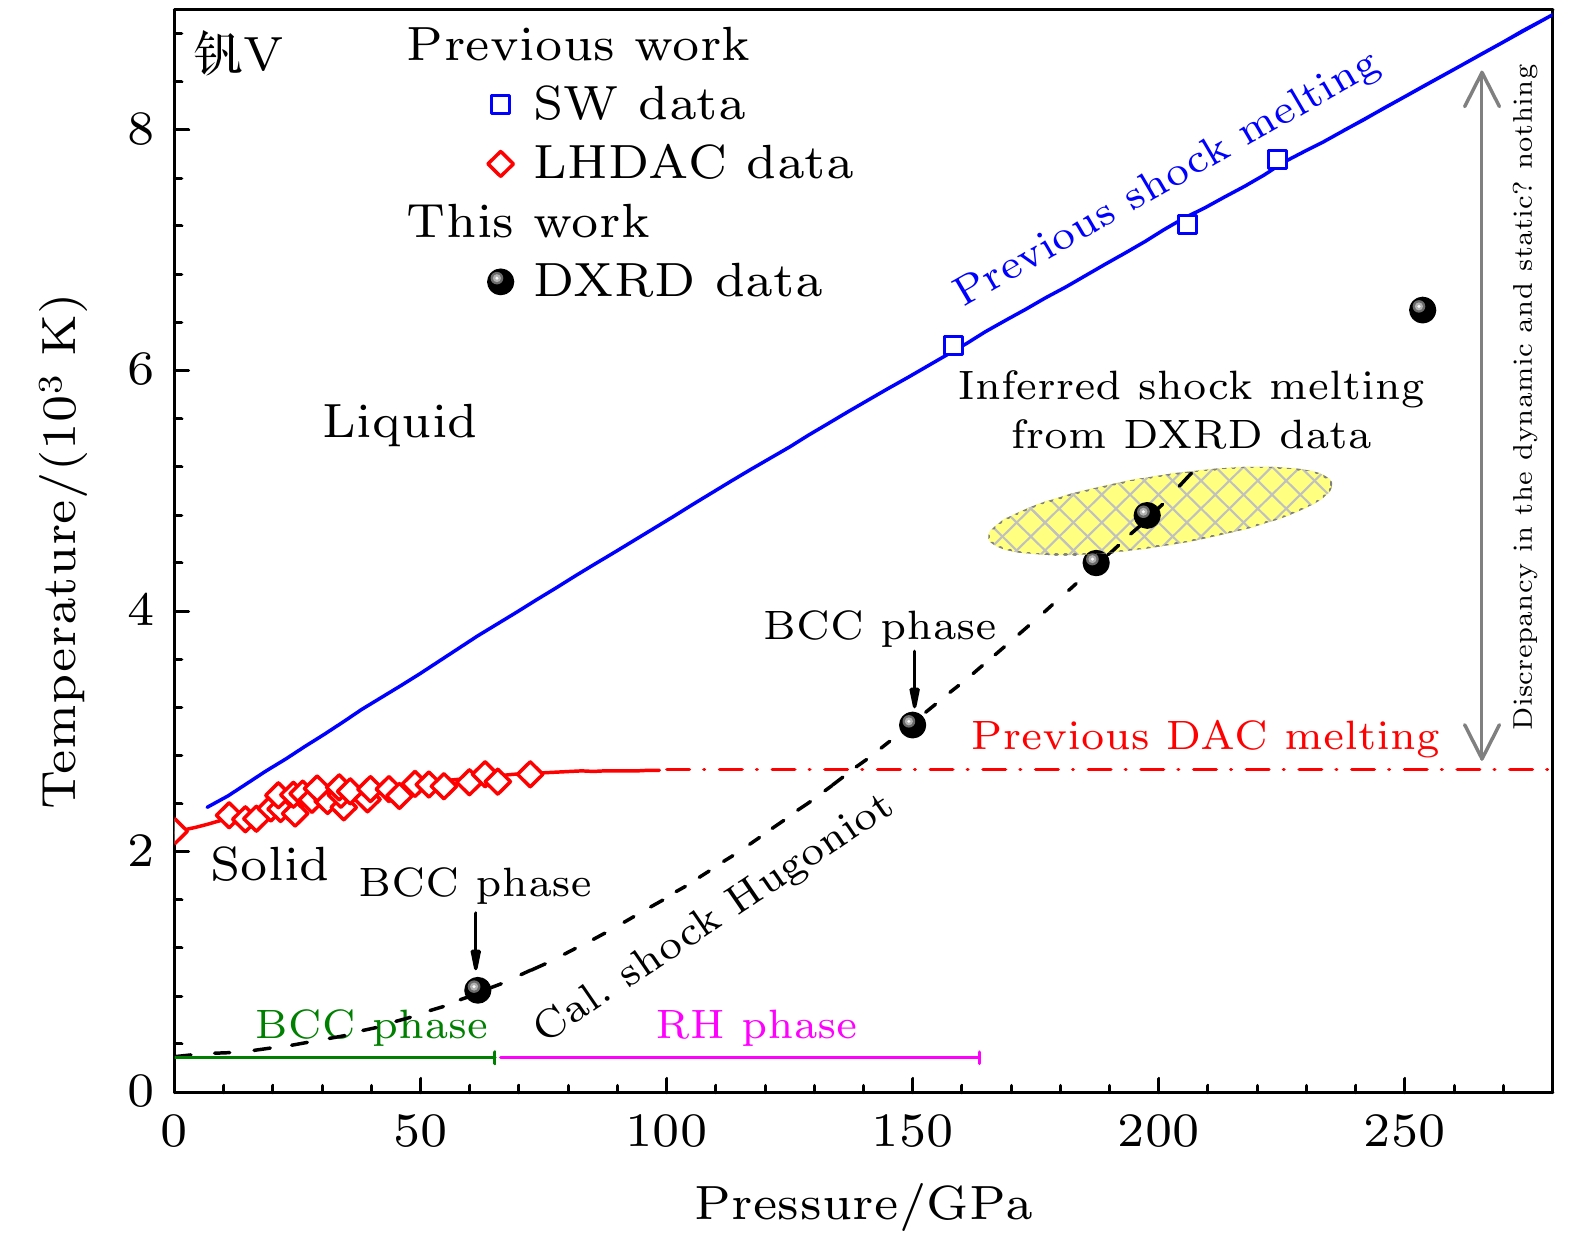
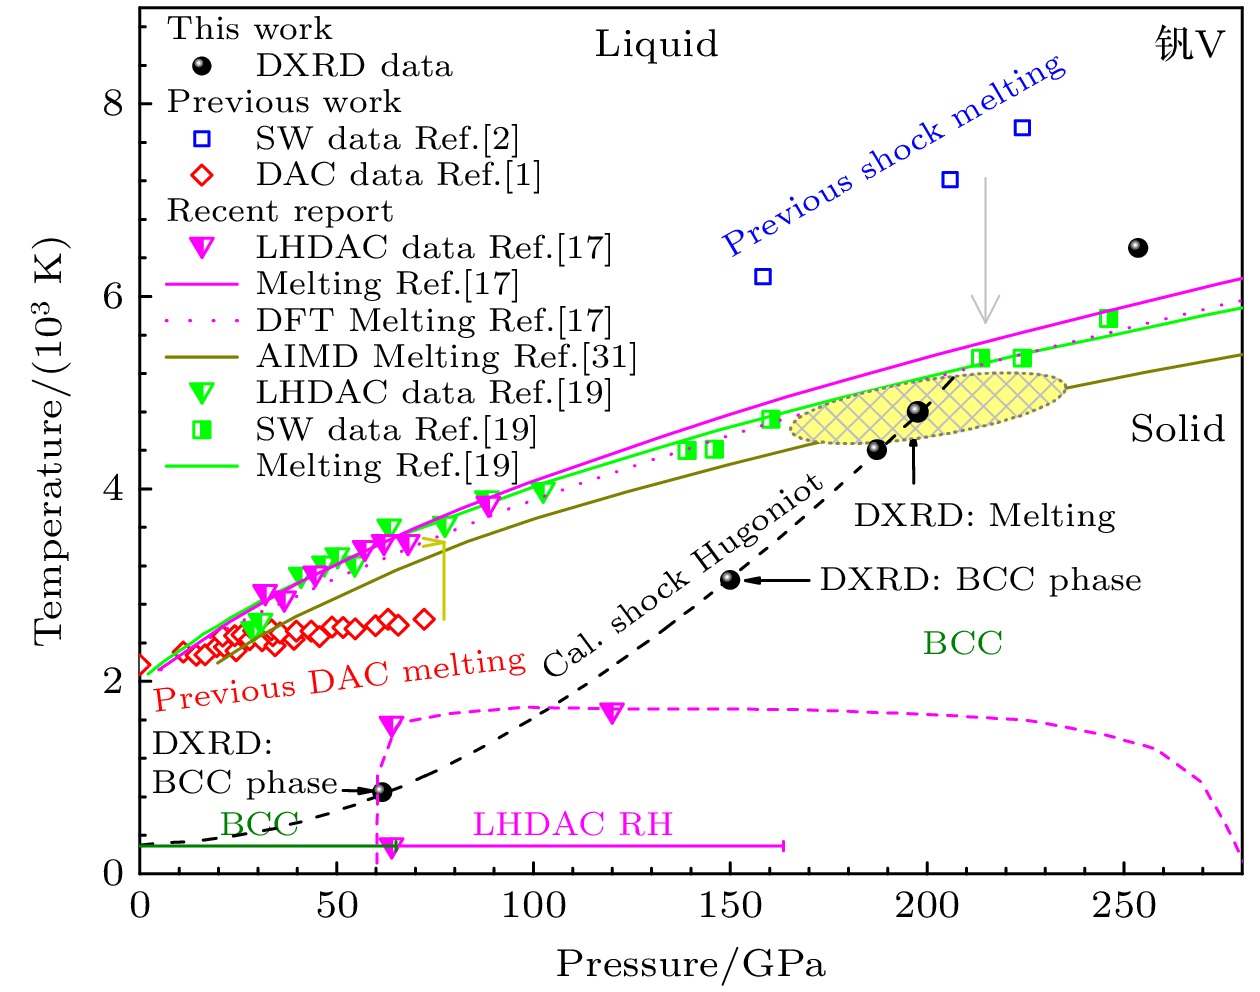
高压结构与相变研究对理解物质在极端压缩条件下的性质变化和动力学响应行为具有重要的科学价值, 然而部分过渡金属的动/静高压熔化线差异一直是多年来悬而未解的科学难题. 其中动、静高压固-液相界幅值差异最大的是第五副族金属, 以钒最为反常, 至今仍缺乏自洽的物理认识和理解. 本文采用高能脉冲激光驱动的瞬态X射线衍射诊断技术, 对冲击压缩下钒的熔化特性进行了研究, 首次获取了冲击压缩下钒在200 GPa范围内的晶体结构响应随压力变化的衍射图谱. 研究发现, 冲击压力为155 GPa时, 钒仍保持固态bcc相; 至约190 GPa时转变为液态. 这一结果否定了早期确定的静压熔化线, 与最新的冲击熔化线及高温高压相图符合, 为钒高压熔化线的统一认识提供了新的微观实验证据. 本工作亦可推广至其他材料熔化特性的研究工作中.The solid-liquid phase transition under shock wave loading in materials is called shock melting. Shock melting is important not only in fields like high pressure EOS or material dynamic response, but also in applications like device protection in modern industry and national defense construction. The obtaining of precise melting curve is more than understanding the high pressure melting behavior, and it can provide the reliable evidence for the theoretical model of melting mechanism. So the solid-liquid phase transition under extreme conditions is a research hotspot, and a lot of researches have been carried out. But, the enormous discrepancy between the melting curve of dynamic loading and hydrostatic loading in transition metals, especially, the vanadium has been unclear for decades. The difference in melting temperature under 200 GPa between dynamic loading and hydrostatic loadirng is as large as twice (about 4000 K). Recently, Errandonea and Zhang’s experiments present a new insight into this discrepancy, indicating that the new shock melting curve is consistent with the extrapolated melting curve contained by LH-DAC. But all the dynamic loading experimental data are measured by macroscopic quantities; they can determine the occurrence of the phase transition, but cannot provide the microscopic structure of the material under extreme conditions. So, as the technic of in situ X-ray diffraction has developed well in recent years, we use the high power laser driving technic combining with in situ X-ray diffraction measurement to explore the structure of vanadium near the melting line. We measure the micro structure of vanadium at up to 200 GPa in shock experiment for the first time. We find that the bcc phase transition is not observed at around 60 GPa, which is different from previous experiments in DAC or gas gun loading experiments, but consistent with Chen’s leaser driving experiment. The result confirms that when the impact pressure is 155 GPa, vanadium still remains solid BCC phase. It becomes liquid at about 190 GPa. In contract to Zhang’s results, the DXRD melting point is consistent with the new melting line. This work provides the evidence of the consistency of shock and hydrostatic melting curve, confirming the phase boundary of vanadium under 200 GPa. This work has important scientific significance in understanding the pressure melting behavior of transition metals. The method in this work can be applied to the research of melting properties of other materials.
-
Keywords:
- vanadium /
- shock melting /
- in situ X-ray diffraction /
- high power laser facility
[1] Errandonea D, Schwager B, Ditz R, Gessmann C, Boehler R, Ross M 2001 Phys. Rev. B 63 132104
 Google Scholar
[2] Dai C D, Jin X G, Zhou X M, Liu J J, Hu J B 2001 J. Phys. D:Appl. Phys. 34 3064
 Google Scholar
[3] Yoo C S, Holmes N C, Ross M, Webb D J, Pike C 1993 Phys. Rev. Lett. 70 3931
 Google Scholar
[4] Dai C D, Hu J B, Tan H 2009 J. Appl. Phys. 106 043519
 Google Scholar
[5] Dewaele A, Mezouar M, Guignot N, Loubeyre P 2010 Phys. Rev. Lett. 104 255701
 Google Scholar
[6] Hixson R S, Boness D A, Shaner J W, Moriarty J 1989 Phys. Rev. Lett. 62 637
 Google Scholar
[7] Errandonea D 2005 Physica B: Condensed Matter 357 356
 Google Scholar
[8] Ding Y, Ahuja R, Shu J, Chow P, Luo W, Mao H K 2007 Phys. Rev. Lett. 98 085502
 Google Scholar
[9] Qiu S L, Marcus P M 2008 J. Phys. Condens. Matter. 20 275218
 Google Scholar
[10] Jenei Z, Liermann H P, Cynn H, Klepeis J H P, Baer B J, Evans W J 2011 Phys. Rev. B 83 054101
[11] 俞宇颖, 谭叶, 戴诚达, 李雪梅, 李英华, 谭华 2014 63 026202
 Google Scholar
Yu Y Y, Tan Y, Dai C D, Li X M, Li Y H, Tan H 2014 Acta Phys. Sin. 63 026202
 Google Scholar
[12] Foster J M, Comley A J, Case G S, Avraam P, Rothman S D, Higginbotham A, Floyd E K R, Gumbrell E T, Luis J J D, McGonegle D, Park N T, Peacock L J, Poulter C P, Suggit M J, Wark J S 2017 J. Appl. Phys. 122 025117
 Google Scholar
[13] Wang Y X, Wu Q, Chen X R, Geng H Y 2016 Sci. Rep. 6 32419
 Google Scholar
[14] Akahama Y, Kawaguchi S, Hirao N, Ohishi Y 2021 J. Appl. Phys. 129 135902
 Google Scholar
[15] Wang Y X, Geng H Y, Wu Q, Chen X R, Sun Y 2017 J. Appl. Phys. 122 235903
 Google Scholar
[16] Wang Y X, Geng H Y, Wu Q, Chen X R 2020 J. Chem. Phys. 152 024118
 Google Scholar
[17] Errandonea D, MacLeod S G, Burakovsky L, Santamaria-Perez D, Proctor J E, Cynn H, Mezouar M 2019 Phys. Rev. B 100 094111
 Google Scholar
[18] Li J, Wu Q, Li J B, Xue T, Tan Y, Zhou X M, Zhang Y J, Xiong Z W, Gao Z P, Sekine T 2020 Geophys. Res. Lett. 47 e2020GL087758
[19] Zhang Y J, Tan Y, Geng H Y, Salke N P, Gao Z P, Li J, Sekine T, Wang Q M, Greenberg E, Prakapenka V B, Lin J F 2020 Phys. Rev. B 102 214104
[20] Johnson Q, Mitchell A C 1972 Phys. Rev. Lett. 29 1369
 Google Scholar
[21] Gupta Y M, Zimmerman K A, Rigg P A, Zaretsky E B, Savage D M, Bellamy P M 1999 Rev. Sci. Instrum. 70 4008
 Google Scholar
[22] Kalantar D H, Chandler E A, Colvin J D, Lee R, Remington B A, Weber S V, Wiley L G, Hauer A, Wark J S, Loveridge A, Failor B H, Meyers M A, Ravichandran G 1999 Rev. Sci. Instrum. 70 629
 Google Scholar
[23] Kalantar D H, Belak J F, Collins G W, Colvin J D, Davies H M, Eggert J H, Germann T C, Hawreliak J, Holian B L, Kadau K, Lomdahl P S, Lorenzana H E, Meyers M A, Rosolankova K, Schneider M S, Sheppard J, Stolken J S, Wark J S 2005 Phys. Rev. Lett. 95 075502
 Google Scholar
[24] Coppari F, Smith R F, Eggert J H, Wang J, Rygg J R, Lazicki A, Hawreliak J A, Collins G W, Duffy T S 2013 Nat. Geosci. 6 926
 Google Scholar
[25] Gorman M G, Briggs R, McBride E E, Higginbotham A, Arnold B, Eggert J H, Fratanduono D E, Galtier E, Lazicki A E, Lee H J, Liermann H P, Nagler B, Rothkirch A, Smith R F, Swift D C, Collins G W, Wark J S, McMahon M I 2015 Phys. Rev. Lett. 115 095701
 Google Scholar
[26] Sharma S M, Turneaure S J, Winey J M, Li Y, Rigg P, Schuman A, Sinclair N, Toyoda Y, Wang X, Weir N, Zhang J, Gupta Y M 2019 Phys. Rev. Lett. 123 045702
 Google Scholar
[27] 李俊, 陈小辉, 吴强, 罗斌强, 李牧, 阳庆国, 陶天炯, 金柯, 耿华运, 谭叶, 薛桃 2017 66 136101
 Google Scholar
Li J, Chen X H, Wu Q, Luo B Q, Li M, Yang Q G, Tao T J, Jin K, Geng H Y, Tan Y, Xue T 2017 Acta Phys. Sin. 66 136101
 Google Scholar
[28] 陈小辉, 谭伯仲, 薛桃, 马云灿, 靳赛, 李志军, 辛越峰, 李晓亚, 李俊 2020 69 246201
 Google Scholar
Chen X H, Tan B Z, Xue T, Ma Y C, Jin S, Li Z J, Xin Y F, Li X Y, Li J 2020 Acta Phys. Sin. 69 246201
 Google Scholar
[29] 陶天炯, 翁继东, 王翔 2011 光电工程 38 39
Tao T J, Weng J D, Wang X 2011 Opto-Electron. Engineer. 38 39
[30] Zhang T, Wang S, Song H, Duan S, Liu H 2019 J. Appl. Phys. 126 205901
 Google Scholar
-
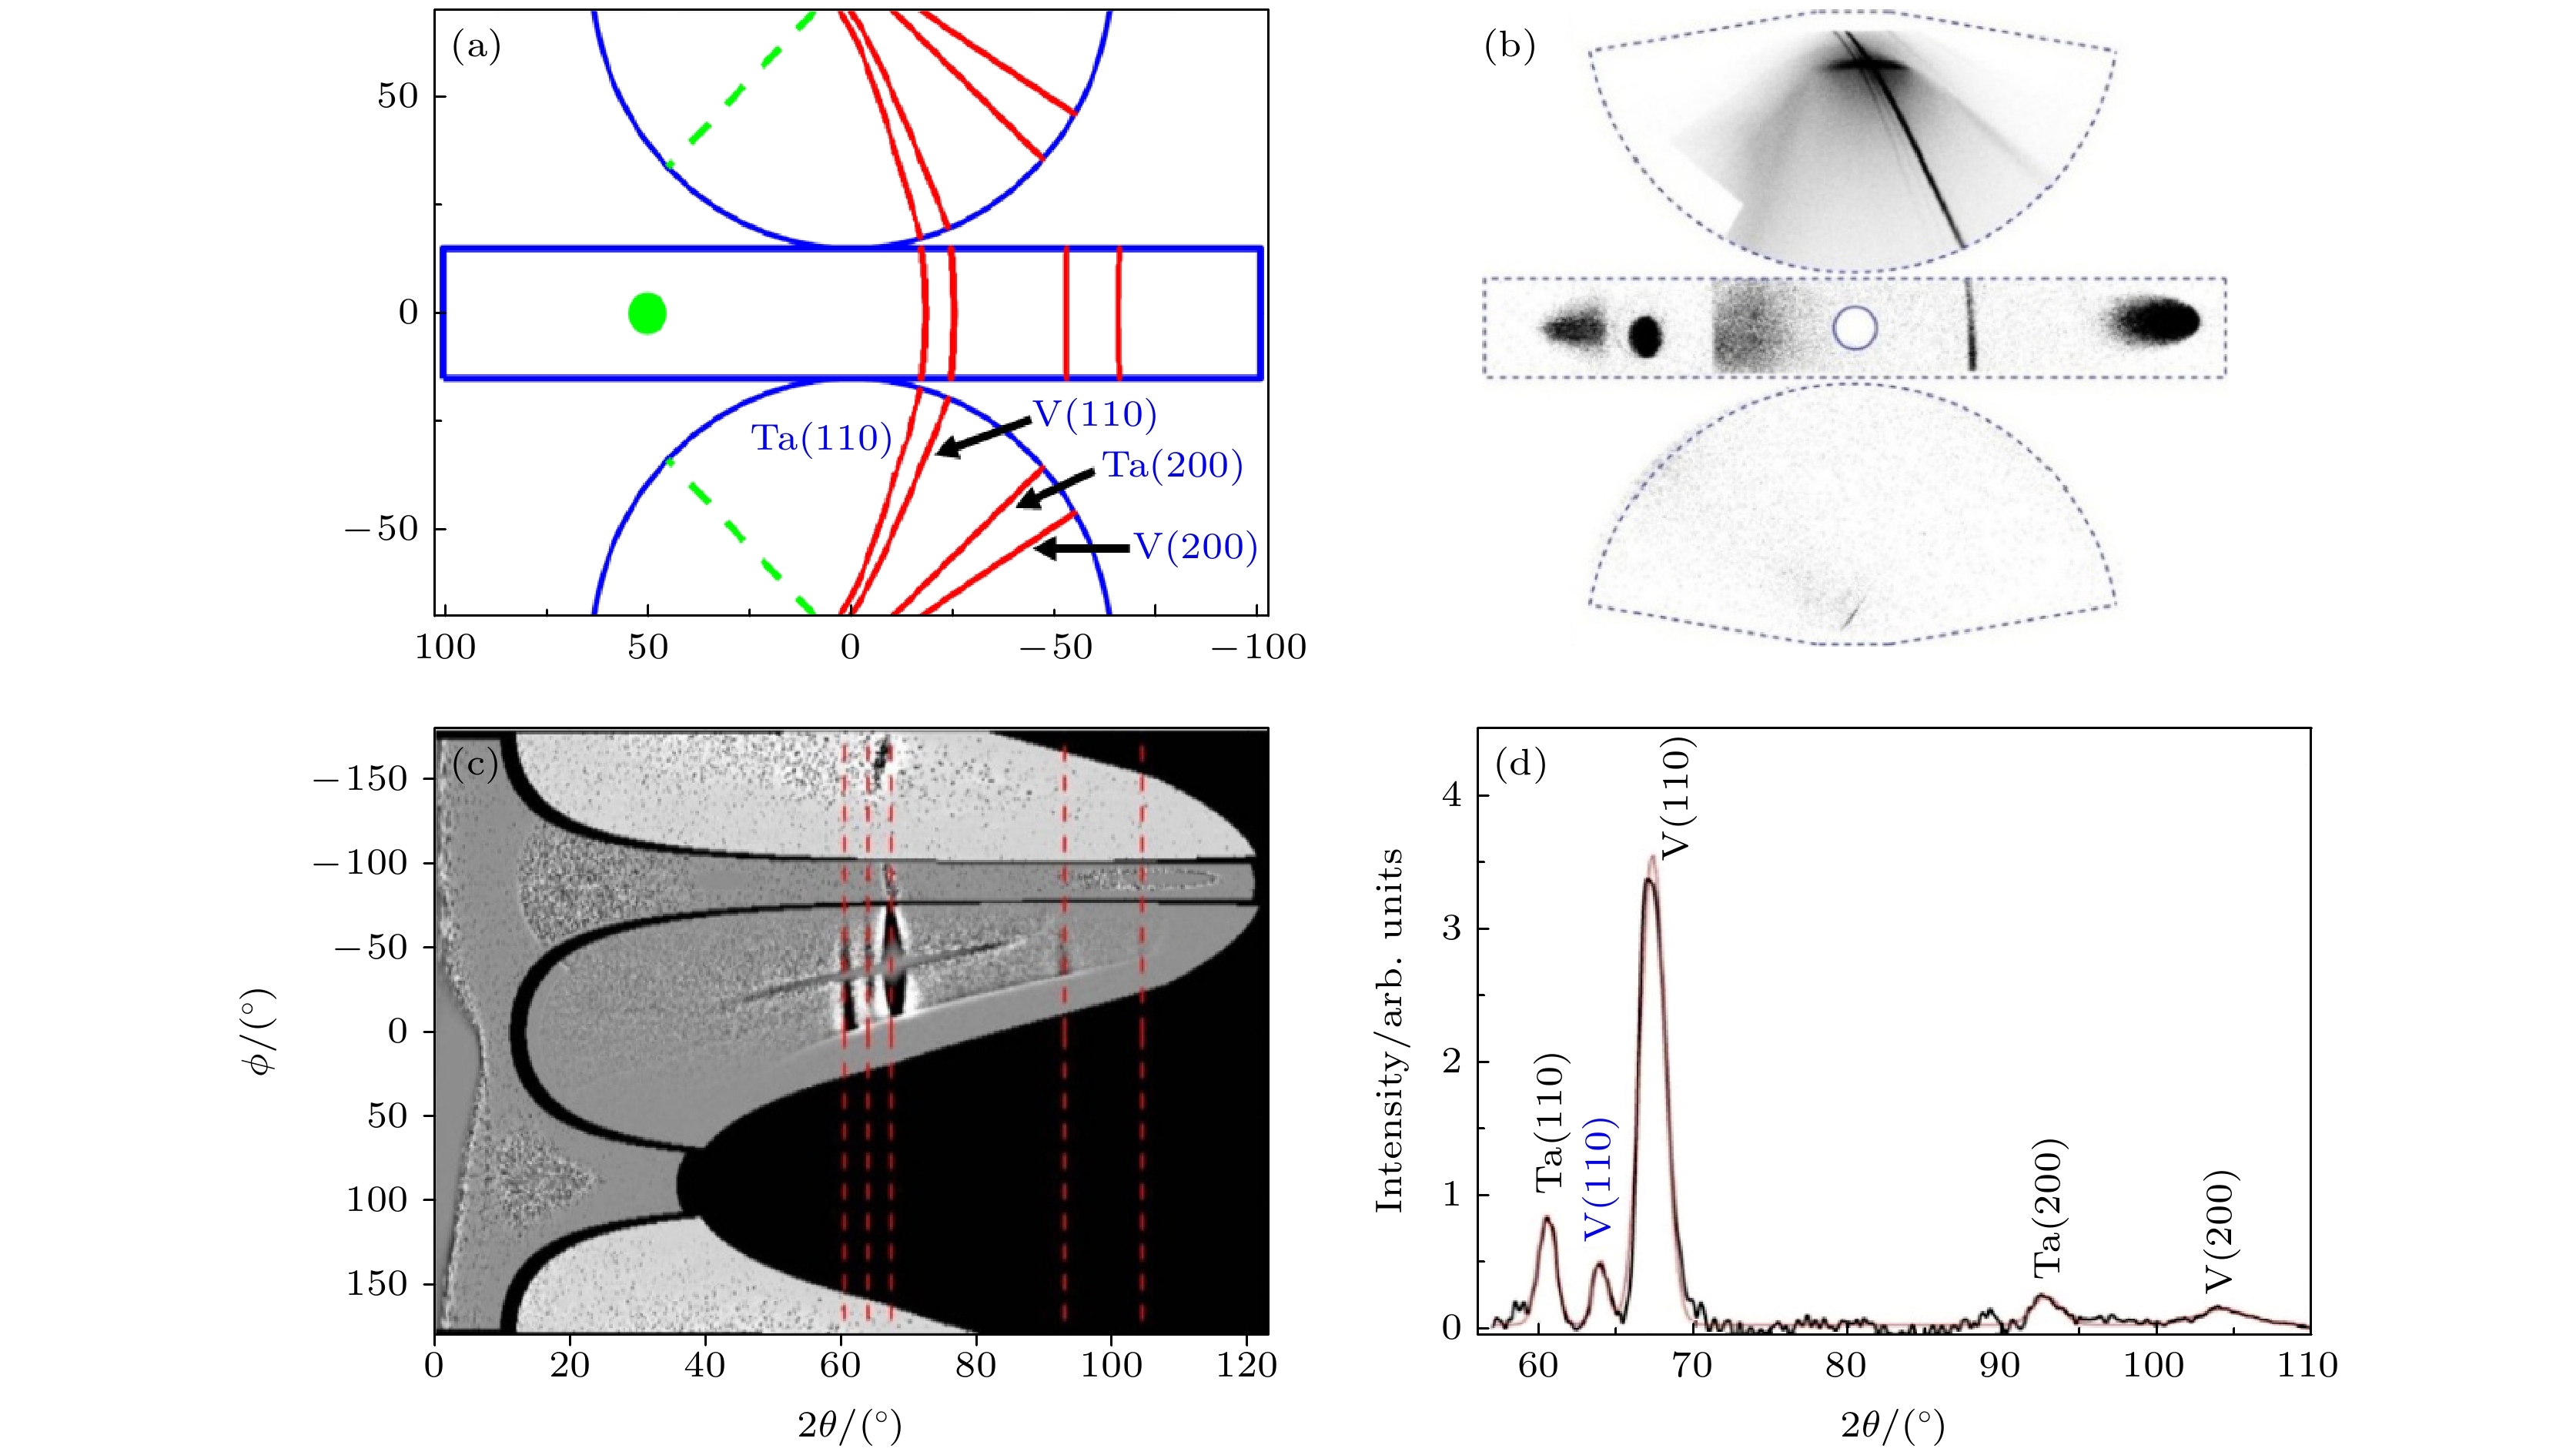
图 3 无冲击载荷(静态样品)下多晶钒X射线衍射图谱 (a)数值模拟计算结果; (b)IP板实测图谱; (c)转换至2θ-φ空间的衍射图像; (d)沿φ方向积分的X射线衍射谱线, 图中红色虚线为各衍射峰的理论位置
Fig. 3. The X-ray diffraction image of un-shocked crystalline vanadium: (a) the result of numerical simulation; (b) the original image recorded by image plates; (c) X-ray data projected into 2θ-φspace; (d) the one-dimensional X-ray diffraction pattern, the red dashed lines represent the theoretical position of diffraction peaks.
图 4 冲击压力61.7 GPa下获得的钒原位衍射图谱 (a) IP板实测图谱, 新增衍射峰见红色箭头所示; (b)转换至2θ-φ空间的衍射图像; (c)沿φ方向积分后的X射线衍射谱线.
Fig. 4. The in situ X-ray diffraction images under 61.7 GPa: (a) the original image recorded by image plates, the new diffraction peak is indicated by the arrow; (b) X-ray data projected into 2θ-φ space; (c) the one-dimensional X-ray diffraction pattern.
-
[1] Errandonea D, Schwager B, Ditz R, Gessmann C, Boehler R, Ross M 2001 Phys. Rev. B 63 132104
 Google Scholar
[2] Dai C D, Jin X G, Zhou X M, Liu J J, Hu J B 2001 J. Phys. D:Appl. Phys. 34 3064
 Google Scholar
[3] Yoo C S, Holmes N C, Ross M, Webb D J, Pike C 1993 Phys. Rev. Lett. 70 3931
 Google Scholar
[4] Dai C D, Hu J B, Tan H 2009 J. Appl. Phys. 106 043519
 Google Scholar
[5] Dewaele A, Mezouar M, Guignot N, Loubeyre P 2010 Phys. Rev. Lett. 104 255701
 Google Scholar
[6] Hixson R S, Boness D A, Shaner J W, Moriarty J 1989 Phys. Rev. Lett. 62 637
 Google Scholar
[7] Errandonea D 2005 Physica B: Condensed Matter 357 356
 Google Scholar
[8] Ding Y, Ahuja R, Shu J, Chow P, Luo W, Mao H K 2007 Phys. Rev. Lett. 98 085502
 Google Scholar
[9] Qiu S L, Marcus P M 2008 J. Phys. Condens. Matter. 20 275218
 Google Scholar
[10] Jenei Z, Liermann H P, Cynn H, Klepeis J H P, Baer B J, Evans W J 2011 Phys. Rev. B 83 054101
[11] 俞宇颖, 谭叶, 戴诚达, 李雪梅, 李英华, 谭华 2014 63 026202
 Google Scholar
Yu Y Y, Tan Y, Dai C D, Li X M, Li Y H, Tan H 2014 Acta Phys. Sin. 63 026202
 Google Scholar
[12] Foster J M, Comley A J, Case G S, Avraam P, Rothman S D, Higginbotham A, Floyd E K R, Gumbrell E T, Luis J J D, McGonegle D, Park N T, Peacock L J, Poulter C P, Suggit M J, Wark J S 2017 J. Appl. Phys. 122 025117
 Google Scholar
[13] Wang Y X, Wu Q, Chen X R, Geng H Y 2016 Sci. Rep. 6 32419
 Google Scholar
[14] Akahama Y, Kawaguchi S, Hirao N, Ohishi Y 2021 J. Appl. Phys. 129 135902
 Google Scholar
[15] Wang Y X, Geng H Y, Wu Q, Chen X R, Sun Y 2017 J. Appl. Phys. 122 235903
 Google Scholar
[16] Wang Y X, Geng H Y, Wu Q, Chen X R 2020 J. Chem. Phys. 152 024118
 Google Scholar
[17] Errandonea D, MacLeod S G, Burakovsky L, Santamaria-Perez D, Proctor J E, Cynn H, Mezouar M 2019 Phys. Rev. B 100 094111
 Google Scholar
[18] Li J, Wu Q, Li J B, Xue T, Tan Y, Zhou X M, Zhang Y J, Xiong Z W, Gao Z P, Sekine T 2020 Geophys. Res. Lett. 47 e2020GL087758
[19] Zhang Y J, Tan Y, Geng H Y, Salke N P, Gao Z P, Li J, Sekine T, Wang Q M, Greenberg E, Prakapenka V B, Lin J F 2020 Phys. Rev. B 102 214104
[20] Johnson Q, Mitchell A C 1972 Phys. Rev. Lett. 29 1369
 Google Scholar
[21] Gupta Y M, Zimmerman K A, Rigg P A, Zaretsky E B, Savage D M, Bellamy P M 1999 Rev. Sci. Instrum. 70 4008
 Google Scholar
[22] Kalantar D H, Chandler E A, Colvin J D, Lee R, Remington B A, Weber S V, Wiley L G, Hauer A, Wark J S, Loveridge A, Failor B H, Meyers M A, Ravichandran G 1999 Rev. Sci. Instrum. 70 629
 Google Scholar
[23] Kalantar D H, Belak J F, Collins G W, Colvin J D, Davies H M, Eggert J H, Germann T C, Hawreliak J, Holian B L, Kadau K, Lomdahl P S, Lorenzana H E, Meyers M A, Rosolankova K, Schneider M S, Sheppard J, Stolken J S, Wark J S 2005 Phys. Rev. Lett. 95 075502
 Google Scholar
[24] Coppari F, Smith R F, Eggert J H, Wang J, Rygg J R, Lazicki A, Hawreliak J A, Collins G W, Duffy T S 2013 Nat. Geosci. 6 926
 Google Scholar
[25] Gorman M G, Briggs R, McBride E E, Higginbotham A, Arnold B, Eggert J H, Fratanduono D E, Galtier E, Lazicki A E, Lee H J, Liermann H P, Nagler B, Rothkirch A, Smith R F, Swift D C, Collins G W, Wark J S, McMahon M I 2015 Phys. Rev. Lett. 115 095701
 Google Scholar
[26] Sharma S M, Turneaure S J, Winey J M, Li Y, Rigg P, Schuman A, Sinclair N, Toyoda Y, Wang X, Weir N, Zhang J, Gupta Y M 2019 Phys. Rev. Lett. 123 045702
 Google Scholar
[27] 李俊, 陈小辉, 吴强, 罗斌强, 李牧, 阳庆国, 陶天炯, 金柯, 耿华运, 谭叶, 薛桃 2017 66 136101
 Google Scholar
Li J, Chen X H, Wu Q, Luo B Q, Li M, Yang Q G, Tao T J, Jin K, Geng H Y, Tan Y, Xue T 2017 Acta Phys. Sin. 66 136101
 Google Scholar
[28] 陈小辉, 谭伯仲, 薛桃, 马云灿, 靳赛, 李志军, 辛越峰, 李晓亚, 李俊 2020 69 246201
 Google Scholar
Chen X H, Tan B Z, Xue T, Ma Y C, Jin S, Li Z J, Xin Y F, Li X Y, Li J 2020 Acta Phys. Sin. 69 246201
 Google Scholar
[29] 陶天炯, 翁继东, 王翔 2011 光电工程 38 39
Tao T J, Weng J D, Wang X 2011 Opto-Electron. Engineer. 38 39
[30] Zhang T, Wang S, Song H, Duan S, Liu H 2019 J. Appl. Phys. 126 205901
 Google Scholar
计量
- 文章访问数: 6176
- PDF下载量: 84
- 被引次数: 0


 下载:
下载:
