-
多普勒差分干涉仪是近年来发展起来的一种适用于中高层大气风场星载测量的干涉仪, 它依靠对干涉图相位的精确反演计算气辉谱线的多普勒频移得到大气风速. 环境温度的变化导致干涉仪光机组件发生热变形, 造成成像面在干涉方向上的热漂移, 改变相位的像元分布, 直接引入相位误差从而影响风速反演. 为了减小这种成像热漂移对多普勒差分干涉仪相位反演的影响, 本文用分段拟合的方法检测光栅的标尺刻槽在干涉图中成像图案的边缘, 定位刻槽图案的亚像元位置并依此监测成像热漂移. 在近红外多普勒差分干涉仪样机的热稳定实验中, 像面热漂移检测结果与环境温度在高频振荡变化趋势上表现出较高一致性, 二者相关系数经去基线后可达0.86, 而干涉图相位漂移经成像热漂移校正后其高频振荡也得到大幅抑制, 证明了该算法的有效性. 为了进一步验证该算法精度, 计算了数据信噪比以及拟合所用各项数据分布特征参数误差对边缘检测的影响, 结果表明, 边缘检测精度主要受数据信噪比和条纹频率参数准确性的制约, 当拟合用条纹频率参数误差小于0.5%而其他数据分布特征参数误差在1%以内, 数据信噪比在约35倍以上时, 本文算法可以实现高于0.05像元的检测精度.Doppler asymmetric spatial heterodyne spectroscopy is recently developed for spaceborne measurement of middle and upper atmospheric wind field, which relies on the accurate inverse of interferogram phase to calculate the Doppler shift of airglow emission lines. The change of temperature leads the optical and mechanical components to thermally deformed, causing the imaging plane to thermally drift relative to the detector, changing the distribution of interferogram phase on pixels, and directly introducing phase errors to affect the wind speed inversion. In order to reduce the influence of imaging thermal drift on phase inversion, the segmented fitting method is used in this paper to detect the sub-pixel edges of notch patterns and monitor imaging thermal drift accordingly. In the thermal stability test of a near-infrared Doppler asymmetric spatial heterodyne interferometer prototype, the thermal imaging drifts and ambient temperature show a high consistency in the trend of high-frequency oscillation, and the correlation coefficient can reach 0.86 after removing the baseline. After phase correct by using the thermal imaging shift, the high-frequency oscillation of interferogram phase shift is also greatly suppressed. In order to further verify the accuracy of the algorithm, the influence of the data signal-to-noise ratio and the data distribution characteristic parameter errors used in the fitting on the edge detection are simulated. The results show that the edge detection accuracy is restricted mainly by the data signal-to-noise ratio and the accuracy of the fringe frequency parameters. When the error of the fringe frequency parameter used for fitting is less than 0.5%, the error of other data distribution characteristic parameters is less than 5%, and the data signal-to-noise ratio is enhanced more than 35 times, the algorithm in this paper can achieve a detection accuracy higher than 0.05 pixels.
-
Keywords:
- atmospheric wind field measurement /
- Doppler asymmetric spatial heterodyne spectroscopy /
- interferometric imaging /
- imaging shift
[1] 叶剑勇, 张淳民, 赵葆常, 李英才 2008 57 0067
 Google Scholar
Ye J Y, Zhang C M, Zhao B C, Li Y C 2008 Acta Phys. Sin. 57 0067
 Google Scholar
[2] 阮锴, 张淳民, 赵葆常 2008 57 5435
 Google Scholar
Ruan K, Zhang C M, Zhao B C 2008 Acta Phys. Sin. 57 5435
 Google Scholar
[3] 朱化春, 张淳民, 简小华 2010 59 0893
 Google Scholar
Zhu H C, Zhang C M, Jian X H 2010 Acta Phys. Sin. 59 0893
 Google Scholar
[4] 张淳民, 朱兰艳 2010 59 0989
 Google Scholar
Zhang C M, Zhu L Y 2010 Acta Phys. Sin. 59 0989
 Google Scholar
[5] 唐远河, 崔进, 郜海阳, 屈欧阳, 段晓东, 李存霞, 刘丽娜 2017 66 130601
 Google Scholar
Tang Y H, Cui J, Gao H Y, Qu O Y, Duan X D, Li C X, Liu L N 2017 Acta Phys. Sin. 66 130601
 Google Scholar
[6] 冯玉涛, 李娟, 赵增亮, 原晓斌, 余涛, 武魁军, 郝雄波, 傅頔, 孙剑, 王爽 2017 上海航天 34 14
Feng Y T, Li J, Zhao Z L, Yuan X B, Yu T, Fu J G, Wu K J, Hao X B, Fu D, Sun J, Wang S 2017 Aerospace Shanghai 34 14
[7] Englert C R, Harlander J M, Babcock D D, Stevens M H, Siskind D E 2006 Atmospheric Optical Modeling, Measurement, and Simulation II San Diego, California, USA, September 1, 2006 p6303
[8] Englert C R, Babcock D D, Harlander J M 2007 Appl. Opt. 46 7297
 Google Scholar
[9] Marr K D, Thayer A S, Englert C R, Harlander J M 2020 Opt. Eng. 59 013102
[10] Zhang Y F, Feng Y T, Fu D, Wang P C, Sun J, Bai Q L 2020 Chin. Phys. B 29 104204
 Google Scholar
[11] Kuang Y L, Fang L, Peng X, Cheng X, Zhang H, Liu E H 2018 Acta Phys. Sin. 67 140703
 Google Scholar
[12] Engler C R, Harlander J M, Brown C M, Marr K D, Miller I J, Stump J E, Hancock J, Peterson J Q, Kumler J, Morrow W H, Mooney T A, Ellis S, Mende S B, Harris S E, Stevens M H, Makela J J, Harding B J, Immel T J 2017 Space Sci. Rev. 212 1
 Google Scholar
[13] 白玉龙, 孙剑, 郝雄波, 武俊强, 白清兰, 冯玉涛 2018 光子学报 47 0922002
 Google Scholar
Bai Y L, Sun J, Hao X B, Wu J Q, Bai Q L, Feng Y T 2018 Acta Photon. Sin. 47 0922002
 Google Scholar
[14] 孙剑, 冯玉涛, 白清兰, 王咏梅, 汶徳胜 2013 光学精密工程 21 1167
 Google Scholar
Sun J, Feng Y T, Bai Q L, Wang Y M, Wen D S 2013 Opt. Precision Eng. 21 1167
 Google Scholar
[15] Liu J, Wei D, Zhu Y, Kaufmann M, Olschewski F, Mantel K, Xu J, Riese M 2018 Appl. Opt. 57 8829
 Google Scholar
[16] Sun C, Feng Y T, Fu D, Zhang Y F, Li J, Liu X B 2020 Acta Phys. Sin. 69 014202
 Google Scholar
[17] Harlander J M, Engler C R, Marr K D, Harding B J, Chu K T 2019 Appl. Opt. 58 3613
 Google Scholar
[18] 夏阳阳 2015 硕士学位论文 (上海: 上海师范大学)
Xia Y Y 2015 M. S. Thesis (Shanghai: Shanghai Normal University) (in Chinese)
[19] 杨凯华 2017 硕士学位论文 (杭州: 浙江工业大学)
Yang K H 2017 M. S. Thesis (Hangzhou: Zhejiang University of Technology) (in Chinese)
[20] 张美静 2013 硕士学位论文 (沈阳: 沈阳理工大学)
Zhang M J 2013 M. S. Thesis (Shenyang: Shenyang Ligong University) (in Chinese)
[21] 张舞杰, 李迪, 叶峰 2009 华南理工大学学报(自然科学版) 37 39
Zhang W J, Li D, Ye F 2009 Journal of South China University of Technology (Natural Science Edition) 37 39
-
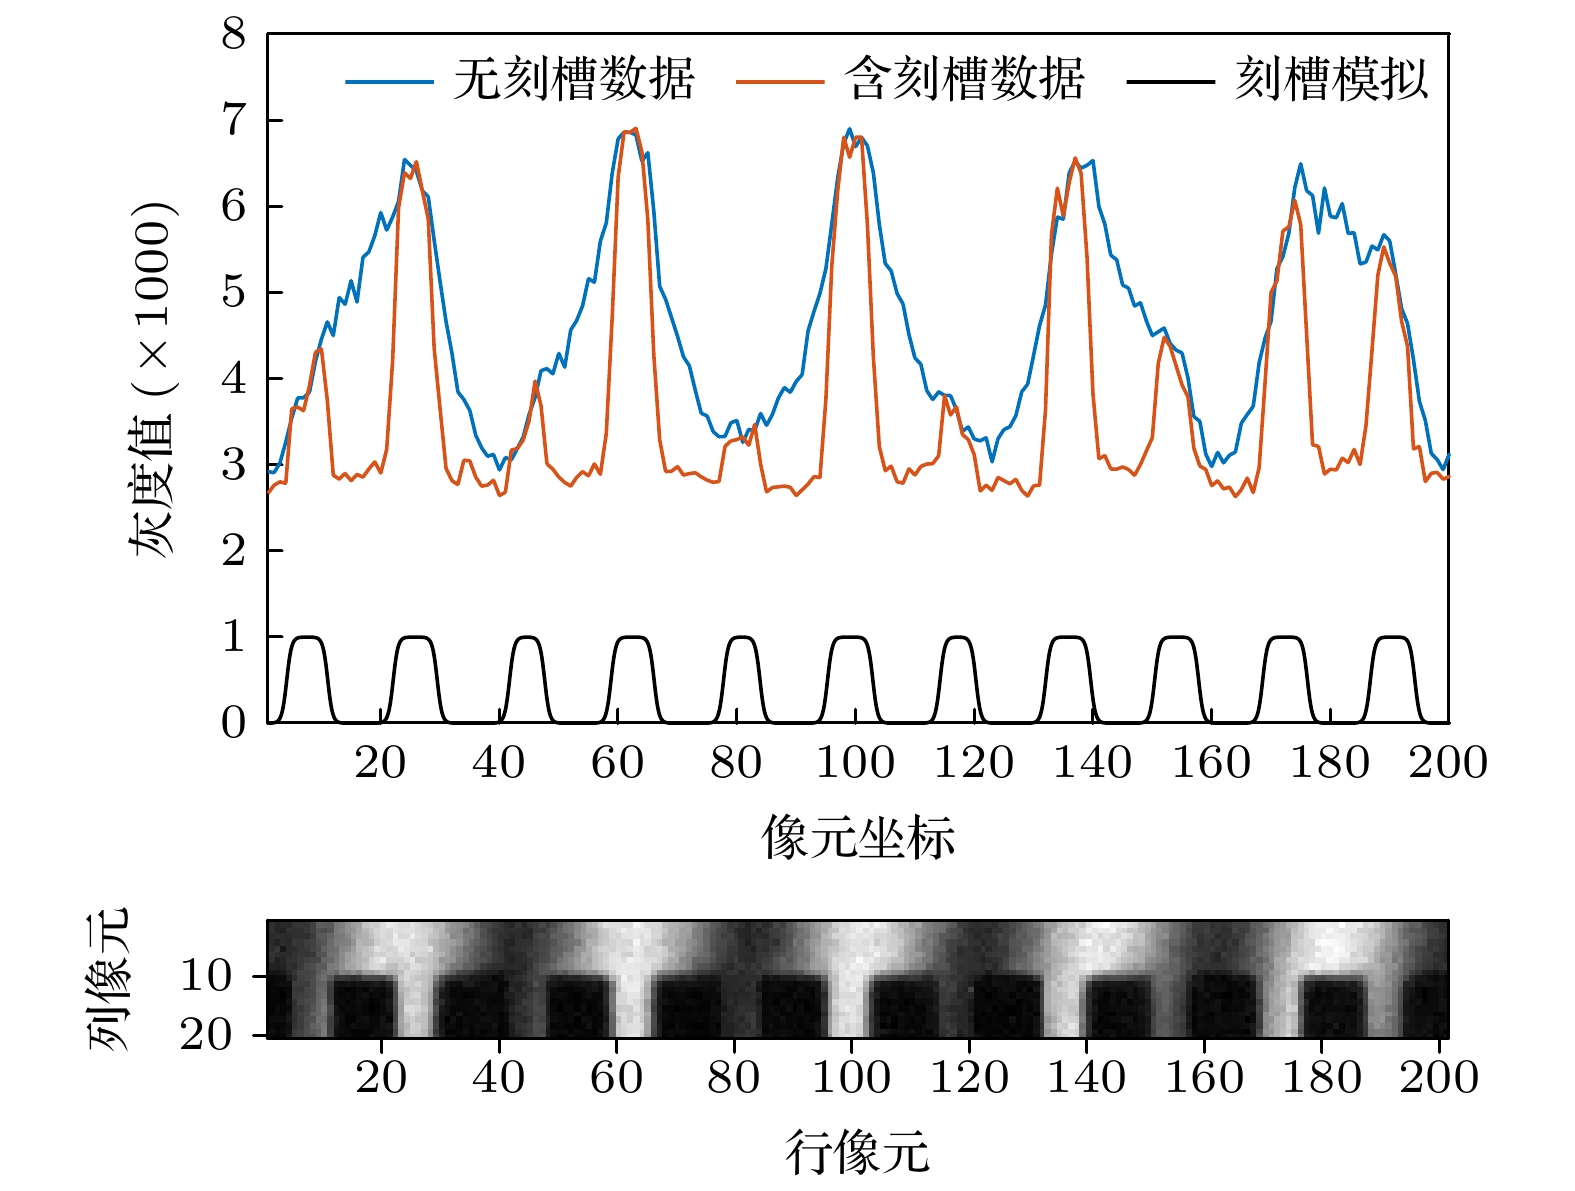
图 2 从实测干涉图像中部分截取的光栅刻槽图案(下); 在刻槽顶端选取的邻近两行数据, 其中一行含刻槽, 另一行为正常的干涉条纹(上)
Fig. 2. Notch pattern partly intercepted from laboratory measured interferogram (the below part); the neighboring two lines of data selected at the top of notch pattern, one is the notch row, and the other is the normal interference fringe (the upper part).
图 4 对热稳定测试数据进行像面漂移监测的结果示意. 刻槽漂移中, 黑色曲线代表原始检测结果, 红色曲线代表平滑得到的趋势线; 相位漂移中, 黑色曲线代表原始的相位漂移, 红色曲线代表校正后的相位漂移
Fig. 4. Schematic diagram of image plane drift monitoring results of thermal stability test data. In the graph of notch drift, the black curve represents the original result, and the red curve represents the smoothed trend line. In the graph of phase drift, the black curve represents the original result, and the red curve represents the corrected phase.
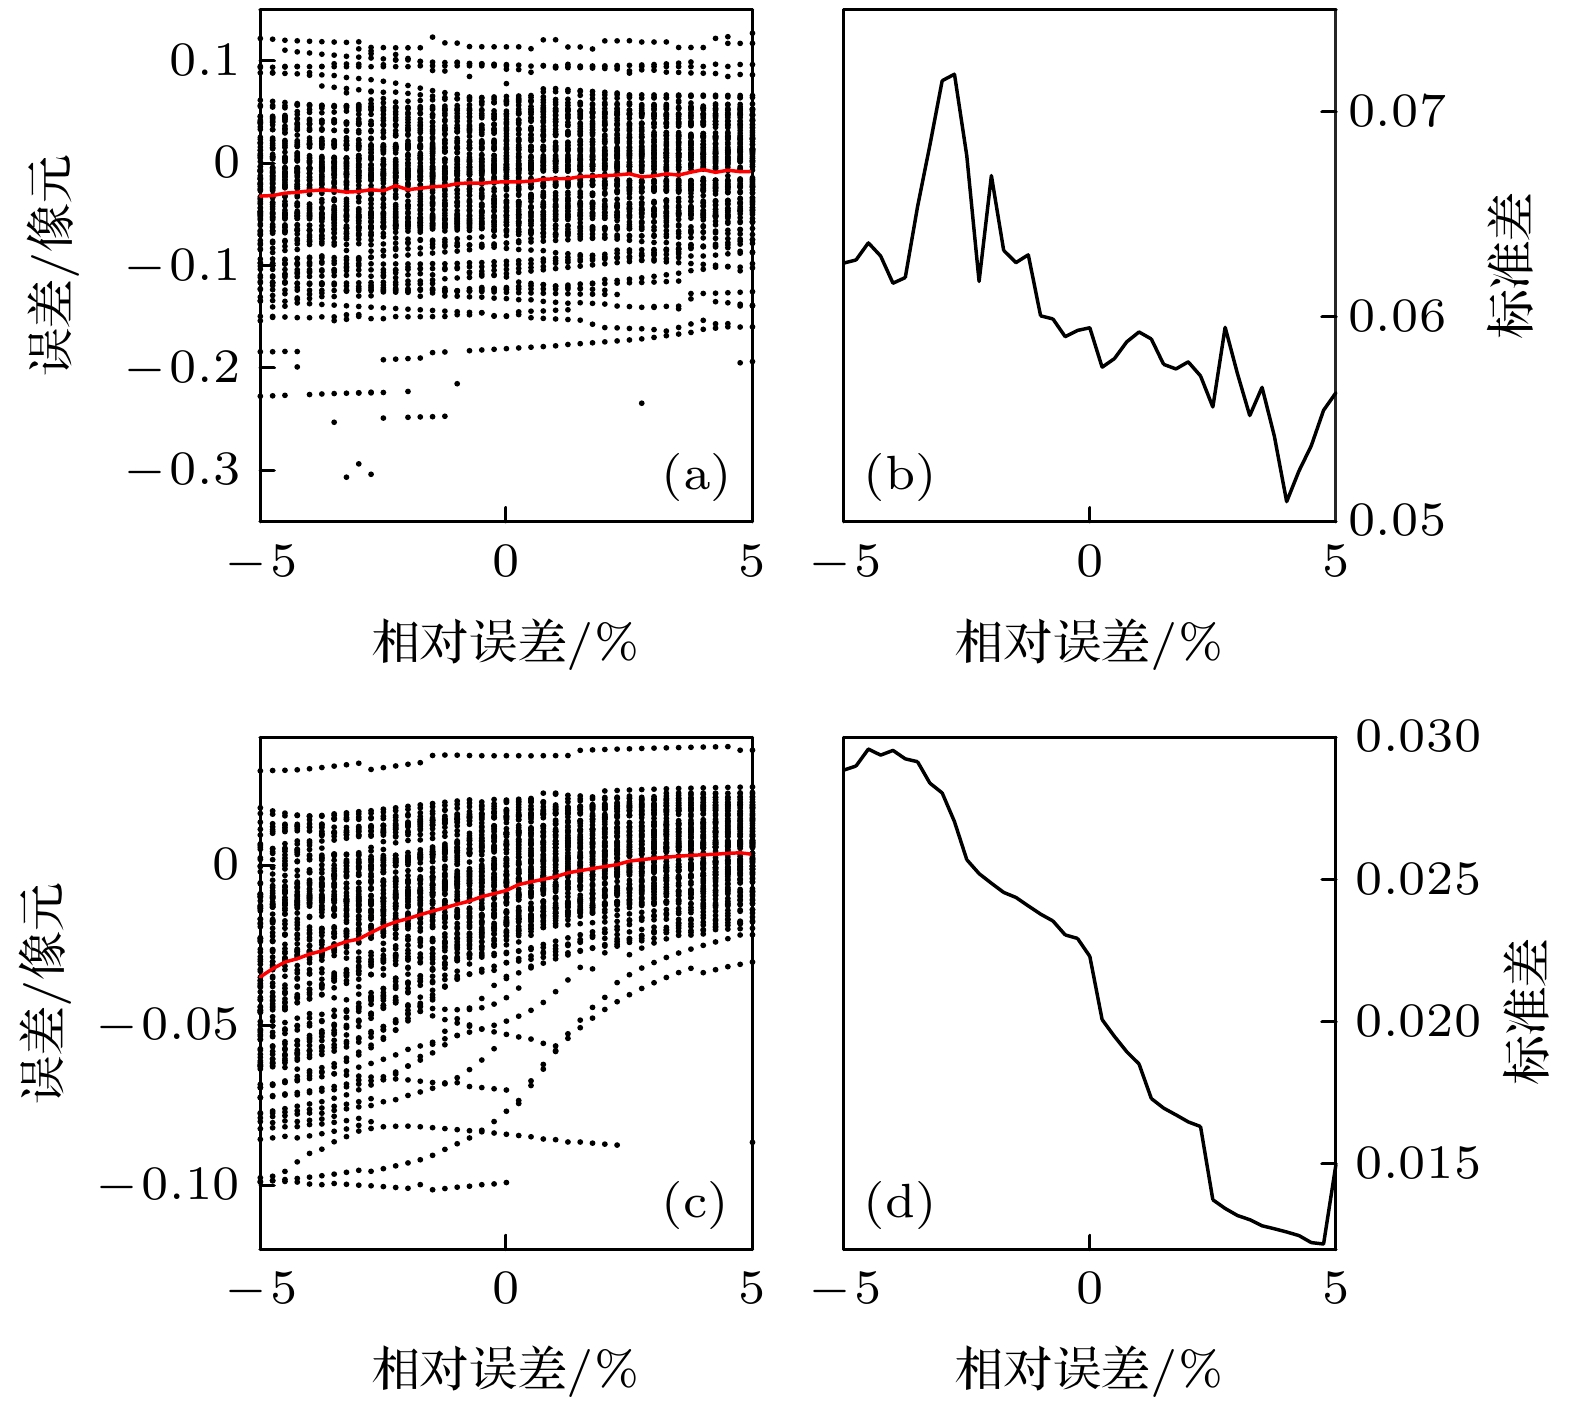
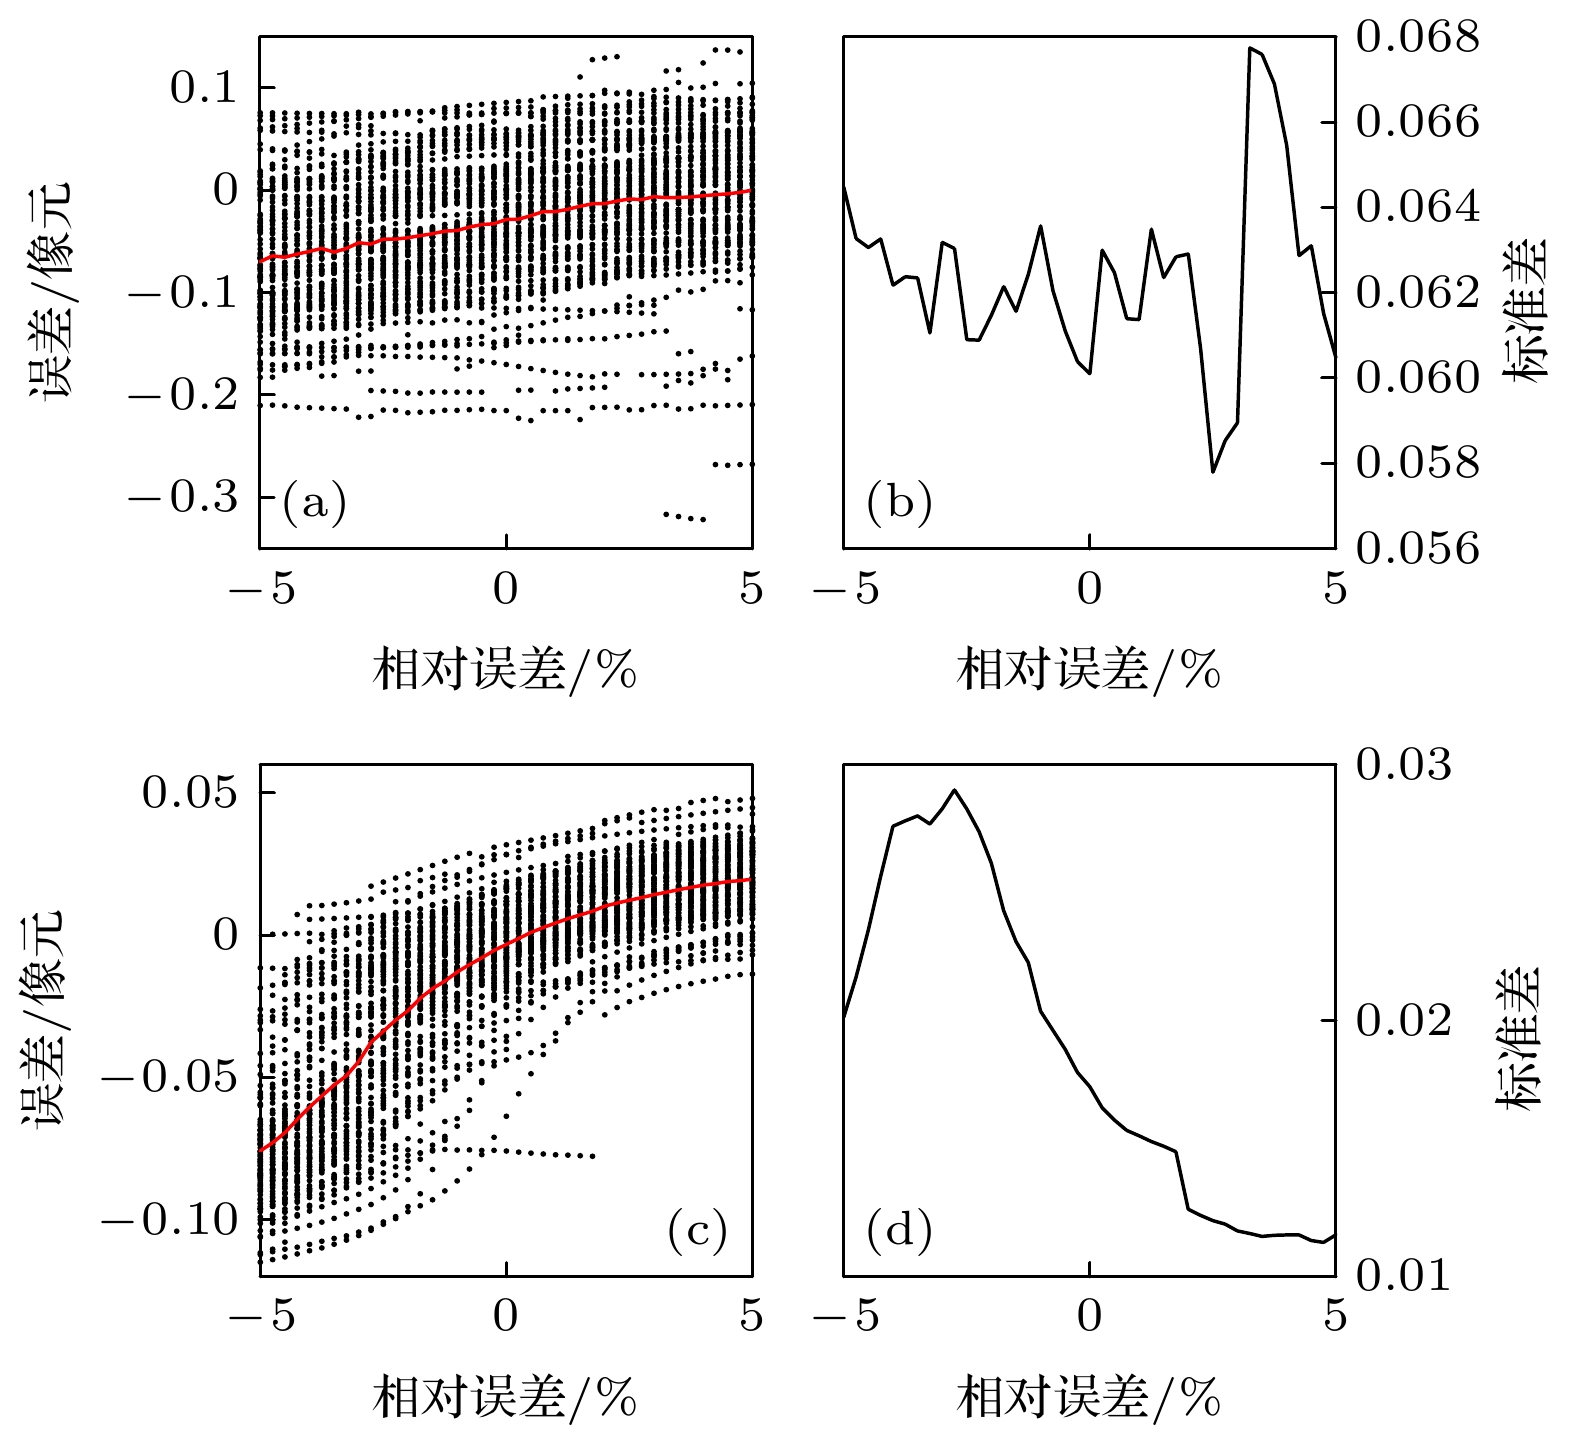
图 6 干涉条纹频率的相对误差对刻槽边缘检测误差的影响示意图. 黑点代表一次仿真的误差, 红色曲线代表100次仿真的平均误差(图7—图11同) (a), (b) SNR = 25; (c), (d) SNR = 100
Fig. 6. Schematic diagram of the influence of the relative error of the interference fringe frequency on the notch edge detection error. The black points represent the error of single simulation, and the red curve represents the average error of 100 simulations (This is the same as those in Fig. 7-Fig. 11): (a), (b) SNR = 25; (c), (d) SNR = 100
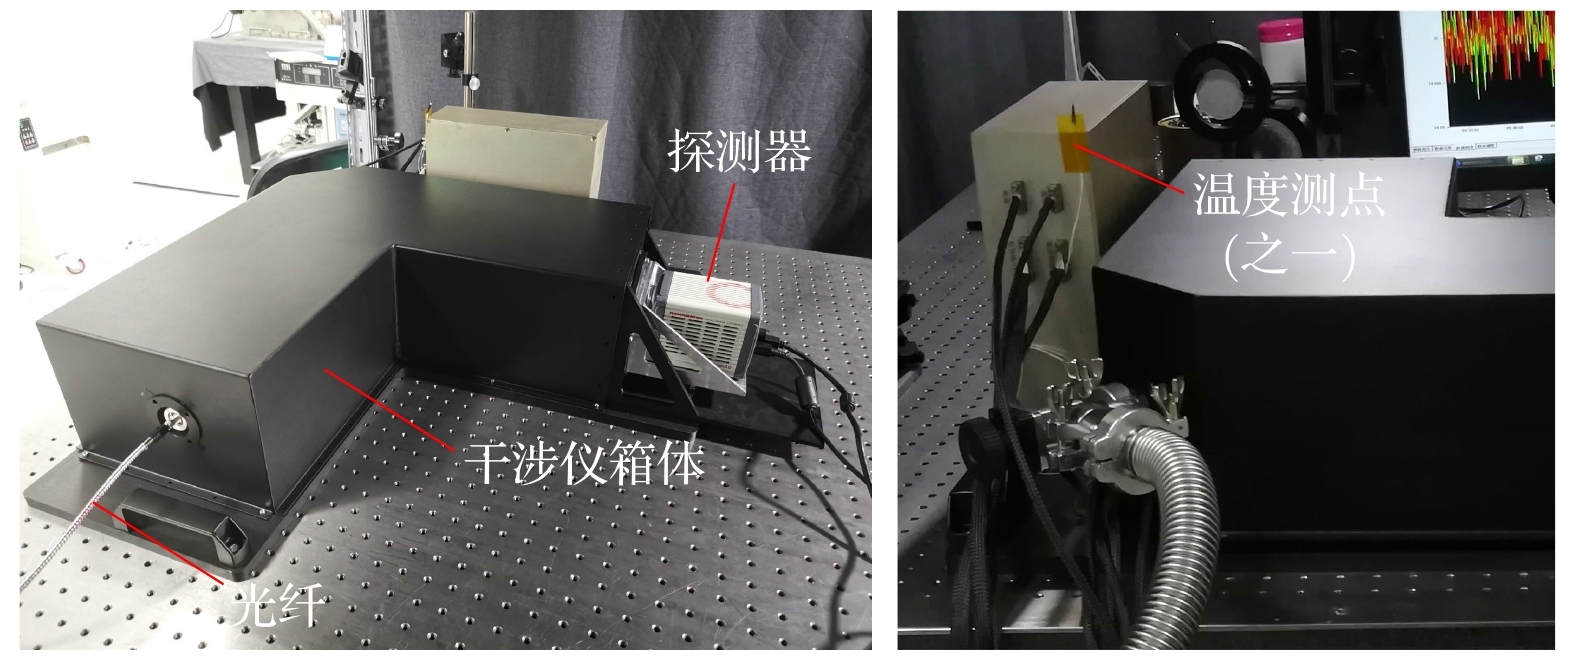
表 1 近红外实验样机工作参数
Table 1. Working parameters of near infrared experimental prototype.
干涉仪 工作波长/nm 867.17 温控精度/℃ ±0.2 光程差/mm 49.87 探测器 像元数 2048×2048 像元尺寸/μm 6.5 温度传感器 测温精度/℃ 0.1 -
[1] 叶剑勇, 张淳民, 赵葆常, 李英才 2008 57 0067
 Google Scholar
Ye J Y, Zhang C M, Zhao B C, Li Y C 2008 Acta Phys. Sin. 57 0067
 Google Scholar
[2] 阮锴, 张淳民, 赵葆常 2008 57 5435
 Google Scholar
Ruan K, Zhang C M, Zhao B C 2008 Acta Phys. Sin. 57 5435
 Google Scholar
[3] 朱化春, 张淳民, 简小华 2010 59 0893
 Google Scholar
Zhu H C, Zhang C M, Jian X H 2010 Acta Phys. Sin. 59 0893
 Google Scholar
[4] 张淳民, 朱兰艳 2010 59 0989
 Google Scholar
Zhang C M, Zhu L Y 2010 Acta Phys. Sin. 59 0989
 Google Scholar
[5] 唐远河, 崔进, 郜海阳, 屈欧阳, 段晓东, 李存霞, 刘丽娜 2017 66 130601
 Google Scholar
Tang Y H, Cui J, Gao H Y, Qu O Y, Duan X D, Li C X, Liu L N 2017 Acta Phys. Sin. 66 130601
 Google Scholar
[6] 冯玉涛, 李娟, 赵增亮, 原晓斌, 余涛, 武魁军, 郝雄波, 傅頔, 孙剑, 王爽 2017 上海航天 34 14
Feng Y T, Li J, Zhao Z L, Yuan X B, Yu T, Fu J G, Wu K J, Hao X B, Fu D, Sun J, Wang S 2017 Aerospace Shanghai 34 14
[7] Englert C R, Harlander J M, Babcock D D, Stevens M H, Siskind D E 2006 Atmospheric Optical Modeling, Measurement, and Simulation II San Diego, California, USA, September 1, 2006 p6303
[8] Englert C R, Babcock D D, Harlander J M 2007 Appl. Opt. 46 7297
 Google Scholar
[9] Marr K D, Thayer A S, Englert C R, Harlander J M 2020 Opt. Eng. 59 013102
[10] Zhang Y F, Feng Y T, Fu D, Wang P C, Sun J, Bai Q L 2020 Chin. Phys. B 29 104204
 Google Scholar
[11] Kuang Y L, Fang L, Peng X, Cheng X, Zhang H, Liu E H 2018 Acta Phys. Sin. 67 140703
 Google Scholar
[12] Engler C R, Harlander J M, Brown C M, Marr K D, Miller I J, Stump J E, Hancock J, Peterson J Q, Kumler J, Morrow W H, Mooney T A, Ellis S, Mende S B, Harris S E, Stevens M H, Makela J J, Harding B J, Immel T J 2017 Space Sci. Rev. 212 1
 Google Scholar
[13] 白玉龙, 孙剑, 郝雄波, 武俊强, 白清兰, 冯玉涛 2018 光子学报 47 0922002
 Google Scholar
Bai Y L, Sun J, Hao X B, Wu J Q, Bai Q L, Feng Y T 2018 Acta Photon. Sin. 47 0922002
 Google Scholar
[14] 孙剑, 冯玉涛, 白清兰, 王咏梅, 汶徳胜 2013 光学精密工程 21 1167
 Google Scholar
Sun J, Feng Y T, Bai Q L, Wang Y M, Wen D S 2013 Opt. Precision Eng. 21 1167
 Google Scholar
[15] Liu J, Wei D, Zhu Y, Kaufmann M, Olschewski F, Mantel K, Xu J, Riese M 2018 Appl. Opt. 57 8829
 Google Scholar
[16] Sun C, Feng Y T, Fu D, Zhang Y F, Li J, Liu X B 2020 Acta Phys. Sin. 69 014202
 Google Scholar
[17] Harlander J M, Engler C R, Marr K D, Harding B J, Chu K T 2019 Appl. Opt. 58 3613
 Google Scholar
[18] 夏阳阳 2015 硕士学位论文 (上海: 上海师范大学)
Xia Y Y 2015 M. S. Thesis (Shanghai: Shanghai Normal University) (in Chinese)
[19] 杨凯华 2017 硕士学位论文 (杭州: 浙江工业大学)
Yang K H 2017 M. S. Thesis (Hangzhou: Zhejiang University of Technology) (in Chinese)
[20] 张美静 2013 硕士学位论文 (沈阳: 沈阳理工大学)
Zhang M J 2013 M. S. Thesis (Shenyang: Shenyang Ligong University) (in Chinese)
[21] 张舞杰, 李迪, 叶峰 2009 华南理工大学学报(自然科学版) 37 39
Zhang W J, Li D, Ye F 2009 Journal of South China University of Technology (Natural Science Edition) 37 39
计量
- 文章访问数: 5478
- PDF下载量: 71
- 被引次数: 0


 下载:
下载:


