-
The saturated nonlocal nonlinearity of positive nematic liquid crystals (NLCs) is discussed in this paper. Based on the nonlinear coupling model satisfied by the beam propagation in a positive NLC, the saturable characteristics of the nonlinear refractive index (NRI) in the cases of
$1+1$ and$1+2$ dimensions are discussed separately, and the numerical solutions of saturated bistable solitons for different pre-declination angles are obtained. The saturated NRI is smaller for larger pre-deflection angles, and the center of the saturated NRI is almost flat for different pre-deflection angles in$1+2$ dimension. Solitons in the saturated case are no longer standard circular, whose waveforms in the x and y directions are slightly different. We also find that saturated bistable solitons can exist in NLCs for both$1+1$ and$1+2$ dimensions. With the increase of pre-deflection angle, the existing regions of bistable solitons decrease, while their minimum beamwidth increases. Although the beamwidths of bistable solitons are the same, they have different powers and propagation constants, and their normalized soliton waveforms differ in the$1+2$ dimensional case.-
Keywords:
- ematic liquid crystals /
- nonlocal properties /
- saturated nonlocal nonlinearity /
- bistable solitons
[1] Wagner W G, Haus H A, Marburger J H 1968 Phys. Rev. 175 256
 Google Scholar
[2] Snyder A W, Mitchell D J 1997 Science 276 1538
 Google Scholar
[3] Stegeman G I A, Christodoulides D N, Segev M 2000 IEEE J. Sel. Top. Quantum Electron. 6 1419
 Google Scholar
[4] 曹觉能, 郭旗 2005 54 3688
 Google Scholar
Cao J N, Guo Q 2005 Acta Phys. Sin. 54 3688
 Google Scholar
[5] Chen Z G, Segev M, Segev M, Christodoulides D N 2012 Rep. Prog. Phys. 75 086401
 Google Scholar
[6] Coutaz J L, Kull M 1991 J. Opt. Soc. Am. B 8 95
 Google Scholar
[7] Mohanraj P, Sivakumar R, Arulanandham A M S, Gunavathy K V 2022 Opt. Quant. Electron. 54 386
 Google Scholar
[8] Gatz S, Herrmann J 1991 J. Opt. Soc. Am. B 8 2296
 Google Scholar
[9] Christian J M, Lundie M J 2017 J. Nonlinear Opt. Phys. 26 1750024
 Google Scholar
[10] Sahoo A, Mahato D K, Govindarajan A, Sarma A K 2022 Phys. Rev. A 105 063503
 Google Scholar
[11] Krolikowski W, Bang O, Rasmussen J J, Wyller J 2001 Phys. Rev. E 64 016612
 Google Scholar
[12] Edmundson D E, Enns R H 1992 Opt. Lett. 17 586
 Google Scholar
[13] Edmundson D E, Enns R H 1995 Phys. Rev. A 51 2491
 Google Scholar
[14] Enns R H, Rangnekar S, Kaplan A E 1987 Phys. Rev. A 35 466
 Google Scholar
[15] Marburger J H, Dawes E L 1968 Phys. Rev. Lett. 21 556
 Google Scholar
[16] Dawes E L, Marburger J H 1969 Phys. Rev. 179 862
 Google Scholar
[17] Stegeman G I, Christodoulides D N, Segev M 2000 J. Sel. Top. Quantum Electron. 6 1419
[18] Peccianti M, De Rossi A, Assantoa G, De Luca A, Umenton C, Khoo I C 2000 Appl. Phys. Lett. 77 7
 Google Scholar
[19] Peccianti M, Brzdkiewicz K A, Assanto G 2002 Opt. Lett. 27 1460
 Google Scholar
[20] Peccianti M, Conti C, Assantoa G 2003 J. Nonlinear Opt. Phys. Mater. 12 525
 Google Scholar
[21] Peccianti M, Assanto G 2012 Phys. Rep. 516 147
 Google Scholar
[22] Kravets N, Piccardi A, Alberucci A, Buchnev O, Kaczmarek M, Assanto G 2014 Phys. Rev. Lett. 113 023901
 Google Scholar
[23] Alberucci A, Laudyn U A, Piccardi A, Kwasny M, Klus B, Karpierz M A, Assanto G 2017 Phys. Rev. E 96 012703
 Google Scholar
[24] Conti C, Peccianti M, Assanto G 2003 Phys. Rev. Lett. 91 073901
 Google Scholar
[25] Keller H B 1997 Numerical Solution of Bifurcation and Nonlinear Eigenvalue Problemsions of Bifurcation Theory (New York: Academia Press) pp359–384
[26] Yang J K, Lakoba T I 2008 Stud. Appl. Math. 120 265
 Google Scholar
[27] Press W H, Teukolsky S A, Vetterling W T, Flannery B P 2007 Numerical Recipes: The Art of Scientific Computing (3rd Ed.) (New York: Cambridge University Press) pp1087–1103
[28] Assanto G, Peccianti M 2003 IEEE J. Quantum Electron. 39 13
 Google Scholar
[29] Deuling H J 1972 Mol. Cryst. Liq. Cryst. 19 123
 Google Scholar
-
图 4 (a) 1+1维不同预偏角时液晶非线性折射率与光强图; (b) 1+2维不同预偏角时液晶非线性折射率与光强图
Fig. 4. (a) Nonlinear refractive index and light intensity map of liquid crystal with different predeclination angles in 1+1 dimension; (b) nonlinear refractive index and light intensity map of liquid crystal with different predeclination angles in 1+2 dimension
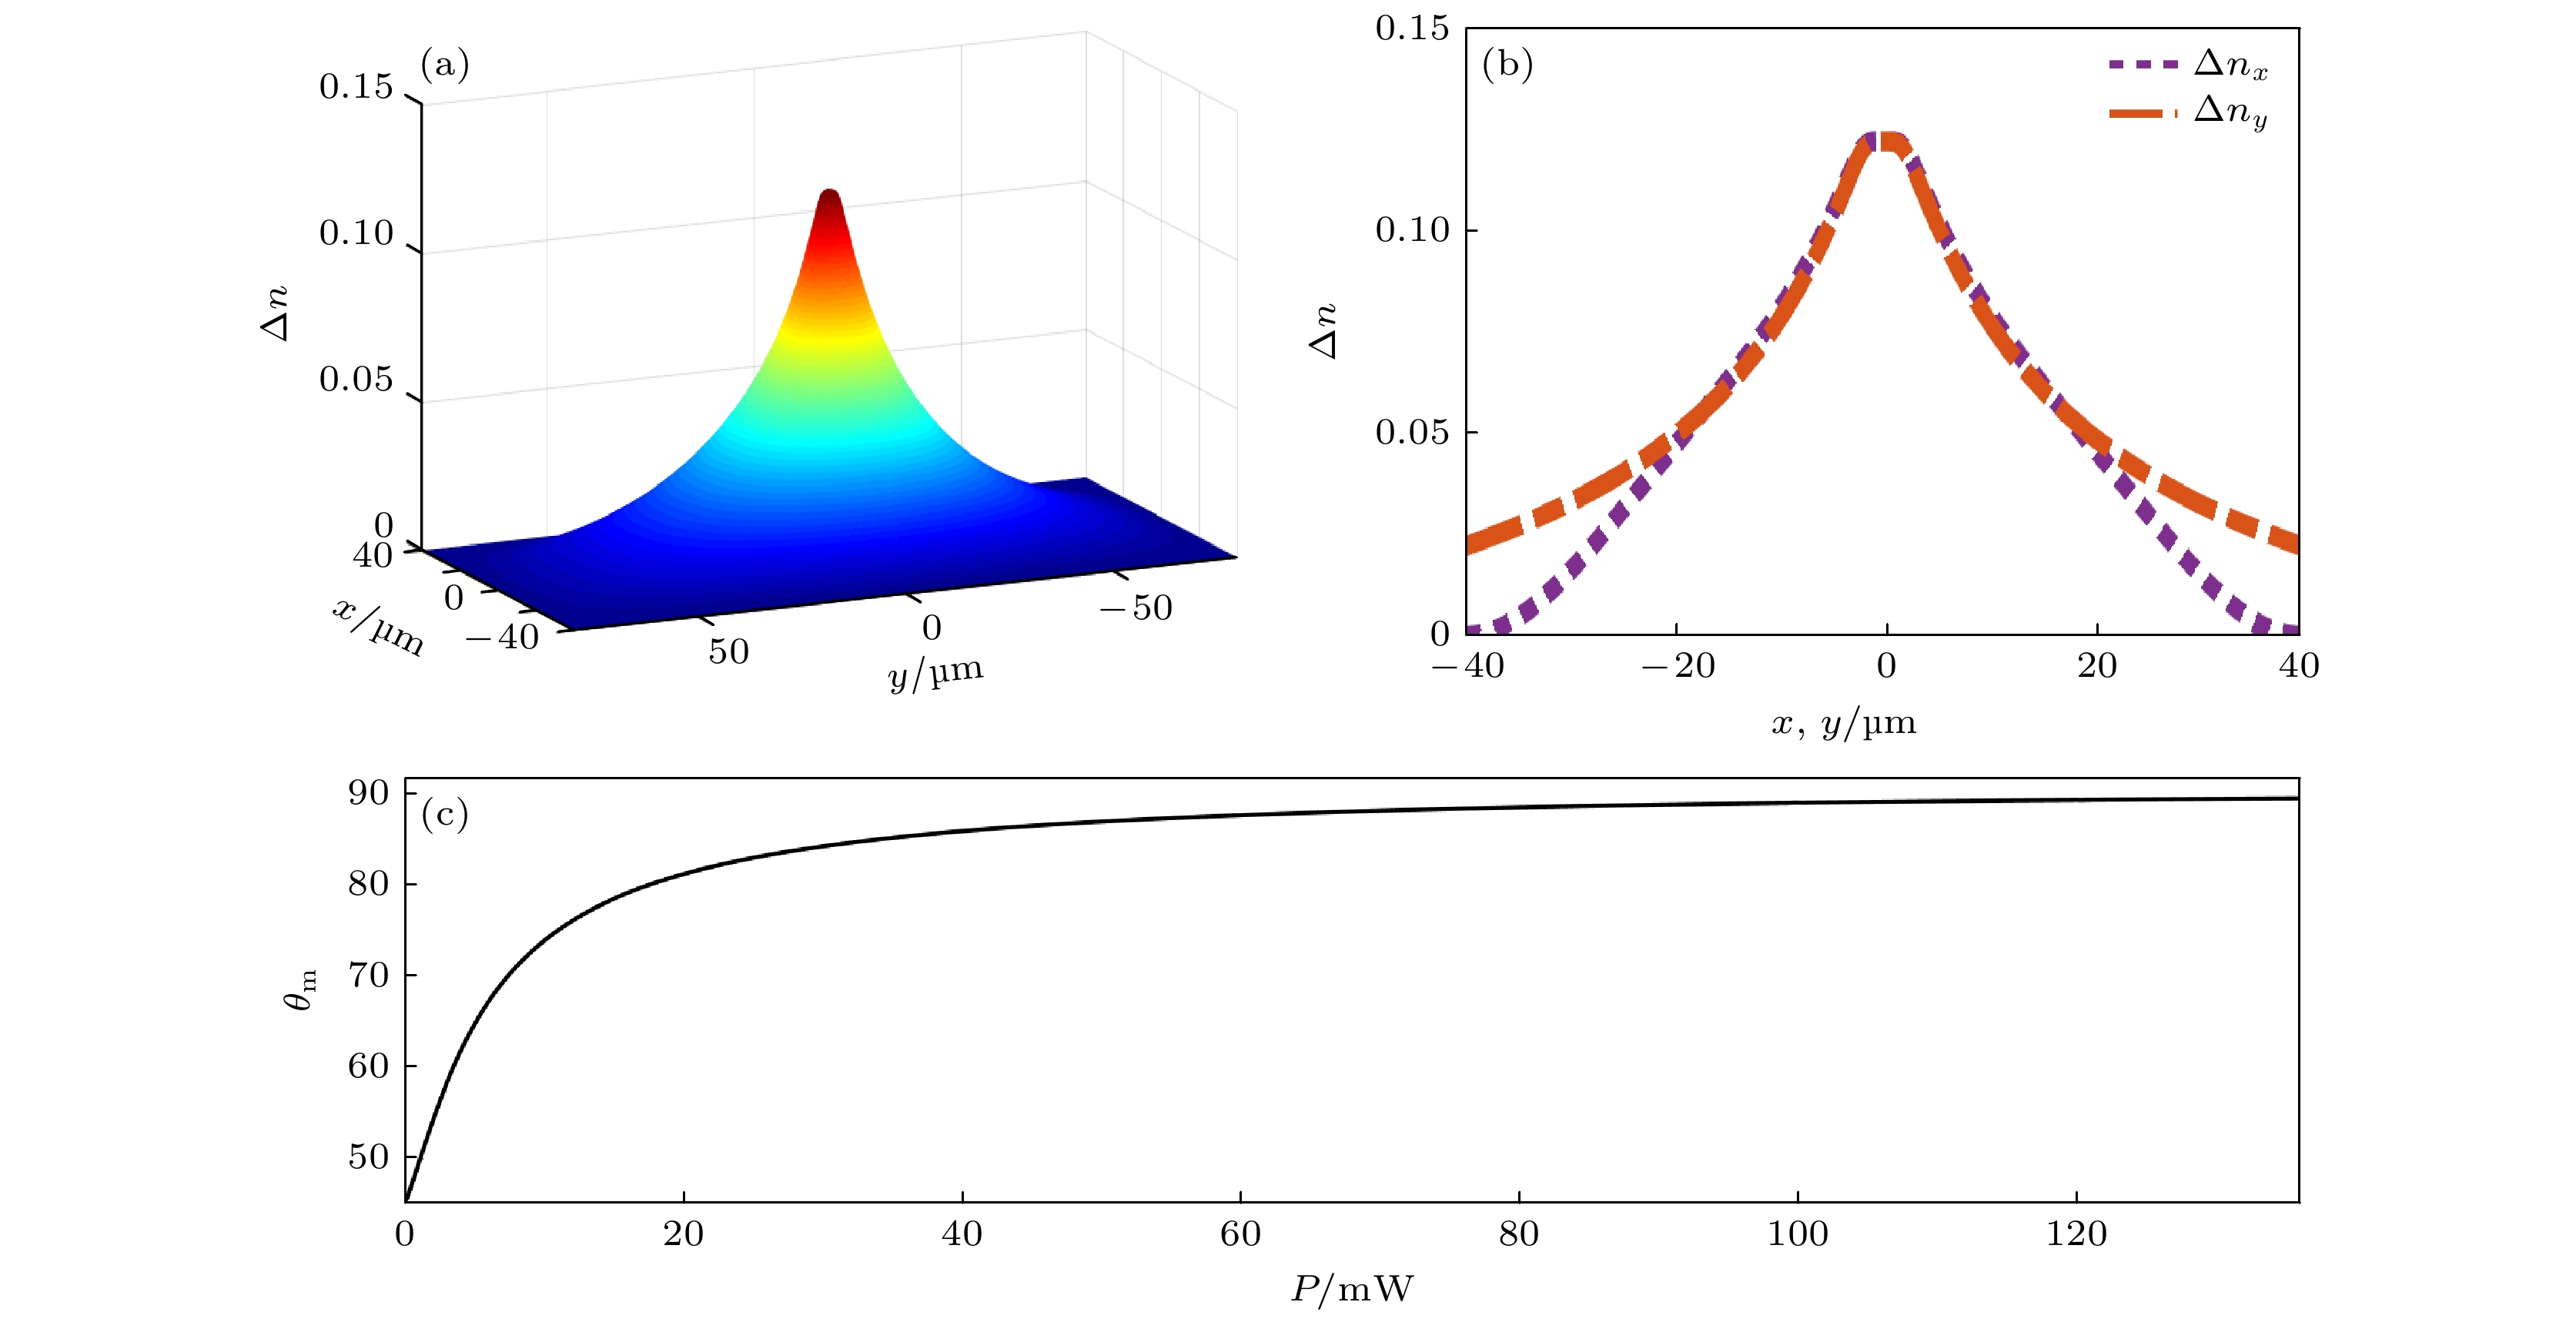
图 5 (a)
$ 1+2 $ 维非线性折射率; (b)$ 1+2 $ 维非线性折射率x方向与y方向直观对比; (c)$ 1+2 $ 维孤子功率与液晶中心分子最大偏角$ \theta_{\rm{m}} $ 的关系图Fig. 5. (a)
$ 1+2 $ dimensional nonlinear refractive index; (b)$ 1+2 $ dimensional nonlinear refractive index x direction and y direction intuitive comparison; (c) relationship between$ 1+2 $ dimensional soliton power and the maximum declination angle of liquid crystal central molecule$ \theta_{\rm{m}} $ 图 6
$ 1+1 $ 维情况下 (a)$ \theta_{0}=20^{\circ} $ 时孤子功率与束宽关系图, (b)$ \theta_{0}=30^{\circ} $ 时孤子功率与束宽关系图, (c)$ \theta_{0}=45^{\circ} $ 时孤子功率与束宽关系图, (d)$ \theta_{0}=60^{\circ} $ 时孤子功率与束宽关系图, (e)$ \theta_{0}=45^{\circ} $ 时孤子功率与传播常数 β 关系图Fig. 6. In
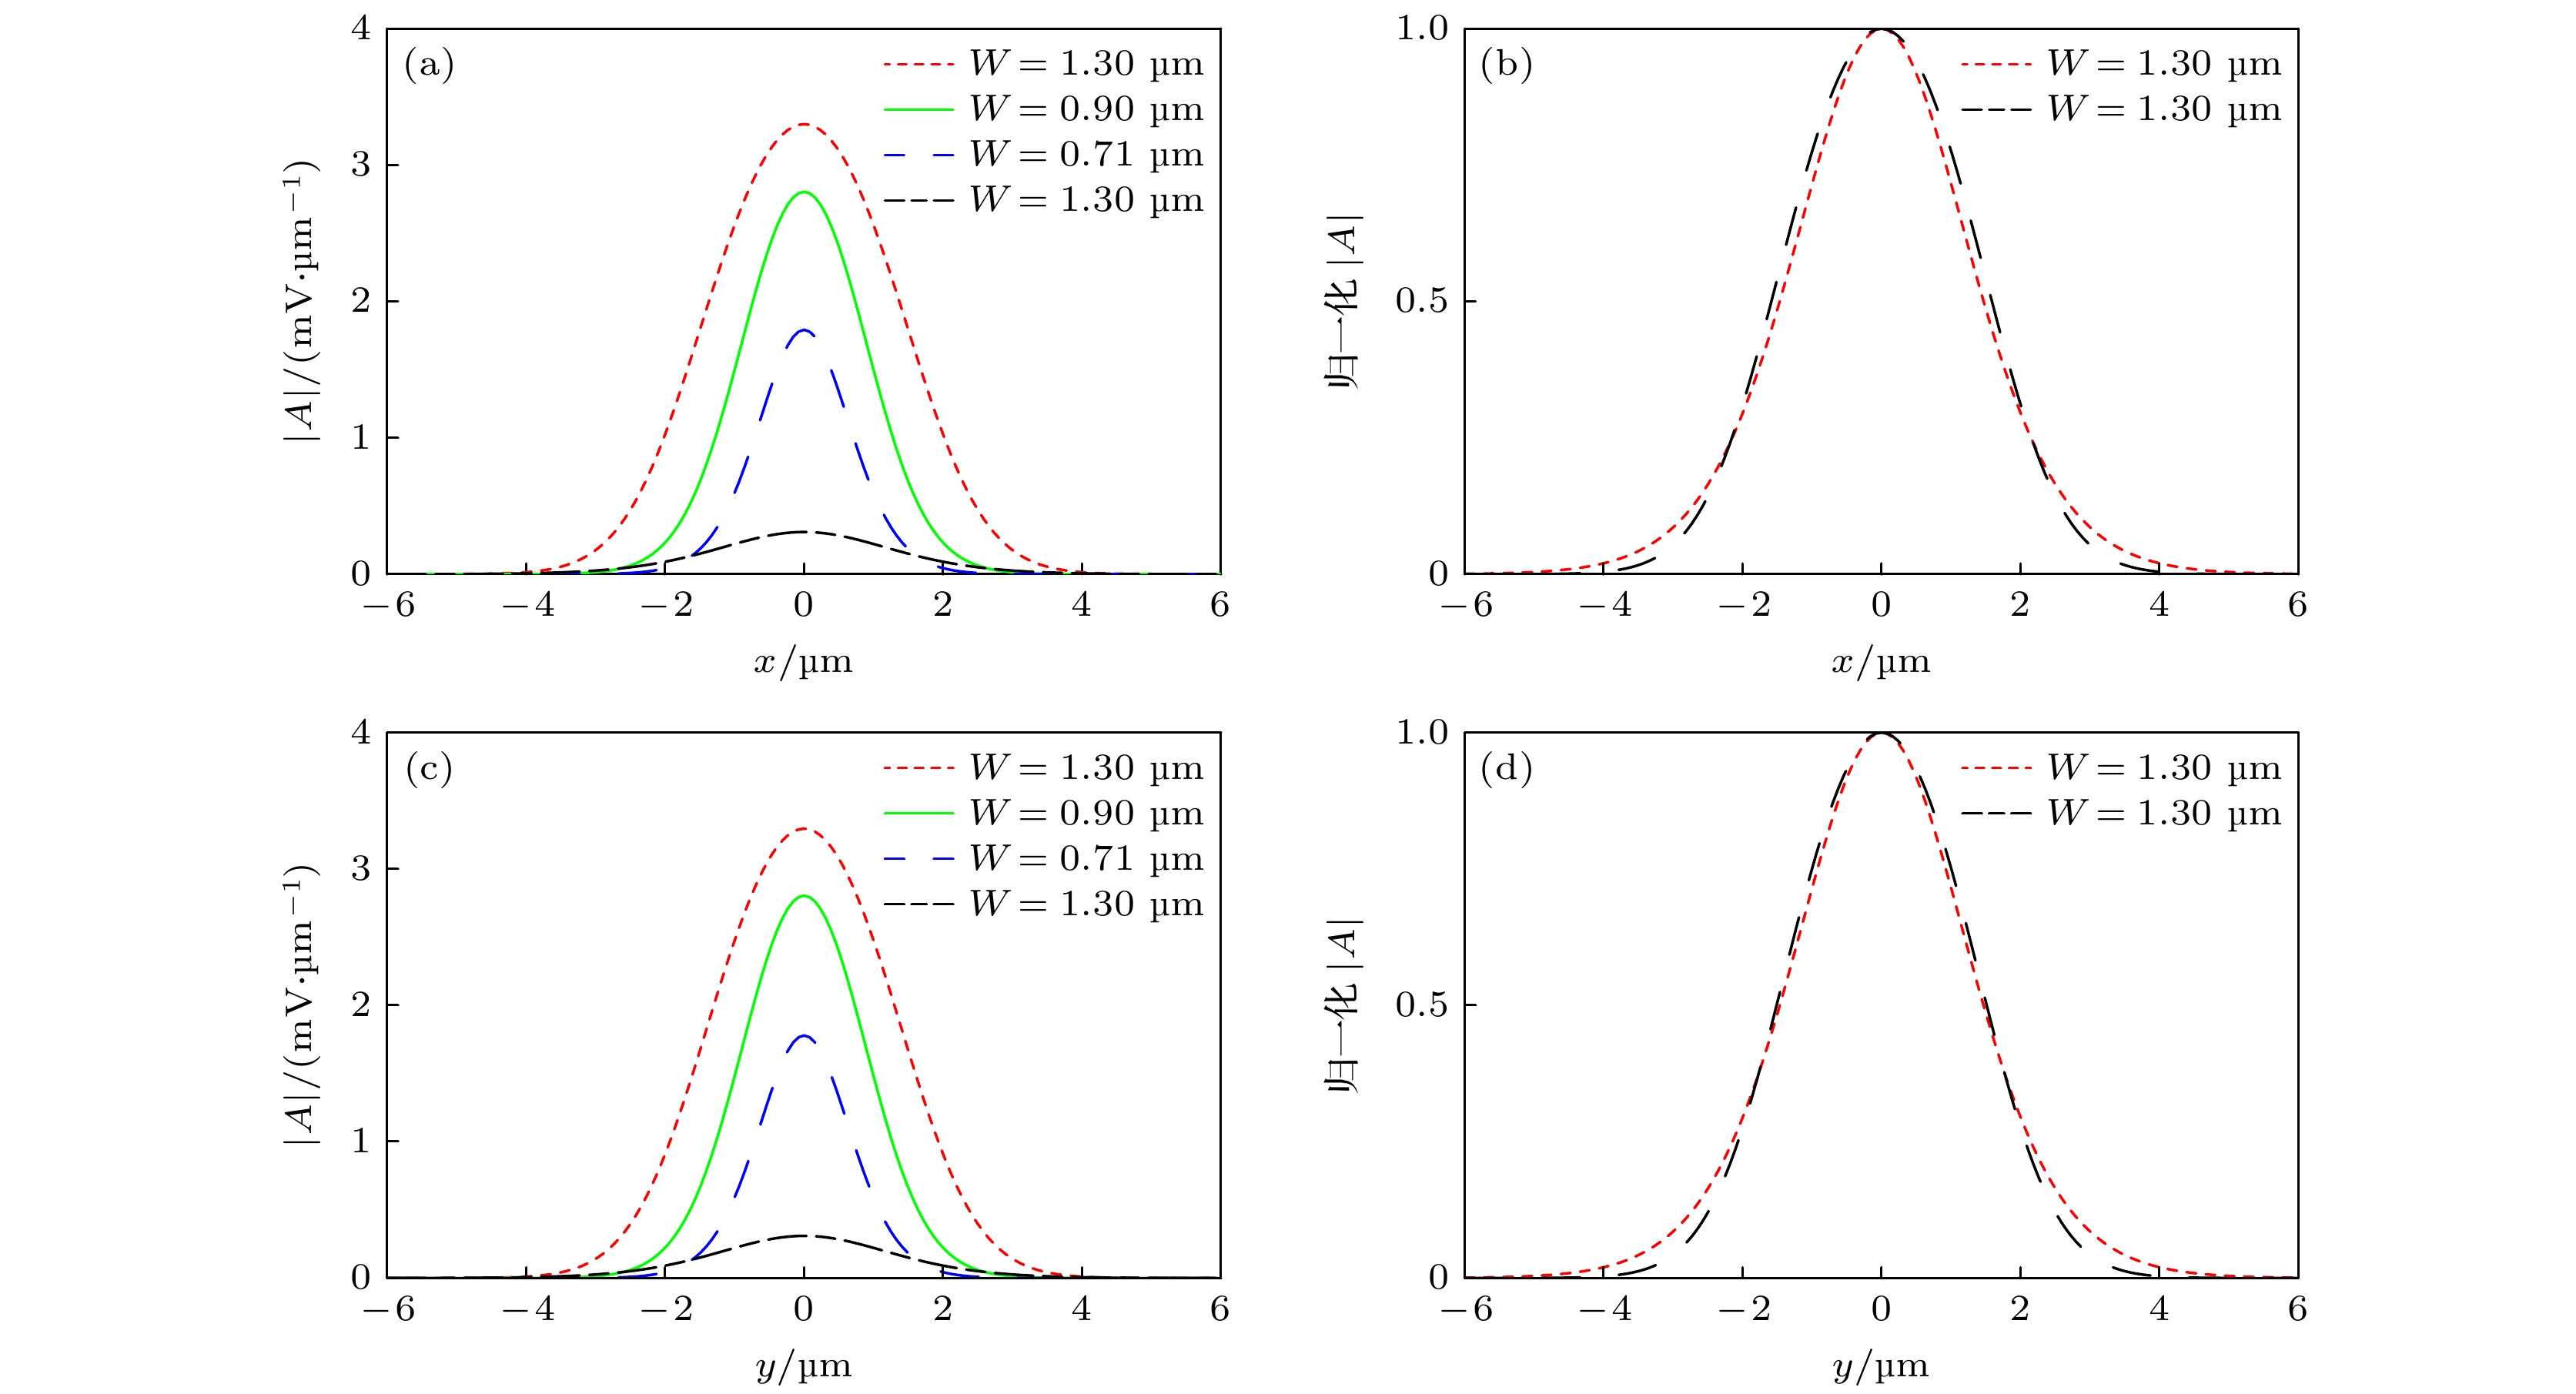
$ 1+1 $ dimension situation (a) soliton power and beam width when$ \theta_{0}=20^{\circ} $ , (b) soliton power and beam width when$ \theta_{0}=30^{\circ} $ , (c) soliton power and beam width when$ \theta_{0}=45^{\circ} $ , (d) soliton power and beam width when$ \theta_{0}=60^{\circ} $ , (e) soliton power and propagation constant when$ \theta_{0}=45^{\circ} $ 图 7 (a)
$ 1+2 $ 维x方向不同振幅孤子波形; (b)$ 1+2 $ 维x方向相同束宽归一化孤子波形; (c)$ 1+2 $ 维y方向不同振幅孤子波形; (d)$ 1+2 $ 维y方向相同束宽归一化孤子波形Fig. 7. (a) Soliton waveforms with different amplitudes in the
$ 1+2 $ dimensional x direction; (b) soliton waveforms normalized with the same beam width in the$ 1+2 $ dimensional x direction; (c) soliton waveforms with different amplitudes in the$ 1+2 $ dimensional y direction; (d) soliton waveforms normalized with the same beam width in the$ 1+2 $ dimensional y direction图 8 当
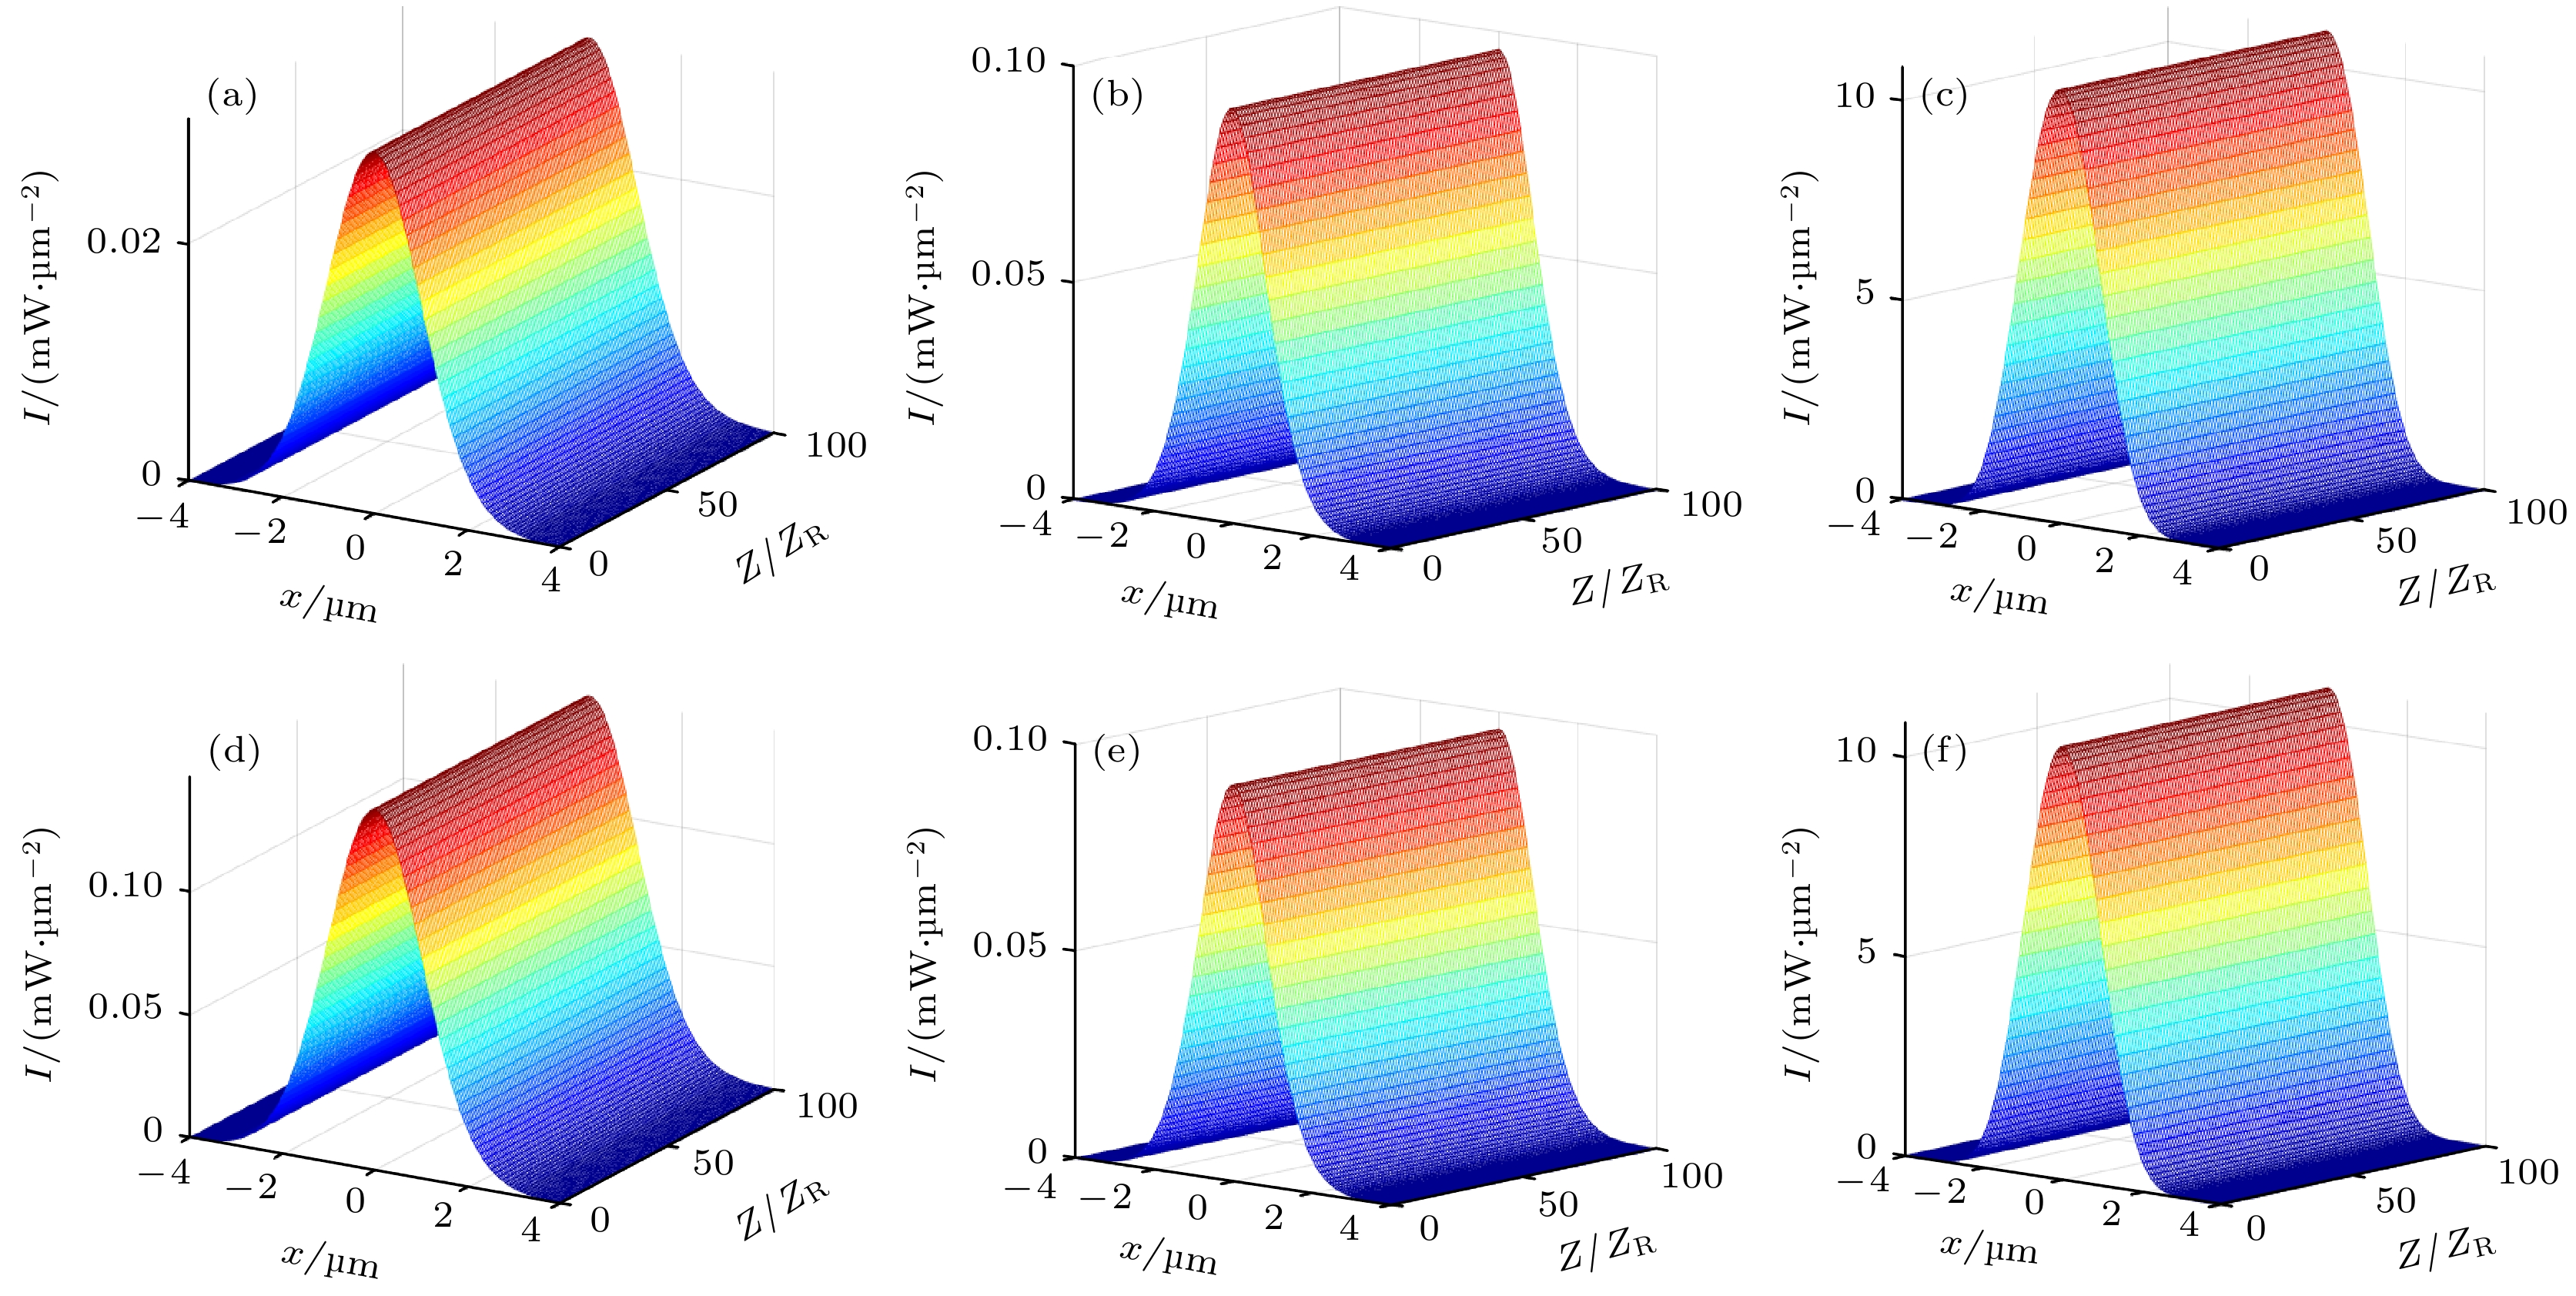
$P=1.05\; \text{mW}$ ,$W=1.30\;\text{μm}$ 时(a)$ \Delta n $ 分布; (b)$ \Delta n_x $ 和$ \Delta n_y $ 对比; (c)$ |A|_x $ 和$ |A|_y $ 对比. 当$P=113.87\; \text{mW}$ ,$W=1.30\;\text{μm}$ 时 (d)$ \Delta n $ 分布; (e)$ \Delta n_x $ 和$ \Delta n_y $ 对比; (f)$ |A|_x $ 和$ |A|_y $ 对比Fig. 8. When
$P=1.05\; \text{mW}$ ,$W=1.30\;\text{μm}$ (a)$ \Delta n $ distribution; (b) compare with$ \Delta n_x $ and$ \Delta n_y $ ; (c) compare with$ |A|_x $ and$ |A|_y $ . When$P=113.87\; \text{mW}$ ,$W=1.30\;\text{μm}$ (d)$ \Delta n $ distribution; (e) compare with$ \Delta n_x $ and$ \Delta n_y $ ; (f) compare with$ |A|_x $ and$ |A|_y $ 图 9
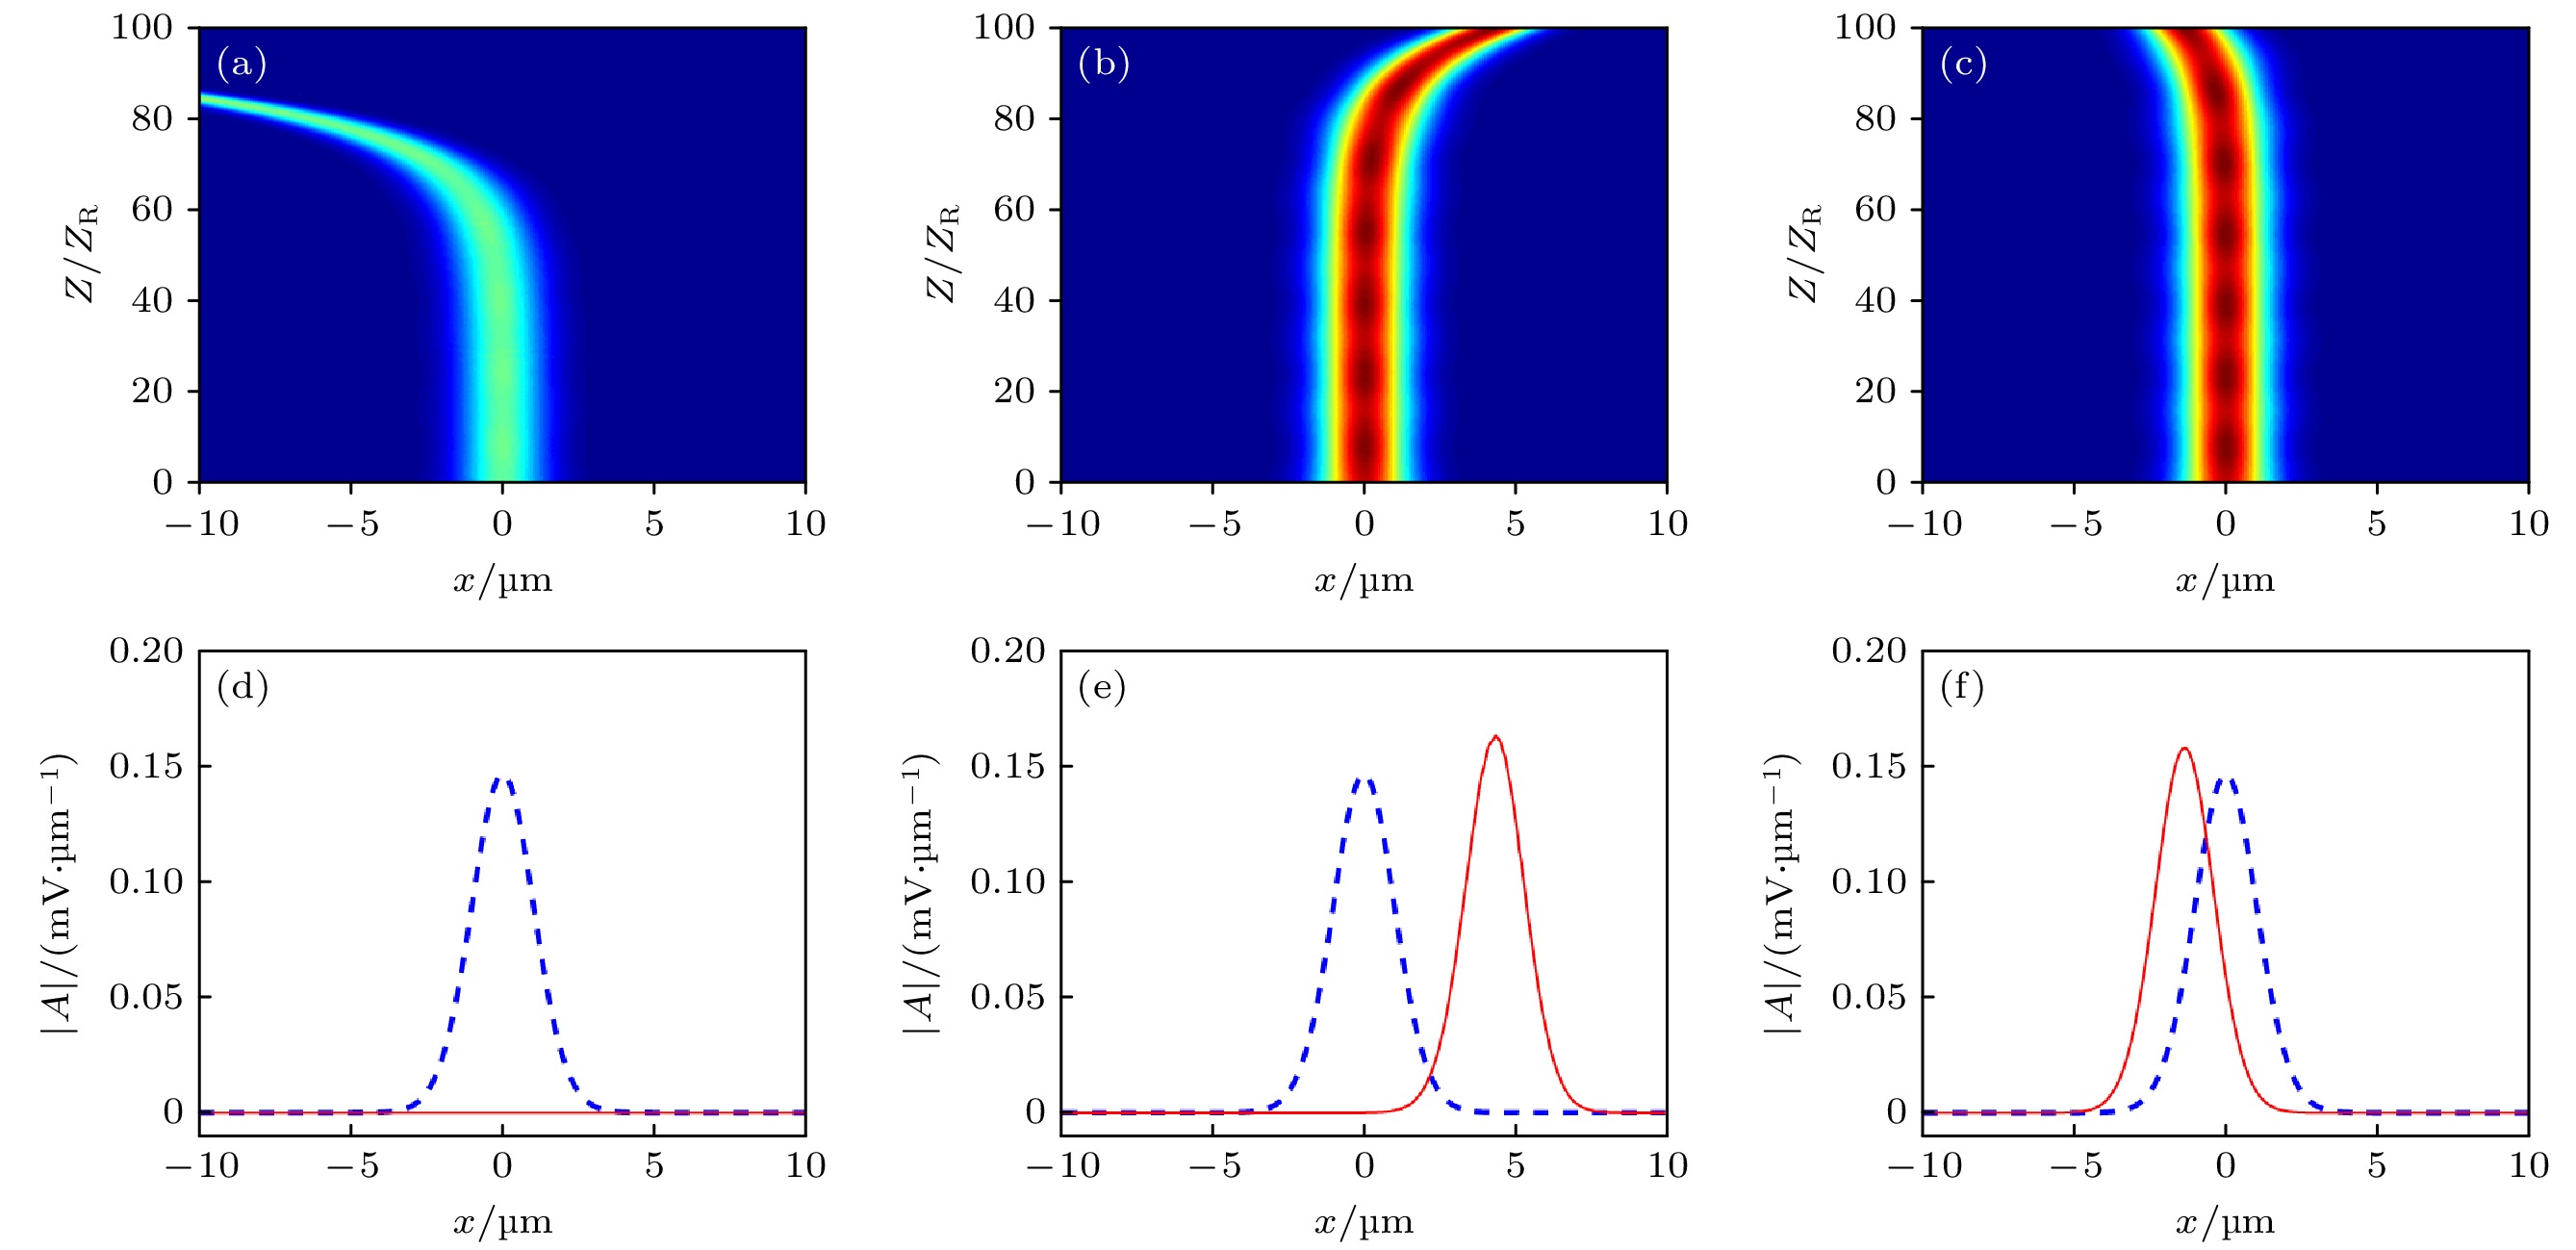
$ 1+1 $ 维情况下孤子传输图 (a)$P=0.17\; \text{mW}$ ,$W=1.50\; \text{μm}$ 时的传输图; (d)$P=0.83\; \text{mW}$ ,$W=1.50\; \text{μm}$ 时的传输图.$ 1+2 $ 维$P=1.05\; \text{mW}$ ,$W=1.30\; \text{μm}$ 时的孤子传输图 (b) x方向传输图; (e) y方向传输图.$ 1+2 $ 维$P=113.87\; \text{mW}, ~ W=l1.30\; \text{μm}$ 时的孤子传输图 (c) x方向传输图; (f) y方向传输图Fig. 9. Soliton transmission diagram in
$ 1+1 $ dimension (a)$P=0.17\; \text{mW}$ ,$W=1.50\; \text{μm}$ and (d)$P=0.83\; \text{mW}$ ,$W=1.50\; \text{μm}$ transmission diagram. Soliton transmission diagram in$ 1+2 $ dimensions$P=1.05\; \text{mW}$ ,$W=1.30\; \text{μm}$ (b) x direction transmission diagram; (e) y direction transmission diagram. Soliton transmission diagram with$ 1+2 $ dimensions$P=113.87\; \text{mW}$ ,$W=1.30\; \text{μm}$ (c) x direction transmission diagram; (f) y direction transmission diagram图 10
$ 1+1 $ 维$P=0.17\; \text{mW}$ ,$W=1.50\; \text{μm}$ 情况下加噪声孤子传输图 (a)$ 10{\text{%}} $ 噪声传输图; (d)$ 10{\text{%}} $ 噪声传输前(蓝色虚线)后(红色实线) 波形对比图; (b)$ 5{\text{%}} $ 噪声传输图; (e)$ 5{\text{%}} $ 噪声传输前后波形对比图; (c)$ 1{\text{%}} $ 噪声传输图; (f)$ 1{\text{%}} $ 噪声传输前后波形对比图Fig. 10.
$ 1 + 1 $ dimension$P=0.17\; \text{mW}, W=1.50\; \text{μm}$ cases and soliton transmission noise figure: (a) plus$ 10{\text{%}} $ figure noise transmission; (d) plus$ 10{\text{%}} $ before(blue curve) and after (red curve) noise transmission waveform comparison chart; (b) plus$ 5{\text{%}} $ figure noise transmission; (e) plus$ 5{\text{%}} $ before and after noise transmission waveform comparison chart; (c) plus$ 1{\text{%}} $ figure noise transmission; (f) plus$ 1{\text{%}} $ before and after noise transmission waveform comparison chart图 11
$ 1+1 $ 维$P=0.83\; \text{mW}$ ,$W=1.50\; \text{μm}$ 情况下加噪声孤子传输图 (a)$ 10{\text{%}} $ 噪声传输图; (d)$ 10{\text{%}} $ 噪声传输前后波形对比图; (b)$ 5{\text{%}} $ 噪声传输图; (e)$ 5{\text{%}} $ 噪声传输前后波形对比图; (c)$ 1{\text{%}} $ 噪声传输图; (f)$ 1{\text{%}} $ 噪声传输前后波形对比图Fig. 11.
$ 1 + 1 $ dimension$P=0.83\; \text{mW}$ ,$W=1.50\; \text{μm}$ cases and soliton transmission noise figure: (a) plus$ 10{\text{%}} $ figure noise transmission; (d) plus$ 11{\text{%}} $ before and after noise transmission waveform comparison chart; (b) plus$ 5{\text{%}} $ figure noise transmission; (e) plus$ 5{\text{%}} $ before and after noise transmission waveform comparison chart; (c) plus$ 1{\text{%}} $ figure noise transmission; (f) plus$ 1{\text{%}} $ before and after noise transmission waveform comparison chart图 12
$ 1+2 $ 维$P=1.05\; \text{mW}, W=1.30\; \text{μm}$ 情况下加噪声孤子传输图 (a)$ 10{\text{%}} $ 噪声传输图; (d)$ 10{\text{%}} $ 噪声传输前后波形对比图; (b)$ 5{\text{%}} $ 噪声传输图; (e)$ 5{\text{%}} $ 噪声传输前后波形对比图; (c)$ 1{\text{%}} $ 噪声传输图; (f)$ 1{\text{%}} $ 噪声传输前后波形对比图Fig. 12.
$ 1 + 2 $ dimension$P=1.05\; \text{mW}, W=1.30\; \text{μm}$ cases and soliton transmission noise figure: (a) plus$ 10{\text{%}} $ figure noise transmission; (d) plus$ 10{\text{%}} $ before and after noise transmission waveform comparison chart; (b) plus$ 5{\text{%}} $ figure noise transmission; (e) plus$ 5{\text{%}} $ before and after noise transmission waveform comparison chart; (c) plus$ 1{\text{%}} $ figure noise transmission; (f) plus$ 1{\text{%}} $ before and after noise transmission waveform comparison chart图 13
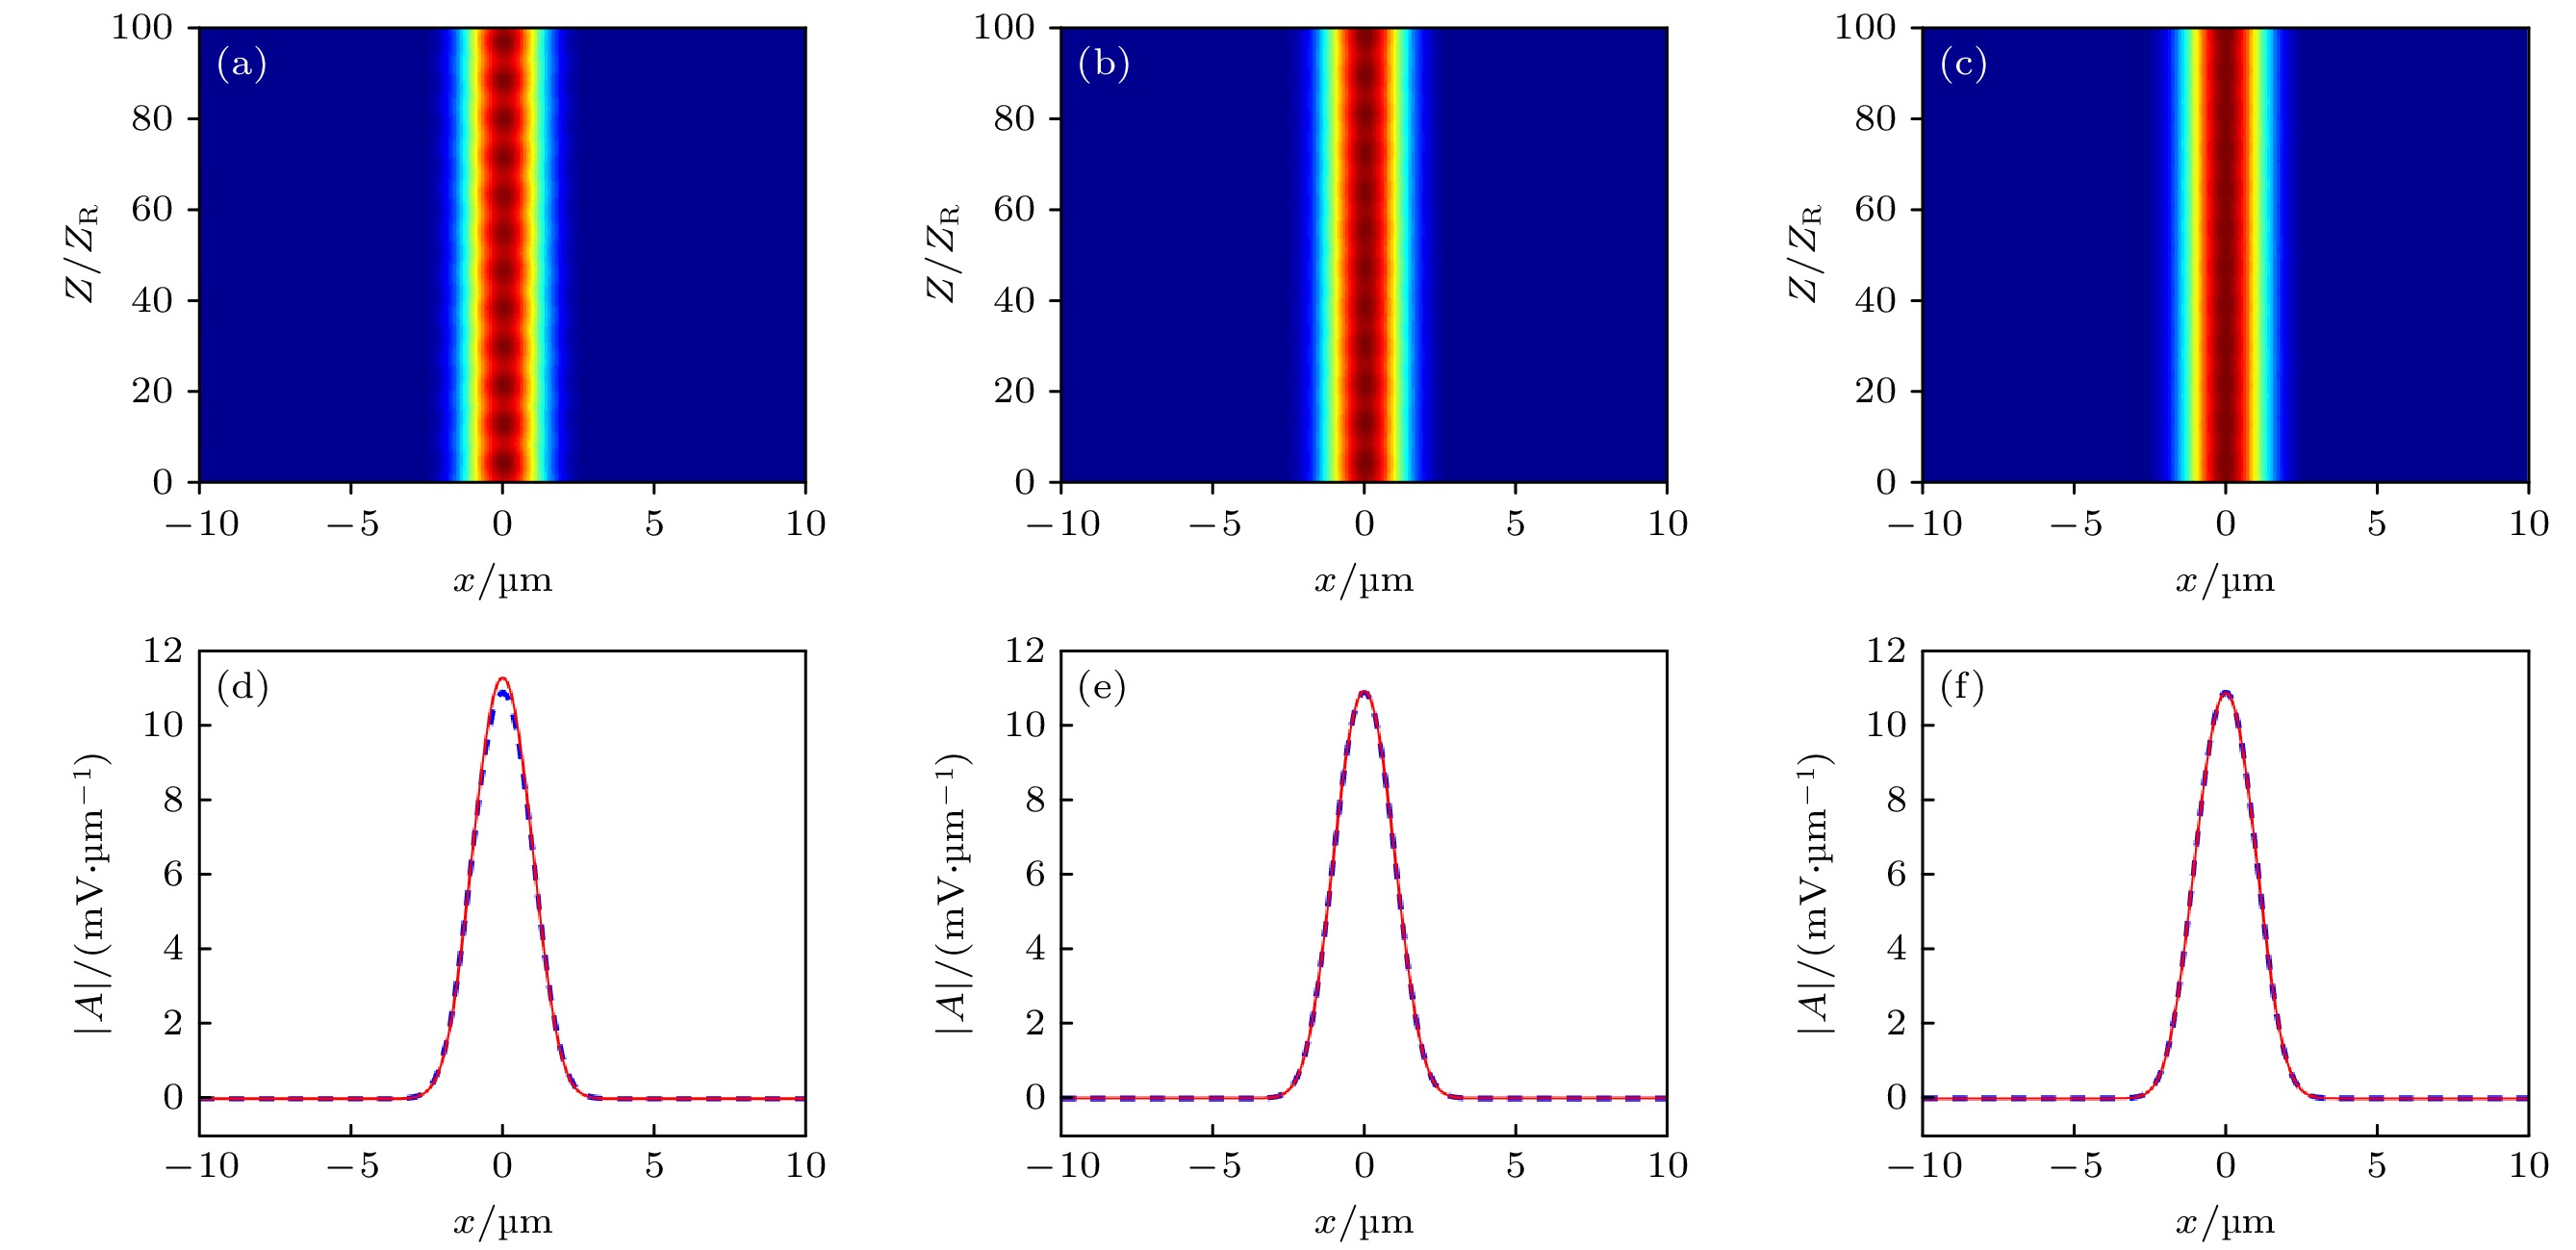
$ 1+2 $ 维$P=113.87\; \text{mW}, W=1.30\; \text{μm}$ 情况下加噪声孤子传输 (a)$ 10{\text{%}} $ 噪声传输图; (d)$ 10{\text{%}} $ 噪声传输前后波形对比图; (b)$ 5{\text{%}} $ 噪声传输图; (e)$ 5{\text{%}} $ 噪声传输前后波形对比图; (c)$ 1{\text{%}} $ 噪声传输图; (f)$ 1{\text{%}} $ 噪声传输前后波形对比图Fig. 13.
$ 1 + 2 $ dimension$P=113.87\; \text{mW}, W=1.30\; \text{μm}$ cases and soliton transmission noise figure: (a) plus$ 10{\text{%}} $ figure noise transmission; (d) plus$ 10{\text{%}} $ before and after noise transmission waveform comparison chart; (b) plus$ 5{\text{%}} $ figure noise transmission; (e) plus$ 5{\text{%}} $ before and after noise transmission waveform comparison chart; (c) plus$ 1{\text{%}} $ figure noise transmission; (f) plus$ 1{\text{%}} $ before and after noise transmission waveform comparison chart -
[1] Wagner W G, Haus H A, Marburger J H 1968 Phys. Rev. 175 256
 Google Scholar
[2] Snyder A W, Mitchell D J 1997 Science 276 1538
 Google Scholar
[3] Stegeman G I A, Christodoulides D N, Segev M 2000 IEEE J. Sel. Top. Quantum Electron. 6 1419
 Google Scholar
[4] 曹觉能, 郭旗 2005 54 3688
 Google Scholar
Cao J N, Guo Q 2005 Acta Phys. Sin. 54 3688
 Google Scholar
[5] Chen Z G, Segev M, Segev M, Christodoulides D N 2012 Rep. Prog. Phys. 75 086401
 Google Scholar
[6] Coutaz J L, Kull M 1991 J. Opt. Soc. Am. B 8 95
 Google Scholar
[7] Mohanraj P, Sivakumar R, Arulanandham A M S, Gunavathy K V 2022 Opt. Quant. Electron. 54 386
 Google Scholar
[8] Gatz S, Herrmann J 1991 J. Opt. Soc. Am. B 8 2296
 Google Scholar
[9] Christian J M, Lundie M J 2017 J. Nonlinear Opt. Phys. 26 1750024
 Google Scholar
[10] Sahoo A, Mahato D K, Govindarajan A, Sarma A K 2022 Phys. Rev. A 105 063503
 Google Scholar
[11] Krolikowski W, Bang O, Rasmussen J J, Wyller J 2001 Phys. Rev. E 64 016612
 Google Scholar
[12] Edmundson D E, Enns R H 1992 Opt. Lett. 17 586
 Google Scholar
[13] Edmundson D E, Enns R H 1995 Phys. Rev. A 51 2491
 Google Scholar
[14] Enns R H, Rangnekar S, Kaplan A E 1987 Phys. Rev. A 35 466
 Google Scholar
[15] Marburger J H, Dawes E L 1968 Phys. Rev. Lett. 21 556
 Google Scholar
[16] Dawes E L, Marburger J H 1969 Phys. Rev. 179 862
 Google Scholar
[17] Stegeman G I, Christodoulides D N, Segev M 2000 J. Sel. Top. Quantum Electron. 6 1419
[18] Peccianti M, De Rossi A, Assantoa G, De Luca A, Umenton C, Khoo I C 2000 Appl. Phys. Lett. 77 7
 Google Scholar
[19] Peccianti M, Brzdkiewicz K A, Assanto G 2002 Opt. Lett. 27 1460
 Google Scholar
[20] Peccianti M, Conti C, Assantoa G 2003 J. Nonlinear Opt. Phys. Mater. 12 525
 Google Scholar
[21] Peccianti M, Assanto G 2012 Phys. Rep. 516 147
 Google Scholar
[22] Kravets N, Piccardi A, Alberucci A, Buchnev O, Kaczmarek M, Assanto G 2014 Phys. Rev. Lett. 113 023901
 Google Scholar
[23] Alberucci A, Laudyn U A, Piccardi A, Kwasny M, Klus B, Karpierz M A, Assanto G 2017 Phys. Rev. E 96 012703
 Google Scholar
[24] Conti C, Peccianti M, Assanto G 2003 Phys. Rev. Lett. 91 073901
 Google Scholar
[25] Keller H B 1997 Numerical Solution of Bifurcation and Nonlinear Eigenvalue Problemsions of Bifurcation Theory (New York: Academia Press) pp359–384
[26] Yang J K, Lakoba T I 2008 Stud. Appl. Math. 120 265
 Google Scholar
[27] Press W H, Teukolsky S A, Vetterling W T, Flannery B P 2007 Numerical Recipes: The Art of Scientific Computing (3rd Ed.) (New York: Cambridge University Press) pp1087–1103
[28] Assanto G, Peccianti M 2003 IEEE J. Quantum Electron. 39 13
 Google Scholar
[29] Deuling H J 1972 Mol. Cryst. Liq. Cryst. 19 123
 Google Scholar
计量
- 文章访问数: 5561
- PDF下载量: 89
- 被引次数: 0


 下载:
下载:


