-
The asymmetric origin of matter and antimatter in the universe is an important unsolved mystery in science today. In this paper, we briefly review the history of antimatter research and the recent international hotspots of related research. This paper focuses on the advances in antimatter research made in recent years at the large-scale international RHIC-STAR experiment at the Relativistic Heavy Ion Collider, including the discovery of the first antimatter hypernucleus (anti-hypertriton), antimatter helium 4 and antihyperhydrogen 4, the first measurements of antiproton interactions, and the precise measurements of the mass and binding energy of the hypertriton and anti-hypertriton. The antimatter hypertriton nucleus, composed of an antiproton, an antineutron, and an anti-Λ hyperon, is the first anti-hypernucleu to be discovered, extending the three-dimensional nuclide map from the anti-strange quark degree of freedom. Antimatter Helium 4 is the heaviest stable antimatter nucleus yet discovered. Anti-hyperhydrogen 4, just discovered in 2024, is composed of an antiproton, two antineutrons, and an anti-Λ hyperon, and is the heaviest antimatter hypernucleus to date. Equivalence to the proton-proton interaction was established by measurements of the antiproton-antiproton interaction. At the same time, precise measurements of the mass of hypertriton and anti-hypertriton nuclei confirmed the equivalence of matter and antimatter. And these also fully demonstrate that the CPT symmetry is also valid for antimatter nuclei. Measurements of the binding energy of the hypertriton nucleus indicate that the interaction between Λ and the nucleus of the hypertriton (the deuterium nucleus) is strong, which differs from the earlier common belief that the hypertriton nucleus is a weakly bound system. Furthermore, we discuss different physical mechanisms for the production of (anti) light nuclei, mainly including thermal, coalescence and relativistic kinetic models. Finally, we also present recent results from antihydrogen atom experiments at CERN, antimatter space probes, etc., and discuss the implications of these advances for understanding the structure of matter. Overall, the existing studies of antimatter nuclei and atoms have not yet provided clear evidence for the asymmetric origin of matter and antimatter in the universe, which can help further improve the accuracy of various measurements in antimatter research. Of course, other efforts in this direction in nuclear and particle physics are well expected.
-
Keywords:
- antimatter nucleus /
- CPT symmetry /
- mechanism of (antimatter) light nucleus production /
- antihydrogen atom
[1] Lee T D, Yang C N 1956 Phys. Rev. 104 254
[2] Wu C S, Ambler E, Hayward R W, Hoppes D D, Hudson R P 1957 Phys. Rev. 105 1413
[3] Christenson J H, Fitch V L, Cronin J W, Turlay R 1964 Phys. Rev. Lett. 13 138
 Google Scholar
[4] Schuster A 1898 Nature 1503 367
[5] Dirac P 1928 Proceedings of the Royal Society of London Series A 117 610
[6] Chao C Y 1930 PNAS 16 431
[7] Anderson C D 1932 Phys. Rev. 41 405
 Google Scholar
[8] Chamberlain O, Goldhaber G, Jauneau L, Kalogeropoulos T, Segrè E, Silberberg R 1959 Phys. Rev. 113 1615
 Google Scholar
[9] Dorfan D E, Eades J, Lederman L M, Lee W, Ting C C 1965 Phys. Rev. Lett. 14 1003
 Google Scholar
[10] Antipov Yu M, Denisov S P, Donskov S V, et al. 1971 Nucl. Phys. B 31 235
 Google Scholar
[11] Abelev B, et al. 2010 Science 328 58
 Google Scholar
[12] STAR Collaboration 2011 Nature 473 353
 Google Scholar
[13] STAR Collaboration 2015 Nature 527 345
 Google Scholar
[14] STAR Collaboration 2020 Nat. Phys. 16 409
 Google Scholar
[15] STAR Collaboration 2024 Nature 632 1026
 Google Scholar
[16] Chen J, Keane D, Ma Y G, Tang A, Xu Z 2018 Phys. Rep. 760 1
 Google Scholar
[17] Arsene I, et al. (BRAHMS Collaboration) 2005 Nucl. Phys. A 757 1
 Google Scholar
[18] Back B B, et al. (PHOBOS Collaboration) 2005 Nucl. Phys. A 757 28
 Google Scholar
[19] Adam J, et al. (STAR Collaboration) 2005 Nucl. Phys. A 757 102
 Google Scholar
[20] Adcox K, et al. (PHENIX Collaboration) 2005 Nucl. Phys. A 757 184
 Google Scholar
[21] Arkhipkin D, Lauret J 2017 J. Phys. Conf. Ser. 898 032023
 Google Scholar
[22] Adamczyk L, Adkins J K, Agakishiev G, et al. 2017 Nat. 548 62
 Google Scholar
[23] STAR Collaboration 2023 Nat. 614 244
 Google Scholar
[24] Wang X N 2023 Nucl. Sci. Tech. 34 15
 Google Scholar
[25] Adams J, et al. (STAR Collaboration) 2021 Phys. Rev. Lett. 127 052302
 Google Scholar
[26] 杨帅, 唐泽波, 杨驰, 查王妹 2023 72 211201
 Google Scholar
Yang S, Tang Z B, Yang C, Zha W M 2023 Acta Phys. Sin. 72 211201
 Google Scholar
[27] STAR Collaboration 2023 Sci. Adv. 9 eabq3903
 Google Scholar
[28] Ma Y G 2023 Nucl. Sci. Tech. 34 16
 Google Scholar
[29] Abdallah M S, et al. (STAR Collaboration) 2022 Phys. Rev. C 105 014901
 Google Scholar
[30] 寿齐烨, 赵杰, 徐浩洁, 李威, 王钢, 唐爱洪, 王福强 2023 72 112504
 Google Scholar
Shou Q Y, Zhao J, Xu H J, Li W, Wang G, Tang A H, Wang F Q 2023 Acta Phys. Sin. 72 112504
 Google Scholar
[31] 赵新丽, 马国亮, 马余刚 2023 72 112502
 Google Scholar
Zhao X L, Ma G L, Ma Y G 2023 Acta Phys. Sin. 72 112502
 Google Scholar
[32] Liang Z T, Wang X N 2005 Phys. Rev. Lett. 94 102301
 Google Scholar
[33] Liang Z T, Wang X N 2005 Phys. Lett. B 629 20
 Google Scholar
[34] 高建华, 黄旭光, 梁作堂, 王群, 王新年 2023 72 072501
 Google Scholar
Gao J H, Huang X G, Liang Z T, Wang Q, Wang X N 2023 Acta Phys. Sin. 72 072501
 Google Scholar
[35] 盛欣力, 梁作堂, 王群 2023 72 072502
 Google Scholar
Sheng X L, Liang Z T, Wang Q 2023 Acta Phys. Sin. 72 072502
 Google Scholar
[36] 阮丽娟, 许长补, 杨驰 2023 72 112401
 Google Scholar
Ruan L J, Xu Z B, Yang C 2023 Acta Phys. Sin. 72 112401
 Google Scholar
[37] Chen J H, Keane D, Ma Y G, Oliva L, Sheng X L, Singha S, Sun X, Tang A H, Wang Q, Zhou C S 2024 Nucl. Phys. News 34 17
 Google Scholar
[38] Chen J, Liang Z T, Ma Y G, Wang Q 2023 Sci. Bull. 68 874
 Google Scholar
[39] Lattimer J M, Prakash M 2004 Science 304 536
 Google Scholar
[40] Lea R 2013 Nucl. Phys. A 914 415
 Google Scholar
[41] 马余刚, 陈金辉 2011 科学 63 11
Ma Y G, Chen J H 2011 Science 63 11
[42] 马余刚, 陈金辉 2011 中国基础科学 13 20
 Google Scholar
Ma Y G, Chen J H 2011 Chin. Bas. Sci. 13 20
 Google Scholar
[43] Xue L, (for the STAR Collaboration) 2011 Jour. of Phys. G: Nucl. and Part. Phys. 38 124072
 Google Scholar
[44] Ma Y G 2013 J. Phys. Conf. Ser. 420 012036
 Google Scholar
[45] 马余刚 2012 科学发展报告 (北京: 科学出版社) 第108页
Ma Y G 2012 Sci. Dev. Rep. (Beijing: Science Press) p108
[46] Abdallah M, et al. 2022 Phys. Lett. B 834 137449
 Google Scholar
[47] Hanbury Brown R, Twiss R Q 1956 Nature 178 1046
 Google Scholar
[48] Ma Y G, Fang D Q, Sun X Y, et al. 2015 Phys. Lett. B 743 306
 Google Scholar
[49] Zhang Z Q, Ma Y G 2016 Nucl. Sci. Tech. 27 152
 Google Scholar
[50] 马余刚, 张正桥 2016 科学 68 10
Ma Y G, Zhang Z Q 2016 Science 68 10
[51] Liu P 2019 Nucl. Phys. A 982 811
 Google Scholar
[52] ALICE Collaboration 2015 Nat. Phys. 11 811
 Google Scholar
[53] Ma Y G 2023 Nucl. Sci. Tech. 34 97
 Google Scholar
[54] Chen J H, Dong X, Ma Y G, Xu Z 2023 Sci. Bull. 68 3252
 Google Scholar
[55] Liu D N, Ko C M, Ma Y G, Mazzaschi F, Puccio M, Shou Q Y, Sun K J, Wang Y Z 2024 Phys. Lett. B 855 138855
 Google Scholar
[56] Acharya S, et al. 2023 Nat. Phys. 19 61
 Google Scholar
[57] Zhu L L, Wang B, Wang M, Zheng H 2022 Nucl. Sci. Tech. 33 245
 Google Scholar
[58] Lan S W, Shi S S 2022 Nucl. Sci. Tech. 33 21
 Google Scholar
[59] 孙旭, 周晨升, 陈金辉, 陈震宇, 马余刚, 唐爱洪, 徐庆华 2023 72 072401
 Google Scholar
Sun X, Zhou C S, Chen J H, Chen Z Y, Ma Y G, Tang A H, Xu Q H 2023 Acta Phys. Sin. 72 072401
 Google Scholar
[60] Ko C M 2023 Nucl. Sci. Tech. 34 80
 Google Scholar
[61] 孙开佳, 陈列文, 柯治明, 李峰, 徐骏, 许长补 2023 核技术 46 040012
 Google Scholar
Sun K J, Chen L W, Ko C M, Li F, Xu Z B 2023 Nucl. Tech. 46 040012
 Google Scholar
[62] Andronic A, Braun-Munzinger P, Redlich K, Stachel H 2018 Nat. 561 321
 Google Scholar
[63] 张宇, 张定伟, 罗晓峰 2023 核技术 46 040001
 Google Scholar
Zhang Y, Zhang D, Luo X 2023 Nucl. Tech. 46 040001
 Google Scholar
[64] 姜寅, 廖劲峰 2023 核技术 46 040011
 Google Scholar
Jiang Y, Liao J F 2023 Nucl. Tech. 46 040011
 Google Scholar
[65] 陈倩, 马国亮, 陈金辉 2023 核技术 46 040013
 Google Scholar
Chen Q, Ma G L, Chen J H 2023 Nucl. Tech. 46 040013
 Google Scholar
[66] 李甫鹏, 庞龙刚, 王新年 2023 核技术 46 040014
 Google Scholar
Li F P, Pang L G, Wang X N 2023 Nucl. Tech. 46 040014
 Google Scholar
[67] He W B, Ma Y G, Pang L G, Song H C, Zhou K 2023 Nucl. Sci. Tech. 34 88
 Google Scholar
[68] Ma Y G, Pang L G, Wang R, Zhou K 2023 Chin. Phys. Lett. 40 122101
 Google Scholar
[69] Zhao J, Chen J H, Huang X G, Ma Y G 2024 Nucl. Sci. Tech. 35 20
 Google Scholar
[70] Pang L G, Wang X N 2023 Nucl. Sci. Tech. 34 194
 Google Scholar
[71] Wu W H, Tao J Q, Zheng H, Zhang W C, Liu X Q, Zhu L L, Bonasera A 2023 Nucl. Sci. Tech. 34 151
 Google Scholar
[72] Andronic A, Braun-Munzinger P, Stachel J, Stocker H 2011 Phys. Lett. B 697 203
 Google Scholar
[73] Hirenzaki S, Suzuki T, Tanihata I 1993 Phys. Rev. C 48 2403
 Google Scholar
[74] Cho S, et al. 2017 Prog. Part. Nucl. Phys. 95 279
 Google Scholar
[75] Shao T, Chen J, Ma Y G, Xu Z 2022 Phys. Rev. C 105 065801
 Google Scholar
[76] Shah N, Ma Y G, Chen J H, Zhang S 2016 Phys. Lett. B 754 6
 Google Scholar
[77] Zhang L, Zhang S, Ma Y G 2022 Euro. Phys. J. C 82 416
 Google Scholar
[78] Wang R, Ma Y G, Chen L W, Ko C M, Sun K J, Zhang Z 2023 Phys. Rev. C 108 L031601
 Google Scholar
[79] Danielewicz P, Bertsch G F 1991 Nucl. Phys. A 533 712
 Google Scholar
[80] Sun K J, Wang R, Ko C M, Ma Y G, Shen C 2024 Nat. Commun. 15 1074
 Google Scholar
[81] Bleicher M 2024 Nucl. Sci. Tech. 35 129
 Google Scholar
[82] Abdulhamid M, et al. (STAR Collaboration) 2023 Phys. Rev. Lett. 130 202301
 Google Scholar
[83] Andresen G B, Ashkezari M, Baquero-Ruiz M, et al. 2010 Nature 468 673
 Google Scholar
[84] Amoretti M, Amsler C, Bonomi G, et al. 2002 Nature 419 456
 Google Scholar
[85] ALPHA Collaboration 2011 Nat. Phys. 7 558
 Google Scholar
[86] Amole C, Ashkezari M, Baquero-Ruiz M, et al 2014 Nat. Commun. 5 3955
 Google Scholar
[87] Ahmadi M, Baquero-Ruiz M, Bertsche W, et al. 2016 Nature 529 373
 Google Scholar
[88] Ulmer S, et al. 2015 Nature. 524 196
 Google Scholar
[89] Borchert M J, Devlin J A, Erlewein S R, et al. 2021 Nature 601 53
 Google Scholar
[90] Ahmadi M, Alves B, Baker C, et al. 2017 Nature 541 506
 Google Scholar
[91] Ahmadi M, Alves B X R, Baker C J, et al. 2018 Nature 557 71
 Google Scholar
[92] ALPHA Collaboration 2020 Nature 578 375
 Google Scholar
[93] Baker C J, Bertsche W, Capra A, et al. 2020 Nature 592 35
 Google Scholar
[94] Soter A 2023 Nature 621 699
 Google Scholar
[95] Anderson E K, Baker C J, Bertsche W, et al. 2023 Nature 621 716
 Google Scholar
[96] Smorra C, Sellner S, Borchert M, et al. 2017 Nature 550 371
 Google Scholar
[97] Aguilar M, et al. (AMS Collaboration) 2021 Phys. Rep. 894 1
 Google Scholar
[98] Adriani O, Barbarino G C, Bazilevskay G A, et al. 2011 Science 332 69
 Google Scholar
[99] Ajello M, et al. (FERMI-LAT Collaboration) 2022 Science 376 521
 Google Scholar
[100] Abe K, et al. 2012 Phys. Rev. Lett. 108 051102
 Google Scholar
[101] Sakai K, et al. (BESS Collaboration) 2024 Phys. Rev. Lett. 132 131001
 Google Scholar
[102] Aguilar M, et al. (AMS Collaboration) 2019 Phys. Rev. Lett. 122 101101
 Google Scholar
[103] Aguilar M, et al. (AMS Collaboration) 2019 Phys. Rev. Lett. 122 041102
 Google Scholar
[104] Aguilar M, et al. (AMS Collaboration) 2018 Phys. Rev. Lett. 121 051102
 Google Scholar
[105] Aguilar M, et al. (AMS Collaboration) 2023 Phys. Rev. Lett. 130 161001
 Google Scholar
[106] Aguilar M, et al. (AMS Collaboration) 2023 Phys. Rev. Lett. 131 151002
 Google Scholar
-
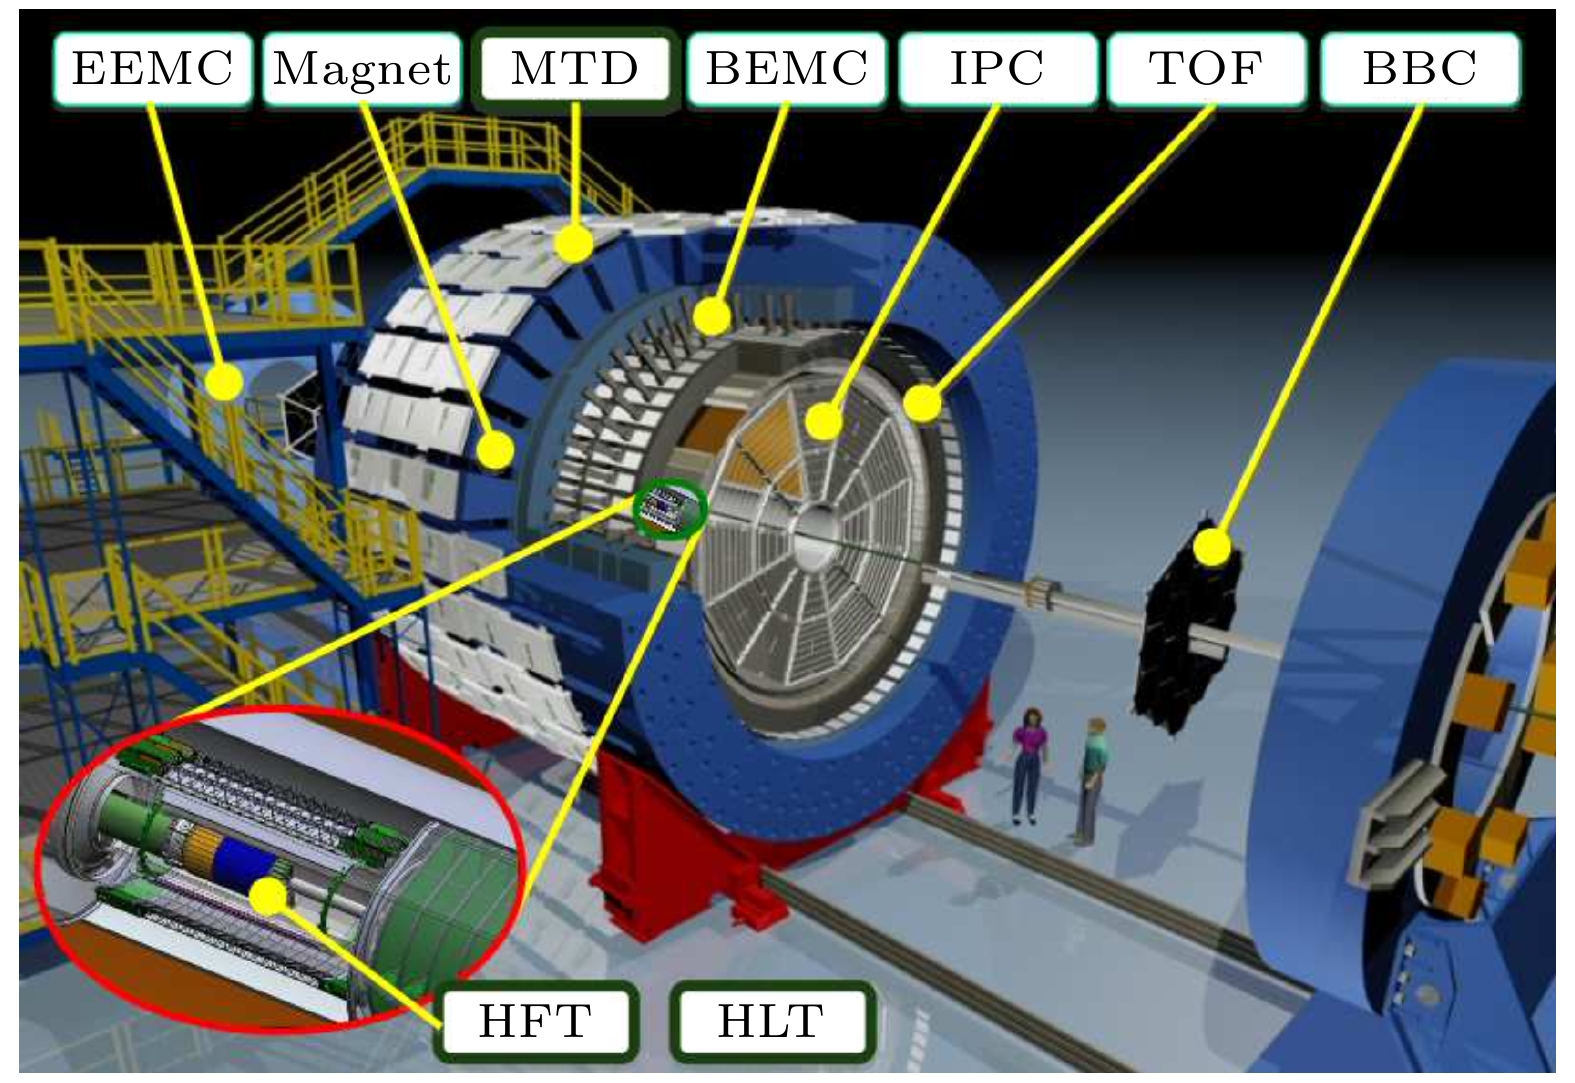
图 1 RHIC-STAR探测器概览. 主要子系统包括磁铁、时间投影室(TPC)、飞行时间谱仪(TOF)、电磁量能器(BEMC/EEMC)、缪子望远镜(MTD)、重味径迹探测器(HFT)、高阶触发器(HLT). STAR总共拥有超过18个探测器子系统[21]
Figure 1. Overview of the RHIC-STAR detector. The main subsystems include magnets, time projection chamber (TPC), time of flight detector (TOF), electromagnetic calorimeters (BEMC/EEMC), Muon telescope detector (MTD), heavy flavor tracker (HFT), and high-level trigger (HLT). STAR has a total of over 18 detector subsystems[21].
图 2 (a)超氚核的衰变产物3He+ + $ \text{π}^- $的不变质量分布, 峰位是候选超氚核的分布[11]; (b)反超氚核的衰变产物3He– + $ \text{π}^+ $的不变质量分布, 峰位是候选反超氚核的分布[11]. 开圆代表候选信号的分布; 黑色实线为背景分布; 蓝色虚线为信号(高斯)加背景(双指数)的综合拟合
Figure 2. (a) Invariant mass distributions of decay products 3He+ + $ \text{π}^- $ from $ ^3_\Lambda {\rm{H}}$, and the peak position corresponds to the distribution of candidate hypertritons[11]; (b) invariant mass distributions of decay products 3He– + $ \text{π}^+ $ from $ \overline{^3_\Lambda {\mathrm{H}}} $, and the peak position corresponds to the distribution of candidate anti-hypertritons[11]. Open circles represent the distribution of candidate signals; solid black line indicates the background distribution; blue dashed line represents the combined fit of the signal (Gaussian) and the background (double exponential).
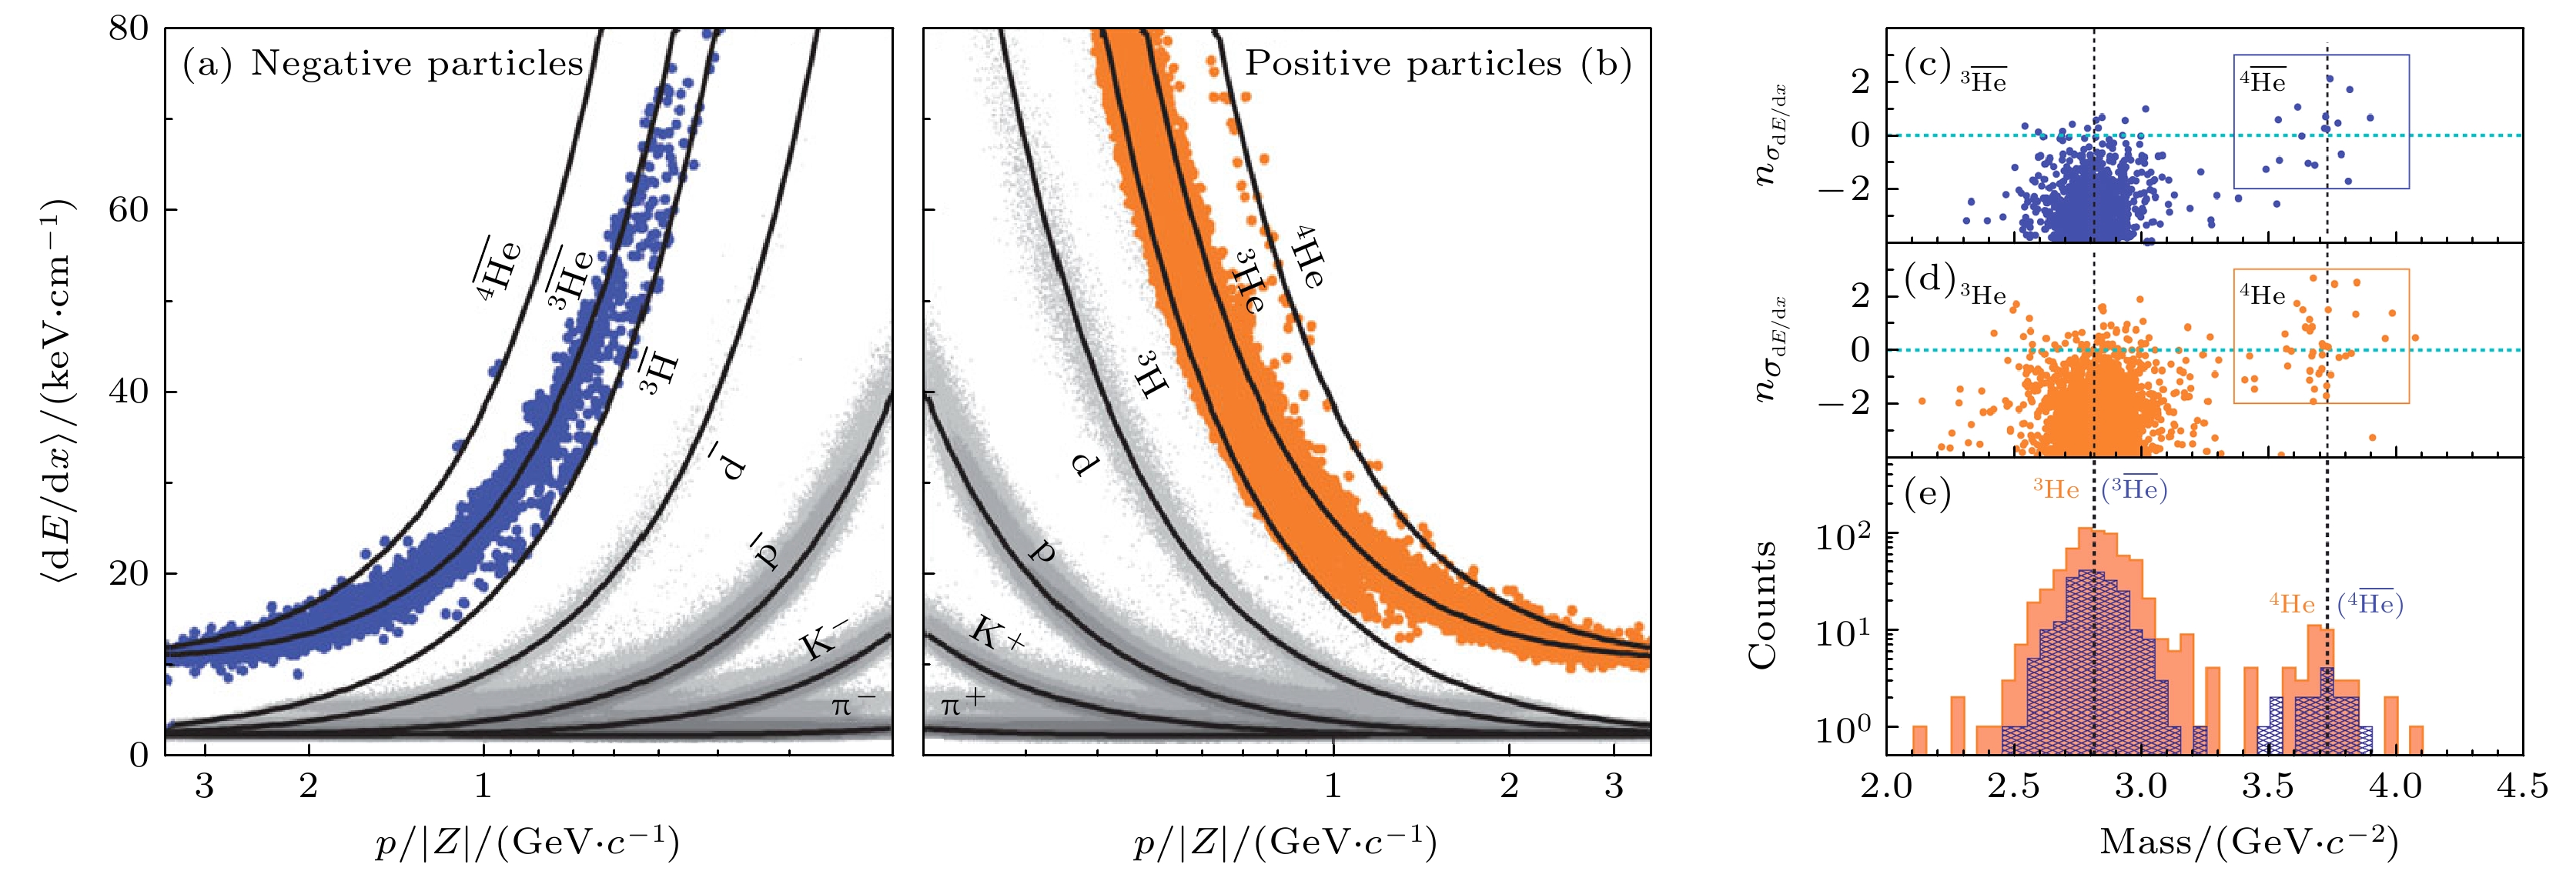
图 3 (a), (b)$ \langle {{{\mathrm{d}}E}}/{{{\mathrm{d}}x}} \rangle $与p/|Z|的关系图[12] (a)带负电的粒子(灰色和蓝色点); (b)带正电的粒子(灰色和橙色点). 其中黑色曲线表示每种粒子的预期值; 标有p, $ \overline{{\mathrm{p}}} $, K和π的带分别对应质子、反质子、K介子和π介子. (c)—(e)根据每电荷动量和飞行时间计算出的能量损失和质量进行同位素鉴别[12] (c), (d)以带负电荷粒子(a)和带正电荷粒子(b)的倍数为单位的dE/dx作为TOF系统测量的质量函数; (e) 图(c), (d)在质量轴上的投影, 这些粒子的选取范围是$-2 < n_{\sigma_{{\mathrm{d}}E/{\mathrm{d}}x}} < 3 $
Figure 3. (a), (b) Relationship between $ \langle {{{\mathrm{d}}E}}/{{{\mathrm{d}}x}} \rangle $ and p/|Z|[12]: (a) Negatively charged particles (gray and blue points); (b) positively charged particles (gray and orange points). Black curves represent the expected values for each type of particle. The labels p, $ \overline{{\mathrm{p}}} $, K and π correspond to protons, antiprotons, K mesons, and π mesons, respectively. (c)–(e) Isotope identification based on energy loss and mass calculated from momentum and time of flight for each charge[12]: (c), (d) The dE/dx in units of multiples for (a) negatively charged particles and (b) positively charged particles as a function of mass measured by the TOF system; (e) projections of panels (c) and (d) on the mass axis, with the selection range for these particles being $-2 < n_{\sigma_{{\mathrm{d}}E/{\mathrm{d}}x}} < 3 $.
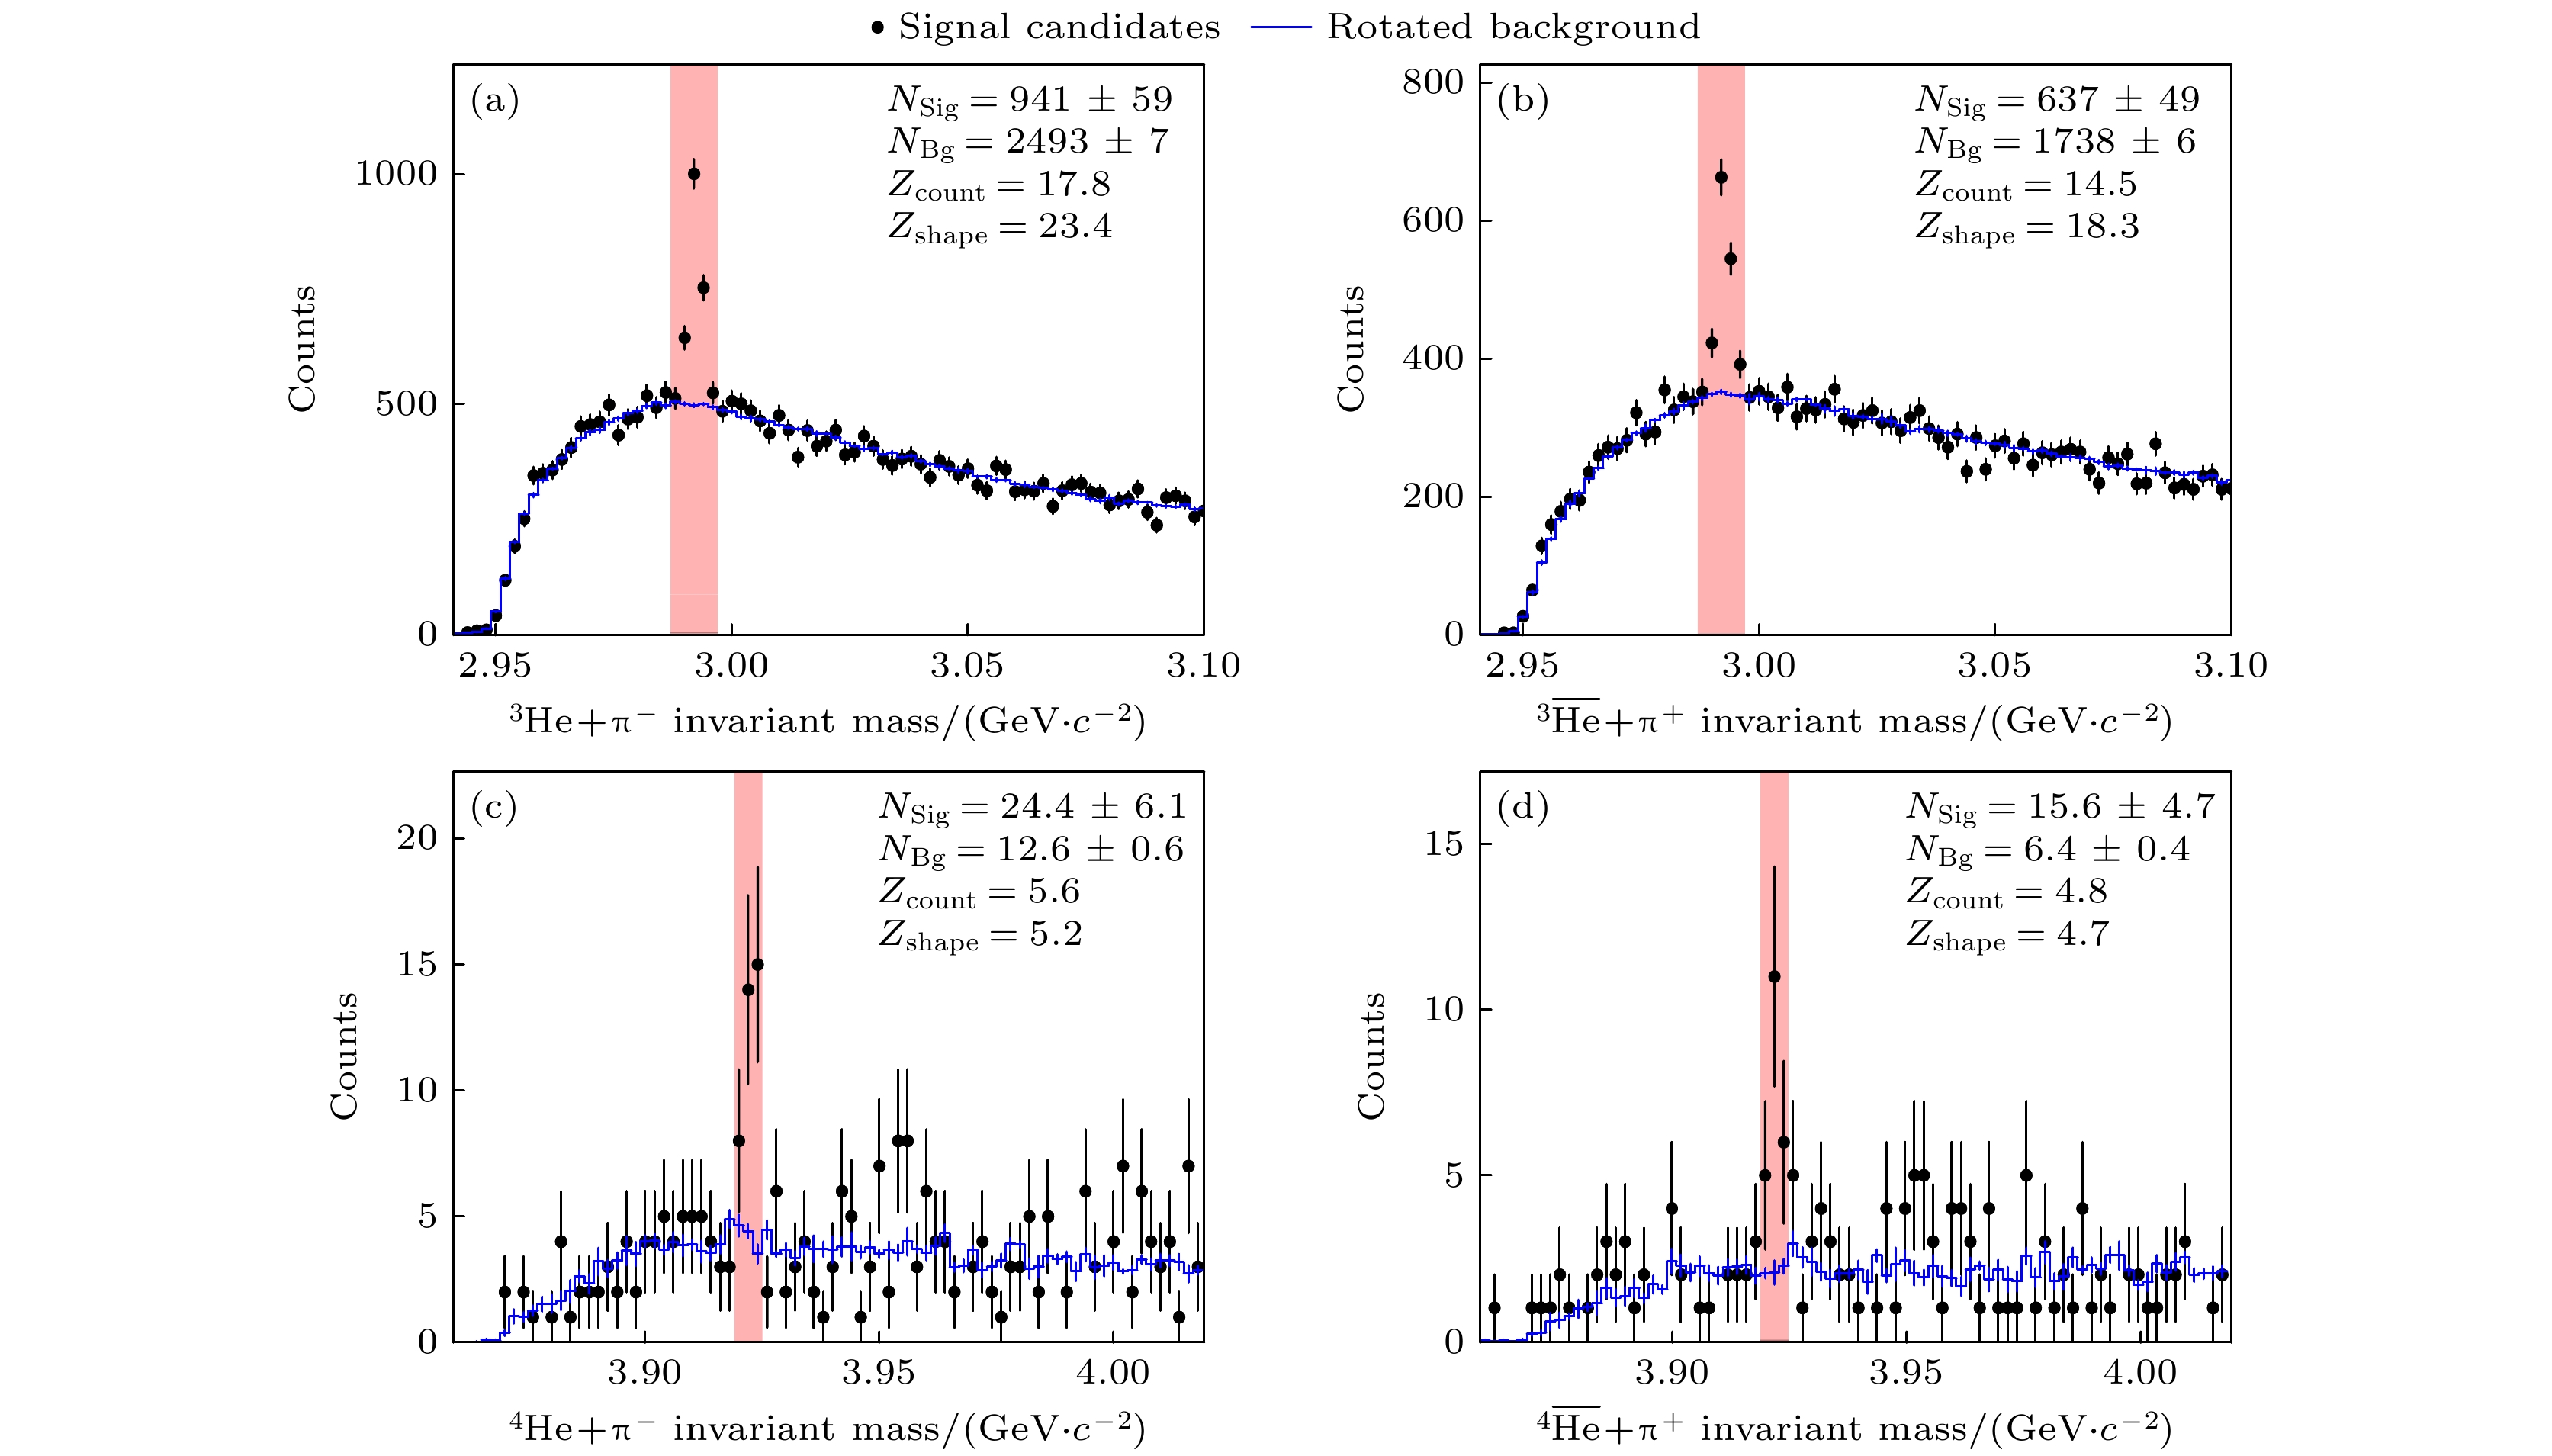
图 4 (a) $ ^3 {\mathrm{He}} $ + $ {\text{π}}^- $, (b) $ {\overline{^3 {\mathrm{He}}}} $ + ${\text{π}}^+ $, (c) $ ^4 {\mathrm{He }}$ + ${\text{π}}^- $和(d) $ {\overline{^4 {\mathrm{He}}}} $ + ${\text{π}}^+ $不变质量的分布[15]. 红色阴影范围标记了信号的不变质量区间, 提取出的信号计数为$ N_{{\mathrm{sig}}} $, 背景计数为$ N_{{\mathrm{Bg}}} $, 使用两种方法计算了信号显著度$ Z_{{\mathrm{shape}}} $和$ Z_{{\mathrm{count}}} $. 其中$ Z_{{\mathrm{shape}}} $通过计算原假设(纯背景)和备择假设(背景+高斯形状的信号)的似然函数之比获得. $ Z_{{\mathrm{count}}} $通过以下公式计算获得: $Z_{{\mathrm{count}}} = \big\{2[N_{{\mathrm{sig}}}+ $$ N_{{\mathrm{Bg}}}{\mathrm{ ln }}(1+N_{{\mathrm{sig}}}/N_{{\mathrm{Bg}}})-N_{{\mathrm{sig}}}]\big\}^{1/2} $
Figure 4. Invariant mass distributions for (a) $ ^3 {\mathrm{He}} $ + $ {\text{π}}^- $, (b) $ {\overline{^3 {\mathrm{He}}}} $ + $ {\text{π}}^+ $, (c) $ ^4 {\mathrm{He}} $ + $ {\text{π}}^- $ and (d) $ {\overline{^4 {\mathrm{He}}}} $ + $ {\text{π}}^+ $ are presented[15]. The red shaded regions indicate the invariant mass ranges for the signal, with the extracted signal counts denoted as $ N_{{\mathrm{sig}}} $ and the background counts as $ N_{{\mathrm{Bg}}} $. Signal significances $ Z_{{\mathrm{shape}}} $ and $ Z_{{\mathrm{count}}} $ were calculated using two methods. The $ Z_{{\mathrm{shape}}} $ was obtained by calculating the ratio of the likelihood functions under the null hypothesis (pure background) and the alternative hypothesis (background + Gaussian-shaped signal). The $ Z_{{\mathrm{count}}} $ was calculated using the formula: $ Z_{{\mathrm{count}}} = \big\{2[N_{{\mathrm{sig}}}+N_{{\mathrm{Bg}}} {\mathrm{ln}} (1+N_{{\mathrm{sig}}}/N_{{\mathrm{Bg}}})-N_{{\mathrm{sig}}}]\big\}^{1/2} $
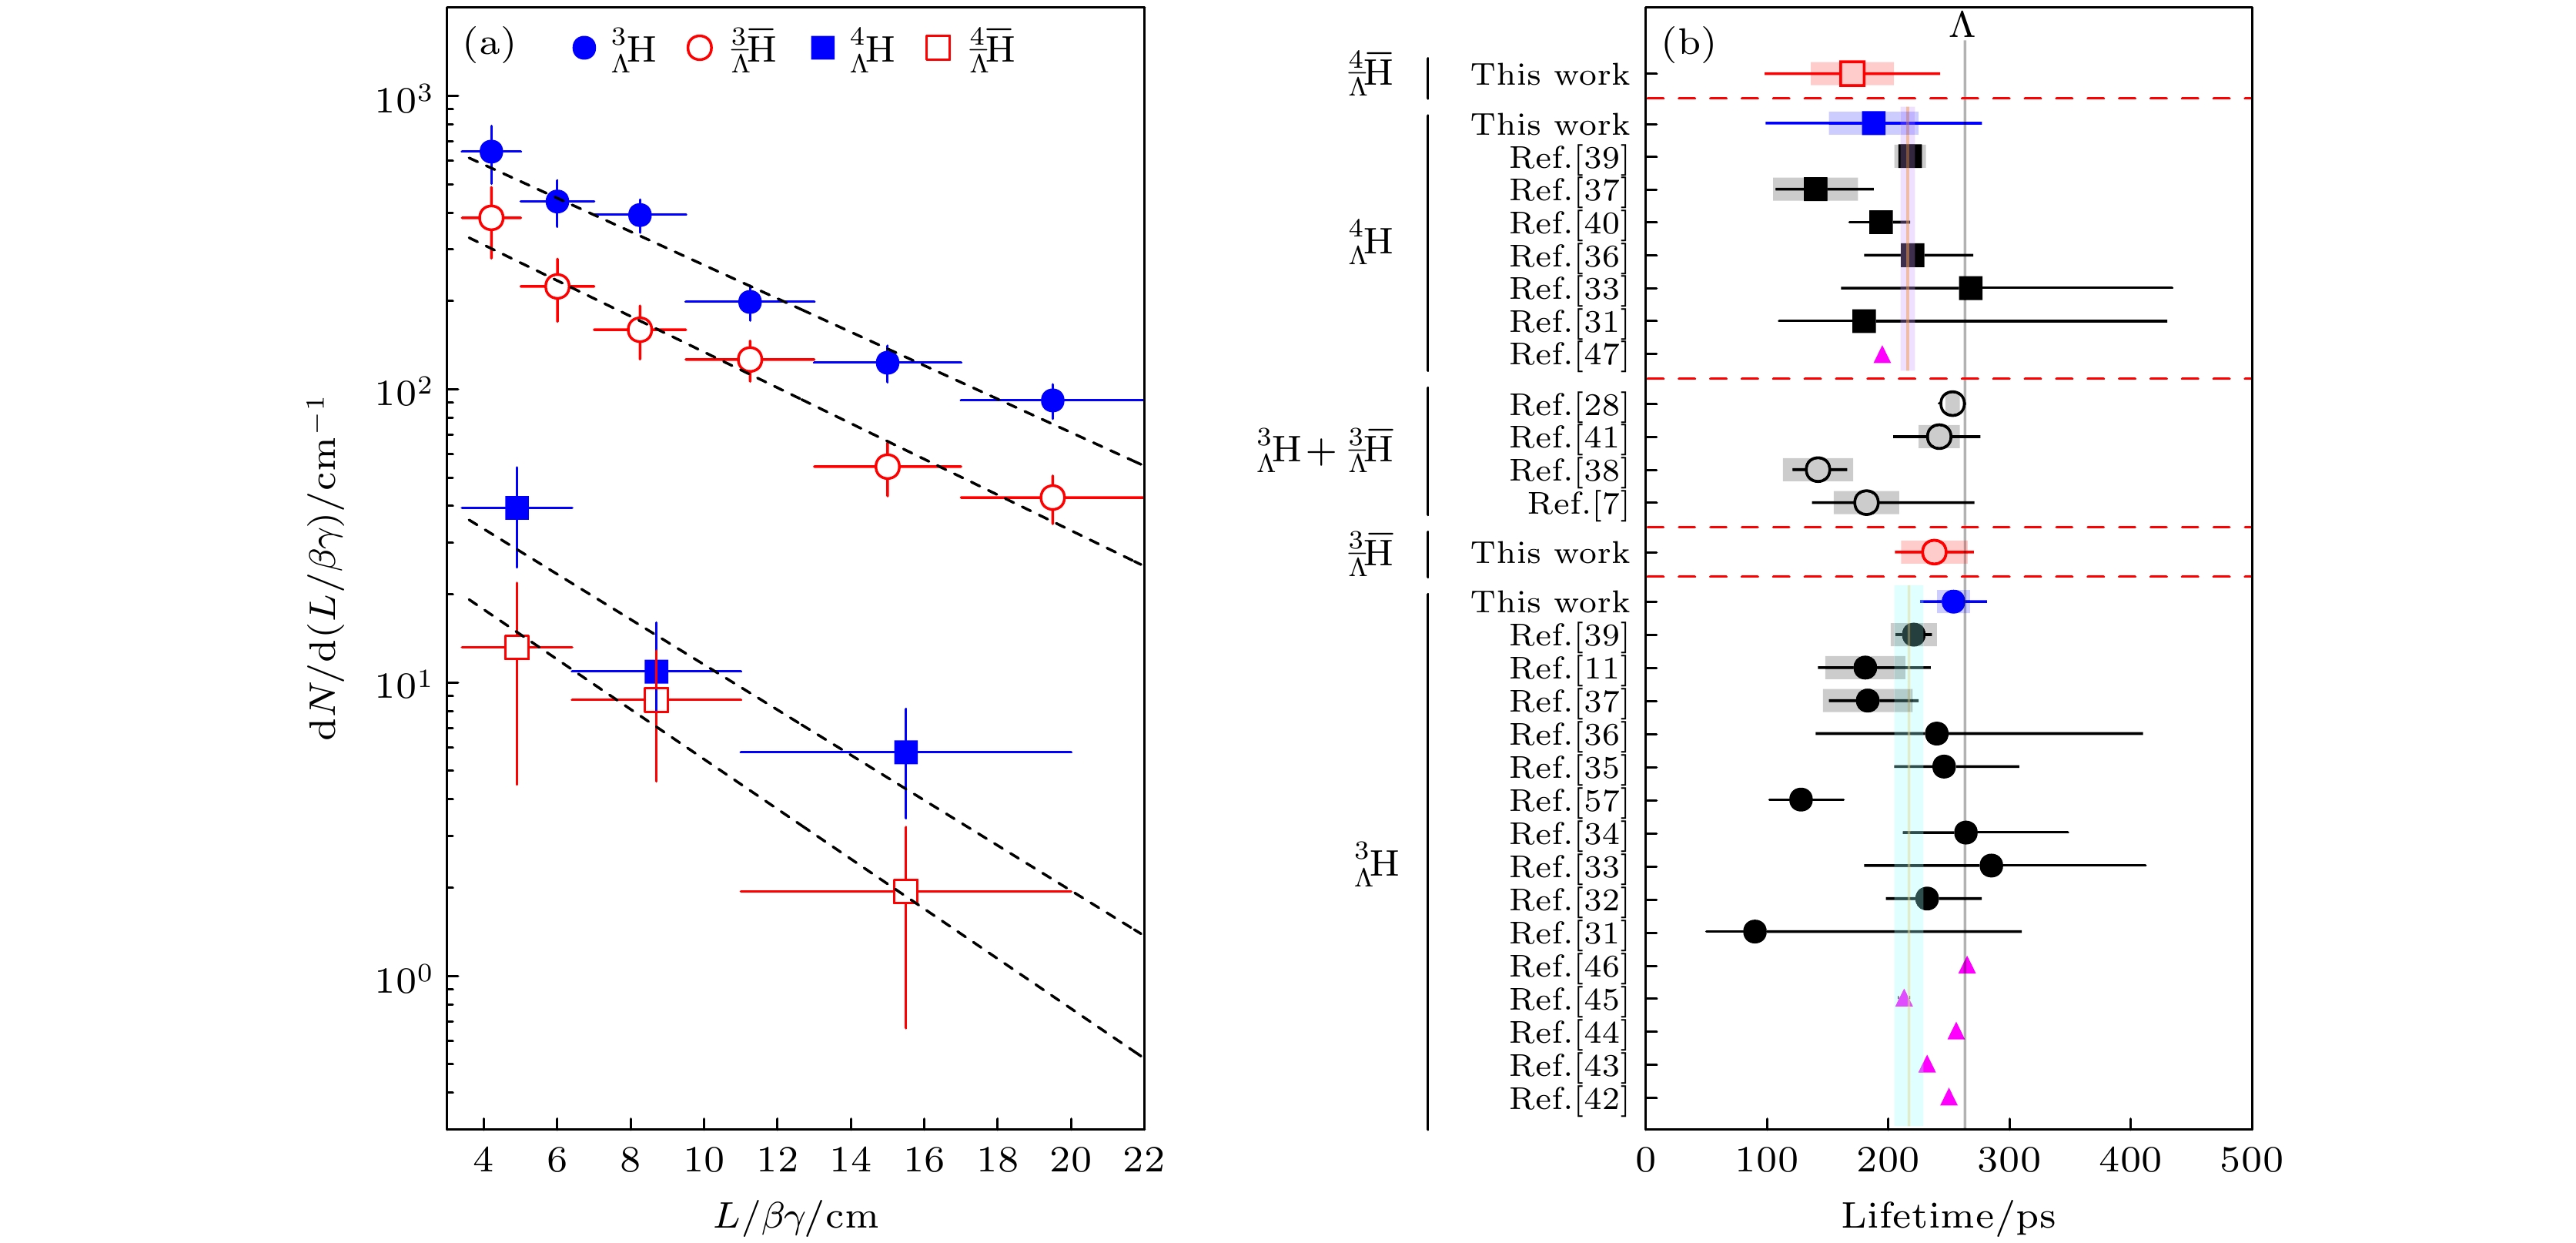
图 5 超核的$ ({\mathrm{d}}N/{\mathrm{d}} L/\beta \gamma) $与$ L/\beta \gamma $的关系以及超核寿命的测量数据[15] (a) $ ^3_\Lambda {\rm{H}}$, $ \overline{^3_\Lambda {\mathrm{H}}} $, $ ^4_\Lambda {\rm{H}}$, $ \overline{^4_\Lambda H} $的$ {\mathrm{d}}N/{\mathrm{d}}(L/\beta \gamma)$与$ L/\beta \gamma $的关系; (b)测量得到的$ ^3_\Lambda {\rm{H}}$, $ \overline{^3_\Lambda {\mathrm{H}}} $, $ ^4_\Lambda {\mathrm{H}} $, $ \overline{^4_\Lambda H} $寿命与国际上的数据和理论预测(实心三角形)的比较. 误差条和方框分别表示统计不确定性和系统不确定性; 带阴影区域的垂直实线代表$ ^3_\Lambda {\rm{H}}$和$ ^4_\Lambda {\rm{H}}$的寿命平均值, 这些数值是根据之前的结果通过最大似然拟合法计算得出的; 灰色垂直线表示自由Λ的寿命
Figure 5. Relationship between ${\mathrm{d}}N/{\mathrm{d}}( L/\beta \gamma)$ and $ L/\beta \gamma $ for hypernuclei, as well as the measured data on hypernuclei lifetimes[15]: (a) ${\mathrm{d}}N/{\mathrm{d}}( L/\beta \gamma) $ of $ ^3_\Lambda {\rm{H}}$, $ \overline{^3_\Lambda {\mathrm{H}}} $, $ ^4_\Lambda {\rm{H}}$, $ \overline{^4_\Lambda {\mathrm{H}}} $ relative to $ L/\beta \gamma $; (b) a comparison of the measured lifetimes of $ ^3_\Lambda {\rm{H}}$, $ \overline{^3_\Lambda {\mathrm{H}}} $, $ ^4_\Lambda H $, $ \overline{^4_\Lambda {\mathrm{H}}} $ with world data and theoretical predictions (represented by solid triangles). Error bars and boxes indicate statistical and systematic uncertainties, respectively. The vertical solid lines with shaded areas represent the average lifetimes of $ ^3_\Lambda {\rm{H}}$ and $ ^4_\Lambda {\rm{H}}$, which were calculated using maximum likelihood methods based on prior results. Gray vertical line indicates the lifetime of a free Λ particle.
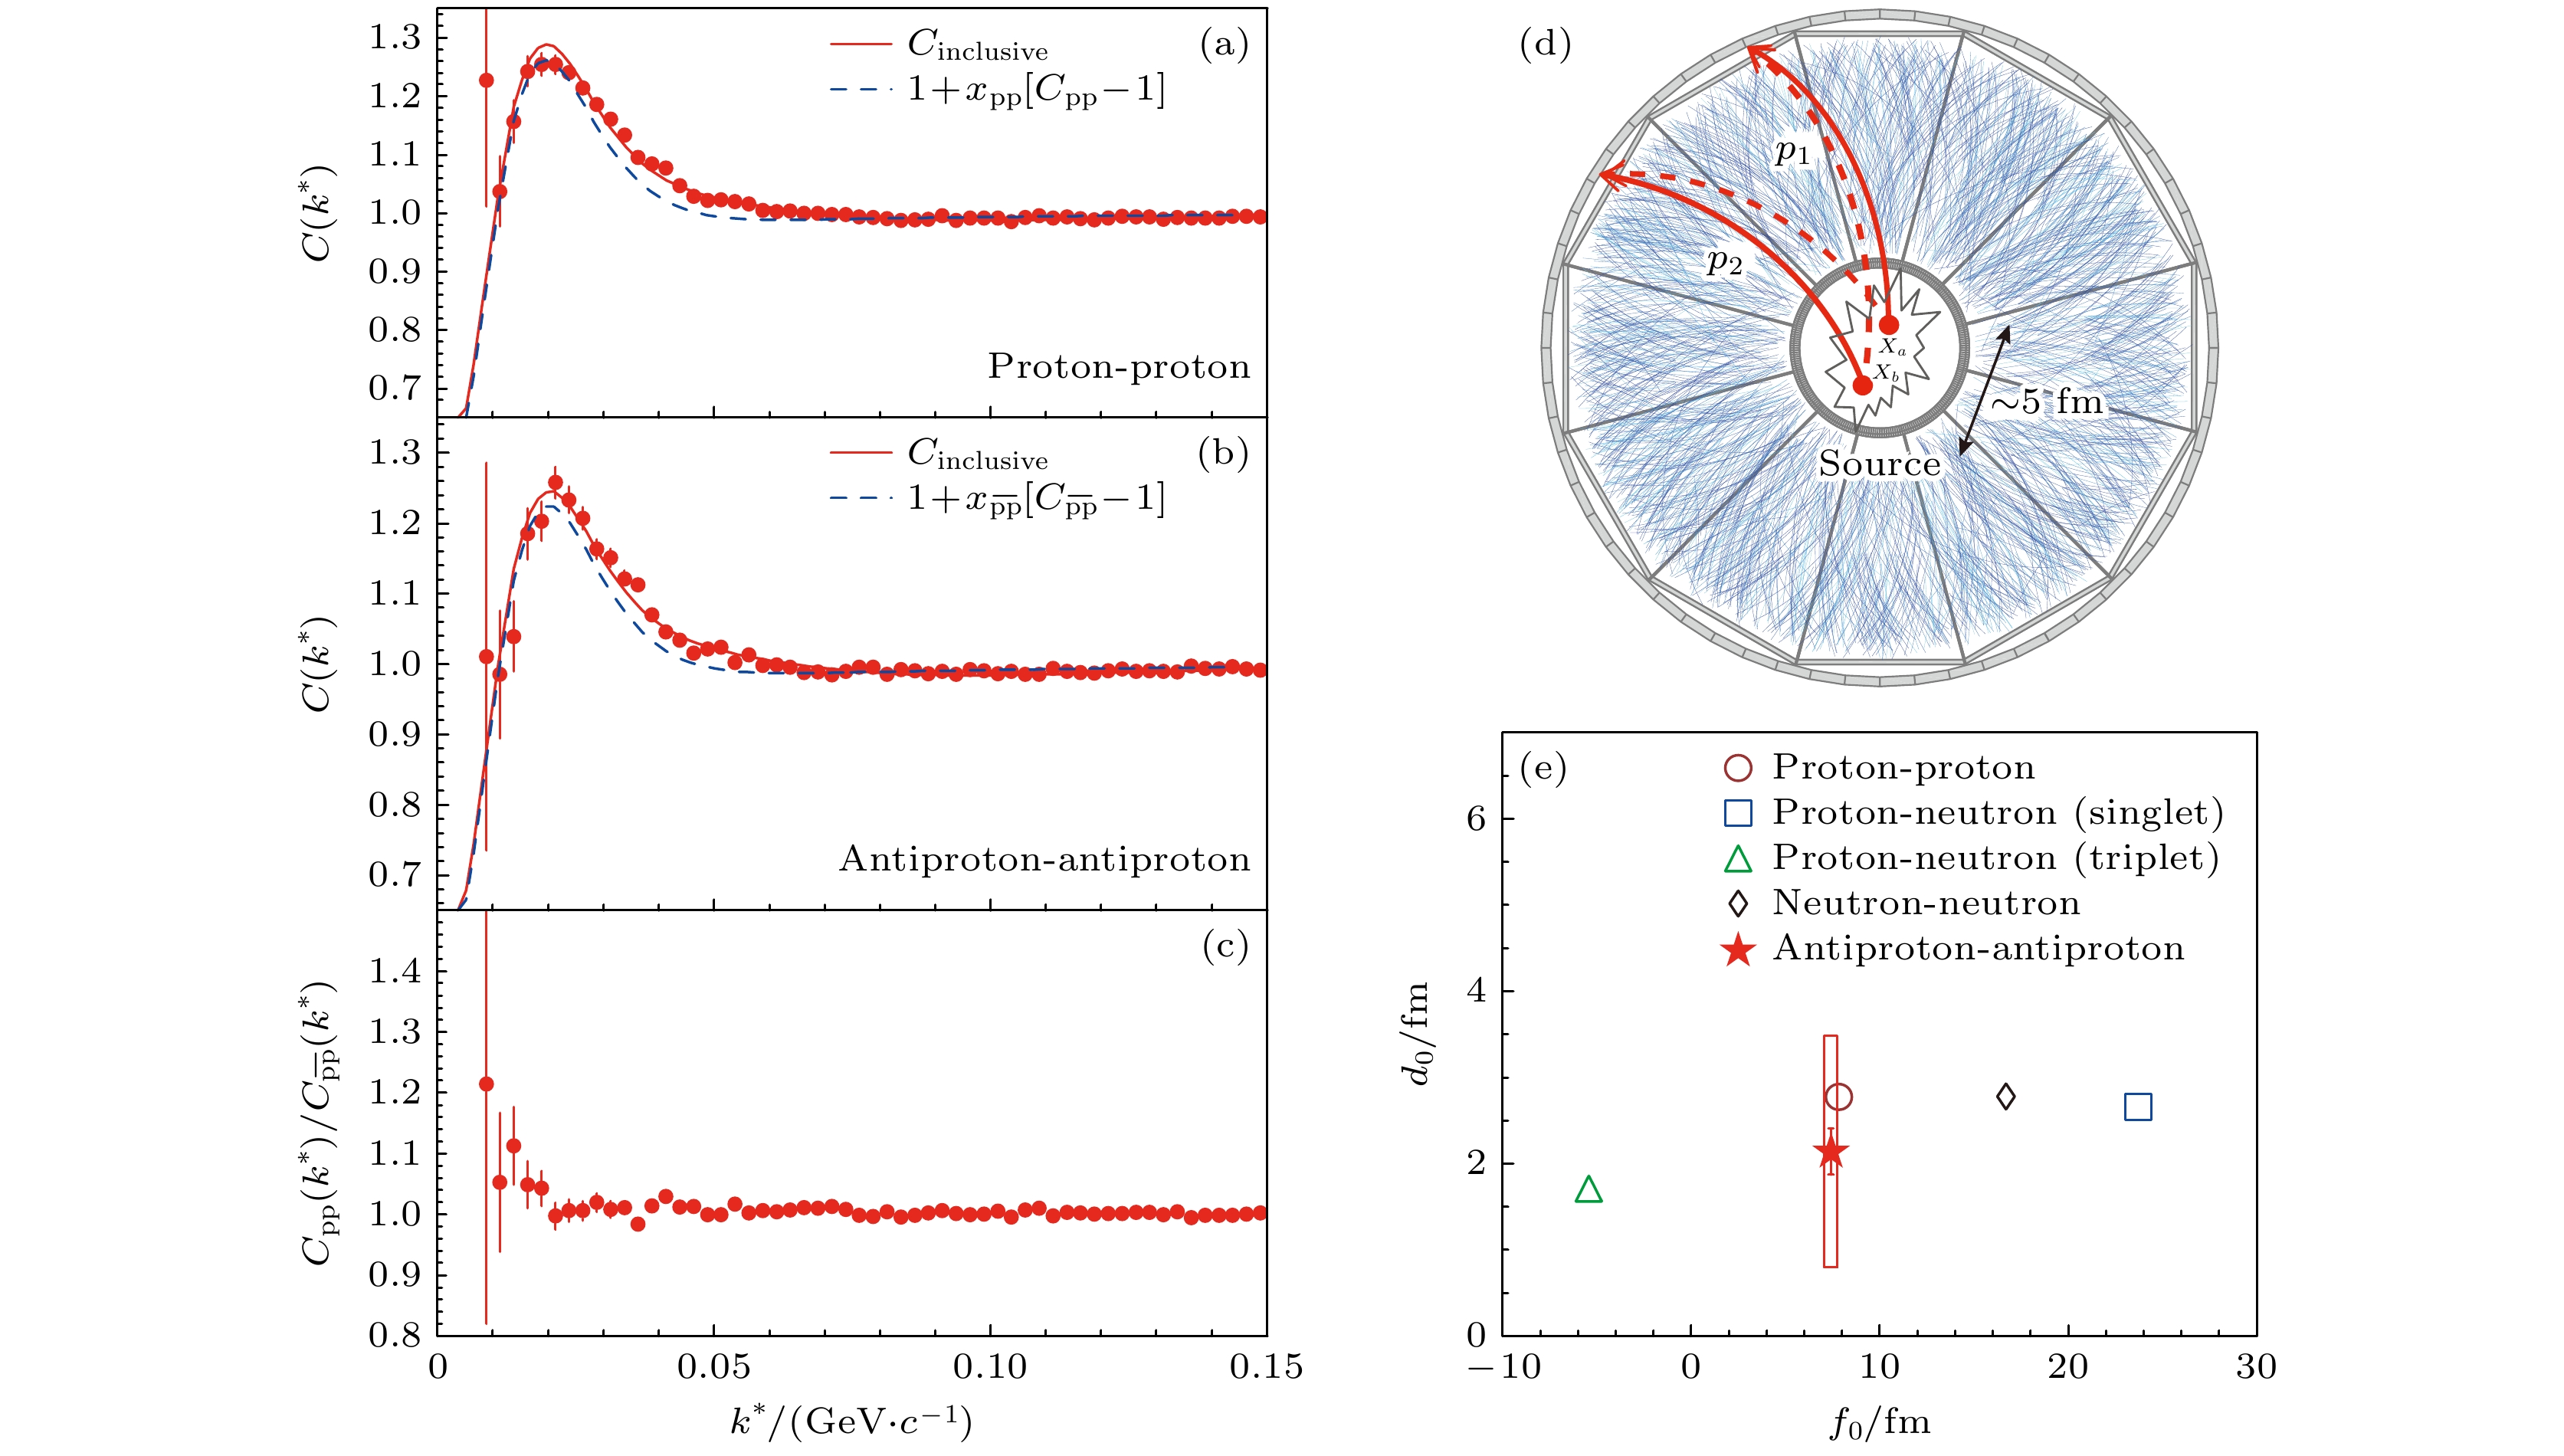
图 6 利用200 GeV/c的金核-金核碰撞数据得到的结果[13] (a), (b) 质子-质子和反质子-反质子的动量关联函数; (c) 图(a), (b)结果的比值分布; (d)测量反质子-反质子动量关联函数的示意图; (e)反质子-反质子相互作用(红星)的S波散射长度($ f_0 $)和有效力程范围($ d_0 $)与其他核子-核子相互作用的S波散射参数的比较. 这里, 统计误差用误差棒表示, 而$ f_0 $的水平不确定性小于符号大小, 系统误差用方框表示. 其他测量的误差为百分之几, 小于符号大小
Figure 6. Results obtained from 200 GeV/c gold-gold collision data: (a), (b) Momentum correlation functions for proton pair and anti-proton pair; (c) their ratio distribution from panels (a), (b); (d) schematic for measuring the momentum correlation function between anti-protons; (e) comparison of the S-wave scattering length ($ f_0 $) and effective range ($ d_0 $) of anti-proton-anti-proton interactions (red star) with the S-wave scattering parameters of other nucleon-nucleon interactions. Here, statistical errors are represented by error bars, while the horizontal uncertainty of $ f_0 $ is smaller than the symbol size, and systematic errors are indicated by boxes. Errors for other measurements are in the few percent range, also smaller than the symbol size.
图 7 (a) TPC探测器中反超氚事例的三体衰变, 中间的中心放大图是TPC内部的重味径迹探测器(HFT)的反超氚事例的三体衰变局部图[14]; (b)原子核与及其反原子核之间的相对质量差别测量[14]. 其中3He和d结果来自于ALICE合作组[52]. 图中水平误差条代表统计误差与系统误差总和. 在横轴0位置处的垂直虚线表示CPT对称性期望值
Figure 7. (a) Three-body decay of anti-hypertriton events in the TPC detector, while the central enlarged view refers to the local depiction of three-body decay events of anti-hypertriton in the Heavy Flavor Tracker (HFT) within the TPC[14]; (b) the relative mass difference between atomic nuclei and their anti-nuclei[14]. Results for 3He and d come from the ALICE collaboration[52]. The horizontal error bars represent the total statistical and systematic uncertainties. The vertical dashed line at the zero position on the horizontal axis indicates the expected value of CPT symmetry.
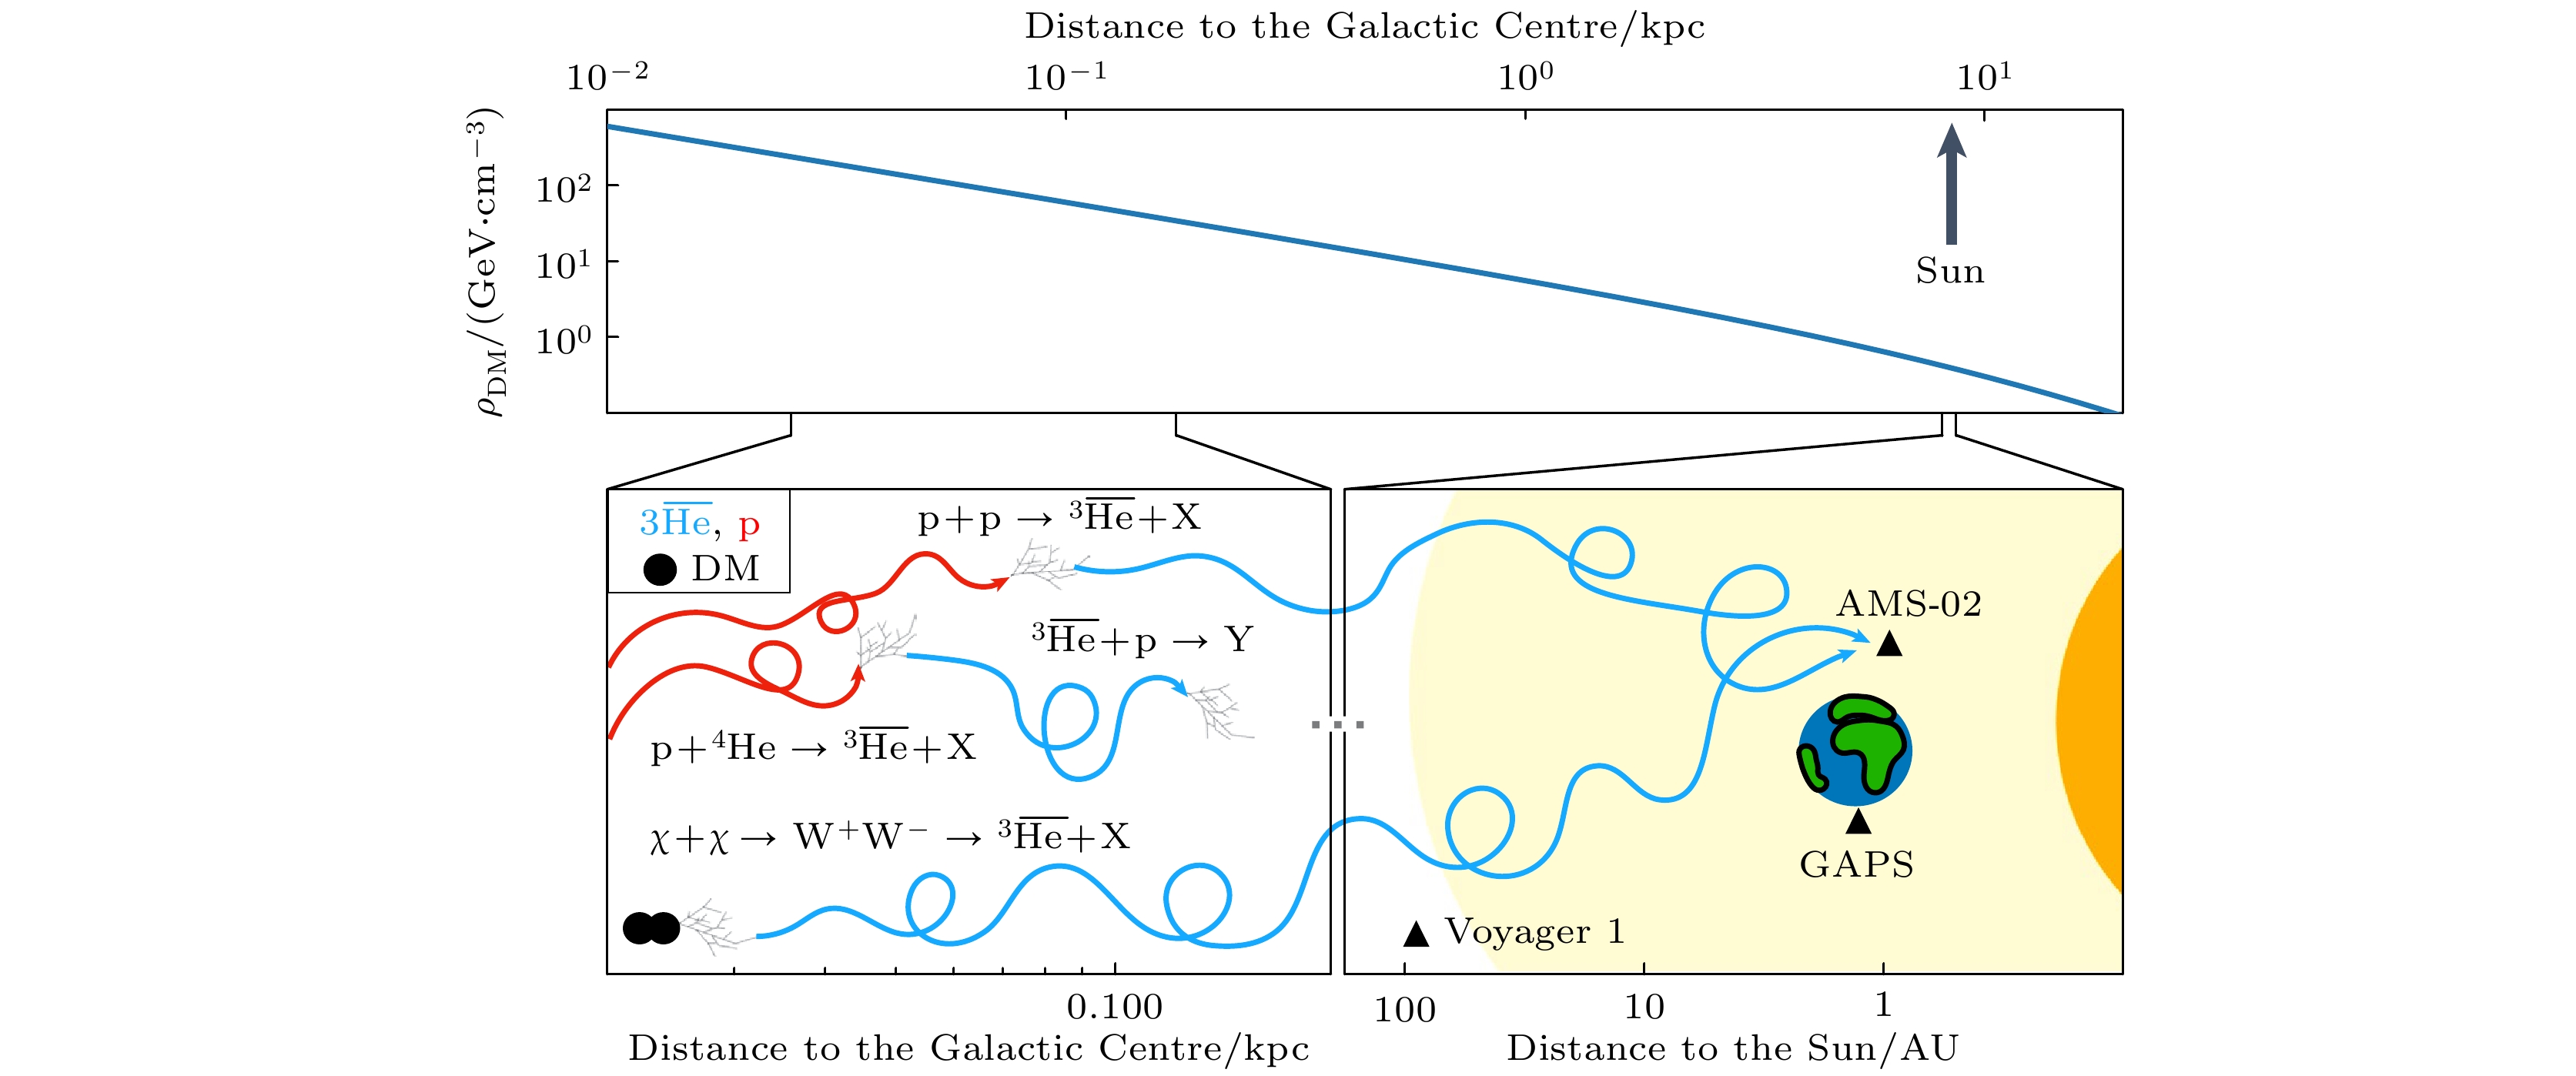
图 9 根据纳瓦罗-弗伦克-怀特剖面图, 银河系中Dark Matter (DM) 密度$ \rho_{{\mathrm{DM}}} $的分布与银河中心距离的函数关系(上图)[56]. 宇宙射线与星际气体或DM(κ)湮灭相互作用产生$ {\overline{3 {\mathrm{He}}}} $的图表说明(下图)[56]. 黄色光环代表日光层, 地球、太阳以及旅行者1号、AMS-02和GAPS实验的位置也被描绘出来
Figure 9. According to the Navarro-Frenk-White profile, the distribution of Dark Matter (DM) density $ \rho_{{\mathrm{DM}}} $ as a function of the distance from the Galactic center is shown in the upper panel[56]. The lower panel illustrates the interaction between cosmic rays and interstellar gas or DM (κ) that produces $ {\overline{3 {\mathrm{He}}}} $[56]. The yellow halo represents the heliosphere, and the positions of Earth, the Sun, Voyager 1, AMS-02, and GAPS experiments are also depicted.
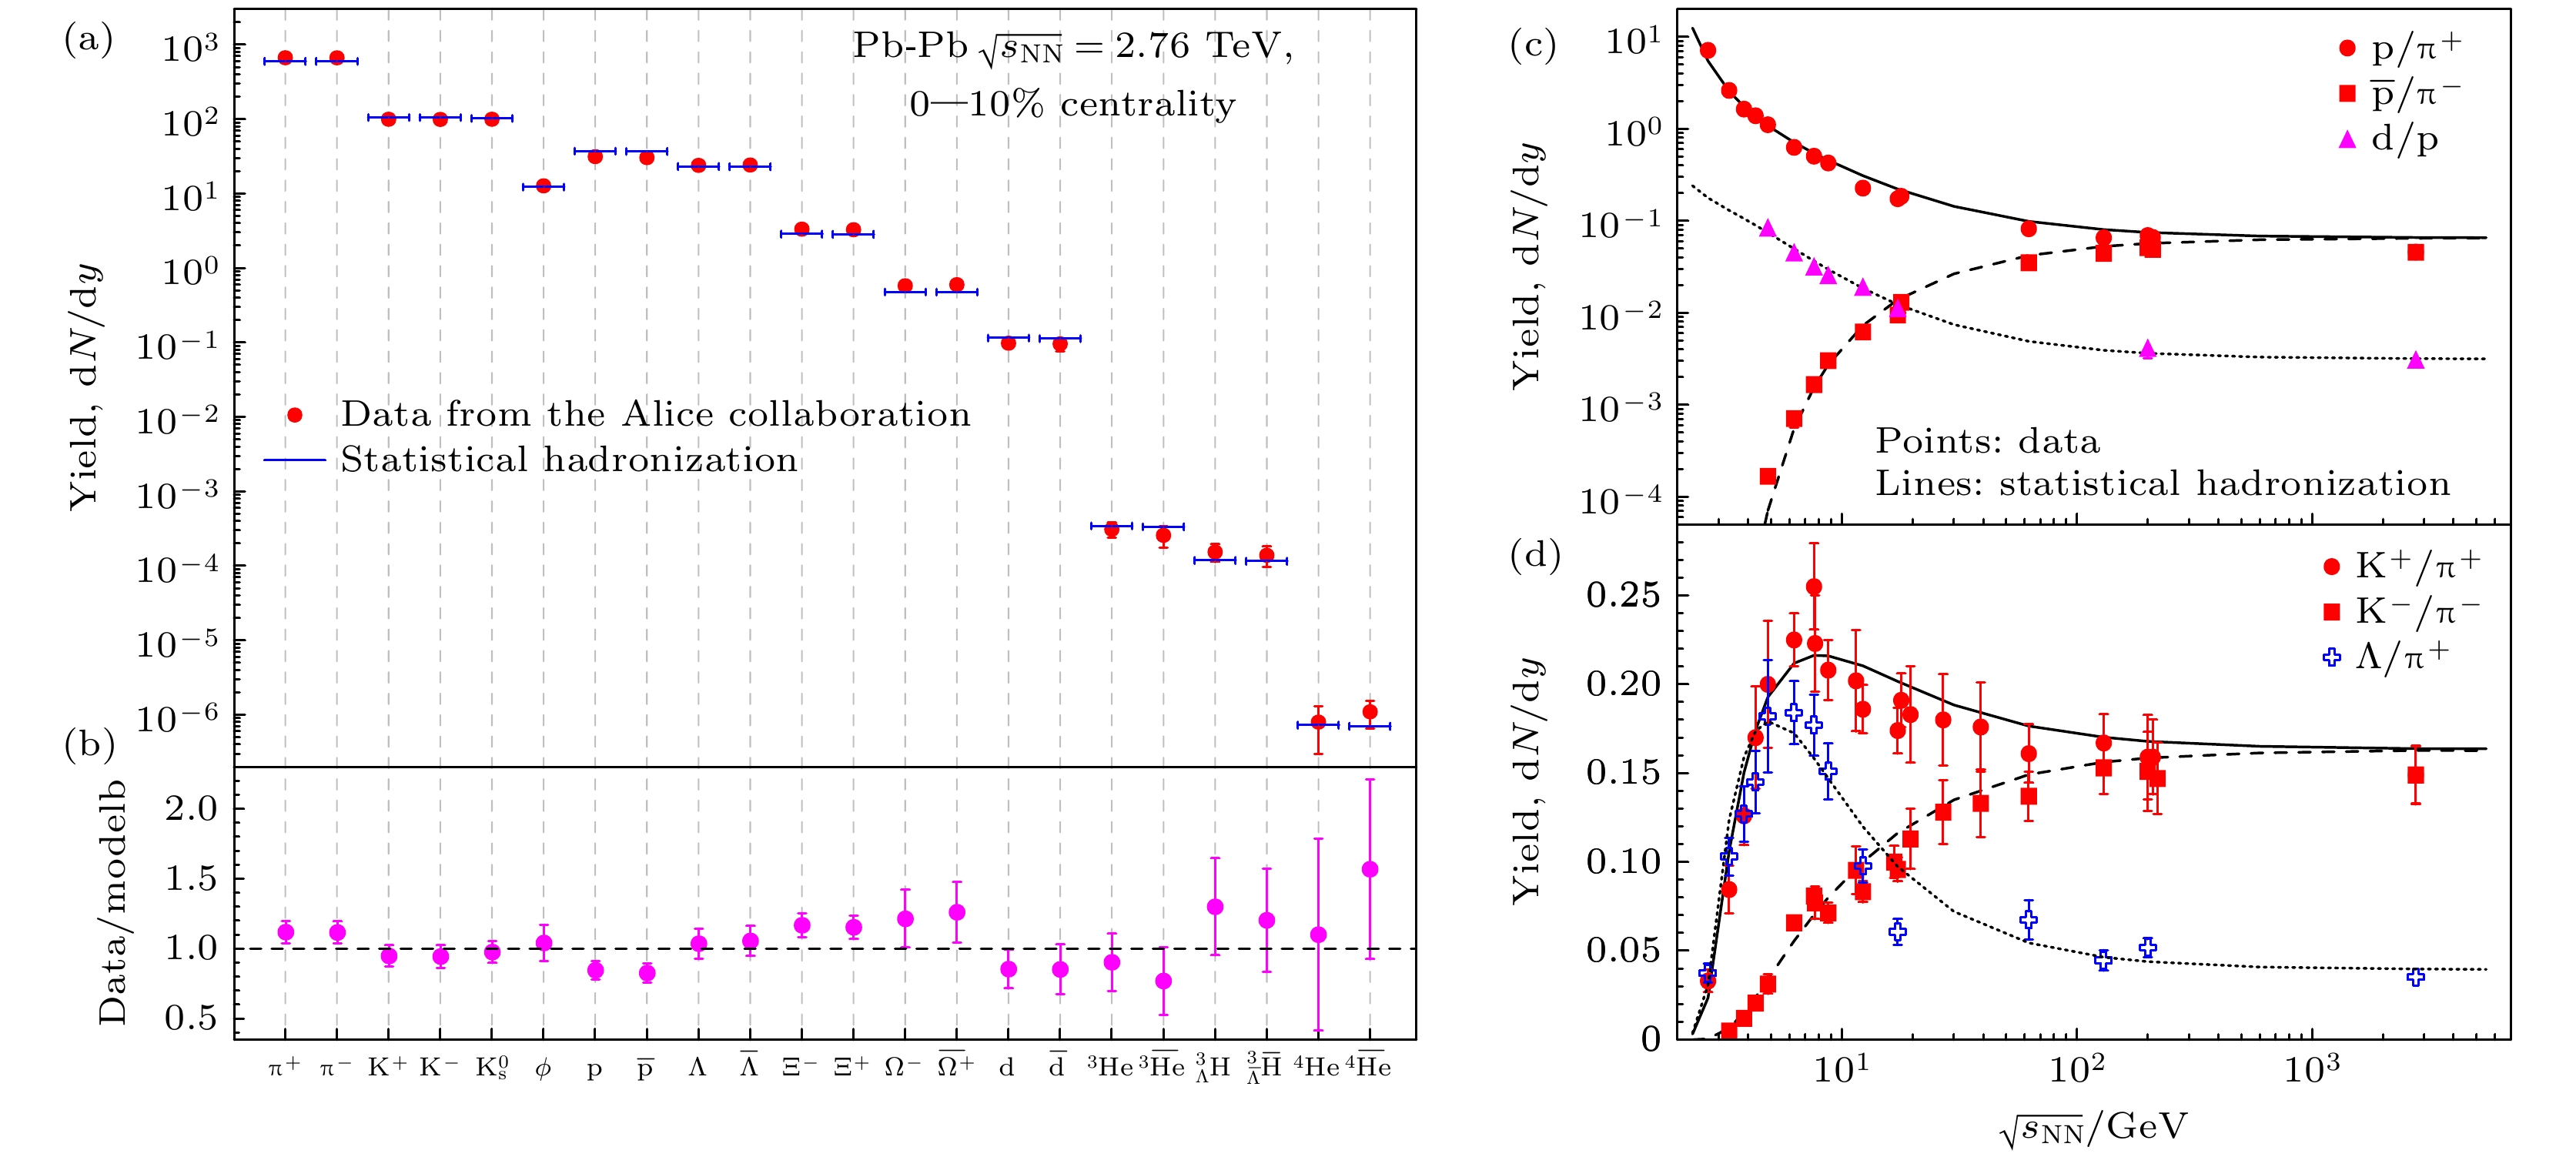
图 10 (a), (b)强子丰度和统计强子化模型的预测值[62] (a)不同强子和原子核的中快度的dN/dy值(红圈), 包括超氚核, 与统计强子化分析(蓝条)进行比较; (b)数据与统计强子化模型预测之比, 误差条仅根据数据确定, 为统计和系统不确定性的和. (c), (d)若干强子种类相对丰度的碰撞能量依赖性. 中心对撞的数据与统计强子化计算结果进行了比较[62]
Figure 10. (a), (b) Hadron abundances and predictions from the statistical hadronization model[62]: (a) The dN/dy values (red circles) for different hadrons and nuclei at mid-rapidity, including hypertritons, compared with the statistical hadronization analysis (blue bars); (b) the ratio of data to the predictions of the statistical hadronization model, with error bars determined solely from the data, representing the sum of statistical and systematic uncertainties. (c), (d) Collision energy dependence of the relative abundances of several hadron species. Data from central collisions are compared with the results of statistical hadronization calculations[62].
图 11 (a)利用Blast Wave模型与并合模型计算得到的11.5 GeV/c和200 GeV/c金-金碰撞产生的原子核不变产率与重子数B的函数关系[76]. 所用的区间是平均横动量区$ p_{\mathrm{T}} /|B|= 0.875 {\mathrm{GeV}}/c.$ 实心点是根据并合模型计算的结果, 不同的线代表并合模型与STAR实验[12]数据的拟合. (b)在2.76 TeV的Pb + Pb对撞中, dN/dy与重子数 (A) 的指数衰变关系[77]. 基本上有两类生产链, 即第一类: N→d→t ($ ^3_\Lambda {\rm{H}}$) (红色), $\Omega $→ N$\Omega $ → NN$\Omega $ (蓝色), $\Omega\Omega $ → N$\Omega\Omega $ (粉红色); 以及第二类: N → N$\Omega $ → N$\Omega\Omega $ (绿色), $\Omega $ → $\Omega\Omega $(棕色)和d → N$\Omega $N → NN$\Omega\Omega $ (浅绿色)链. 这些线条显示了dN/dy ≈ exp(–bA) 的关系, 其中第一类的b = 5.78(红色)、5.68(蓝色)和4.70(粉红色), 以及11.1(绿色)、13.3(棕色)和10.7(浅绿色)
Figure 11. (a) Invariant yield of nuclei produced in Au-Au collisions at 11.5 GeV/c and 200 GeV/c as a function of baryon number B, calculated using the Blast Wave model and coalescence model[76]. The interval used is the average transverse momentum range $ p_{\mathrm{T}}/|B| = 0.875 {\mathrm{GeV}}/c $. The solid points represent our results based on the coalescence model, while different lines indicate the fits of the coalescence model to data from the STAR experiment[12]. (b) In the 2.76 TeV Pb + Pb collisions, the relationship between dN/dy and baryon number A exhibits an exponential decay[77]. There are essentially two types of production chains: the first type includes N→d→t ($ ^3_\Lambda {\rm{H}}$) (red), $\Omega $→ N$\Omega $ → NN$\Omega $ (blue), $\Omega\Omega $ → N$\Omega\Omega $ (pink), while the second type includes N → N$\Omega $ → N$\Omega\Omega $ (green)、$\Omega $ → $\Omega\Omega $(brown) and d → N$\Omega $N → NN$\Omega\Omega $ (light green) chains. These lines illustrate the relationship dN/dy ≈ exp(–bA), where the values of b for the first type are 5.78 (red), 5.68 (blue), and 4.70 (pink), and for the second type are 11.1 (green), 13.3 (brown), and 10.7 (light green).
图 12 RHIC能量下$ {\rm{Au}}+{\rm{Au}}$对撞中的氘核和氚产生图[80]. 强子再散射效应对轻核产额比率(a) $ {{N}}_{\mathrm{d}}/{{N}}_{\mathrm{p}} $, (b) $ N_{{^3}{\mathrm{H}}}/N_{\mathrm{p}} $和(c) $ N_{{{^3}{\mathrm{H}}}} \times $$ N_{\mathrm{p}}/N^2_{\mathrm{d}} $ 的碰撞能量依赖性. 包含和不包含强子运动学的理论结果分别来自Hydro + RKE (阴影带)和SHM (线条). 带有统计和系统综合不确定性的实验数据点来自STAR合作组
Figure 12. Production of deuterons and tritons in $ {\rm{Au}}+{\rm{Au}}$ collisions at RHIC energies[80]. The collision energy dependence of the light nucleus yield ratios (a) $ N_{\mathrm{d}}/N_{\mathrm{p}} $, (b) $ N_{{^3}{\mathrm{H}}}/N_{\mathrm{p}} $ and (c) $ N_{{^3}{\mathrm{H}}} \times N_{\mathrm{p}}/N^2_{\mathrm{d}} $ is shown. Theoretical results including and excluding hadronic kinematics are derived from Hydro + RKE (shaded band) and SHM (lines), respectively. The experimental data points, which include statistical and systematic uncertainties, are sourced from the STAR collaboration.
图 13 ALPHA中央装置和混合势能[83] (a) ALPHA设备的反氢合成和捕集区域. 图中显示了原子阱磁铁、模块化湮灭探测器和部分潘宁阱电极. 一个外部螺线管(未显示)为潘宁阱提供1 T磁场. 图未按比例绘制. 潘宁阱电极的内径为44.5 mm, 最小磁场阱的有效长度为274 mm. 每个硅模块都是一个双面、分段式硅晶片, z方向的条带间距为0.9 mm, w方向的条带间距为0.23 mm. (b) 用于混合正电子和反质子的巢状阱势. 蓝色阴影表示正电子云的近似空间电荷势. z位置是相对于原子阱中心测量的
Figure 13. Central apparatus and hybrid potential energy of ALPHA[83]: (a) Antihydrogen synthesis and trapping region of the ALPHA apparatus. The image shows the atomic trap magnet, modular annihilation detectors, and partial Penning trap electrodes. An external solenoid (not shown) provides a 1 T magnetic field for the Penning trap. The diagram is not to scale. The inner diameter of the Penning trap electrodes is 44.5 mm, and the effective length of the minimum magnetic field trap is 274 mm. Each silicon module is a double-sided, segmented silicon wafer, with strip spacing of 0.9 mm in the z direction and 0.23 mm in the w direction. (b) The nested trap potential used for mixing positrons and antiprotons. The blue shading represents the approximate space charge potential of the positron cloud. The z position is measured relative to the center of the atomic trap.
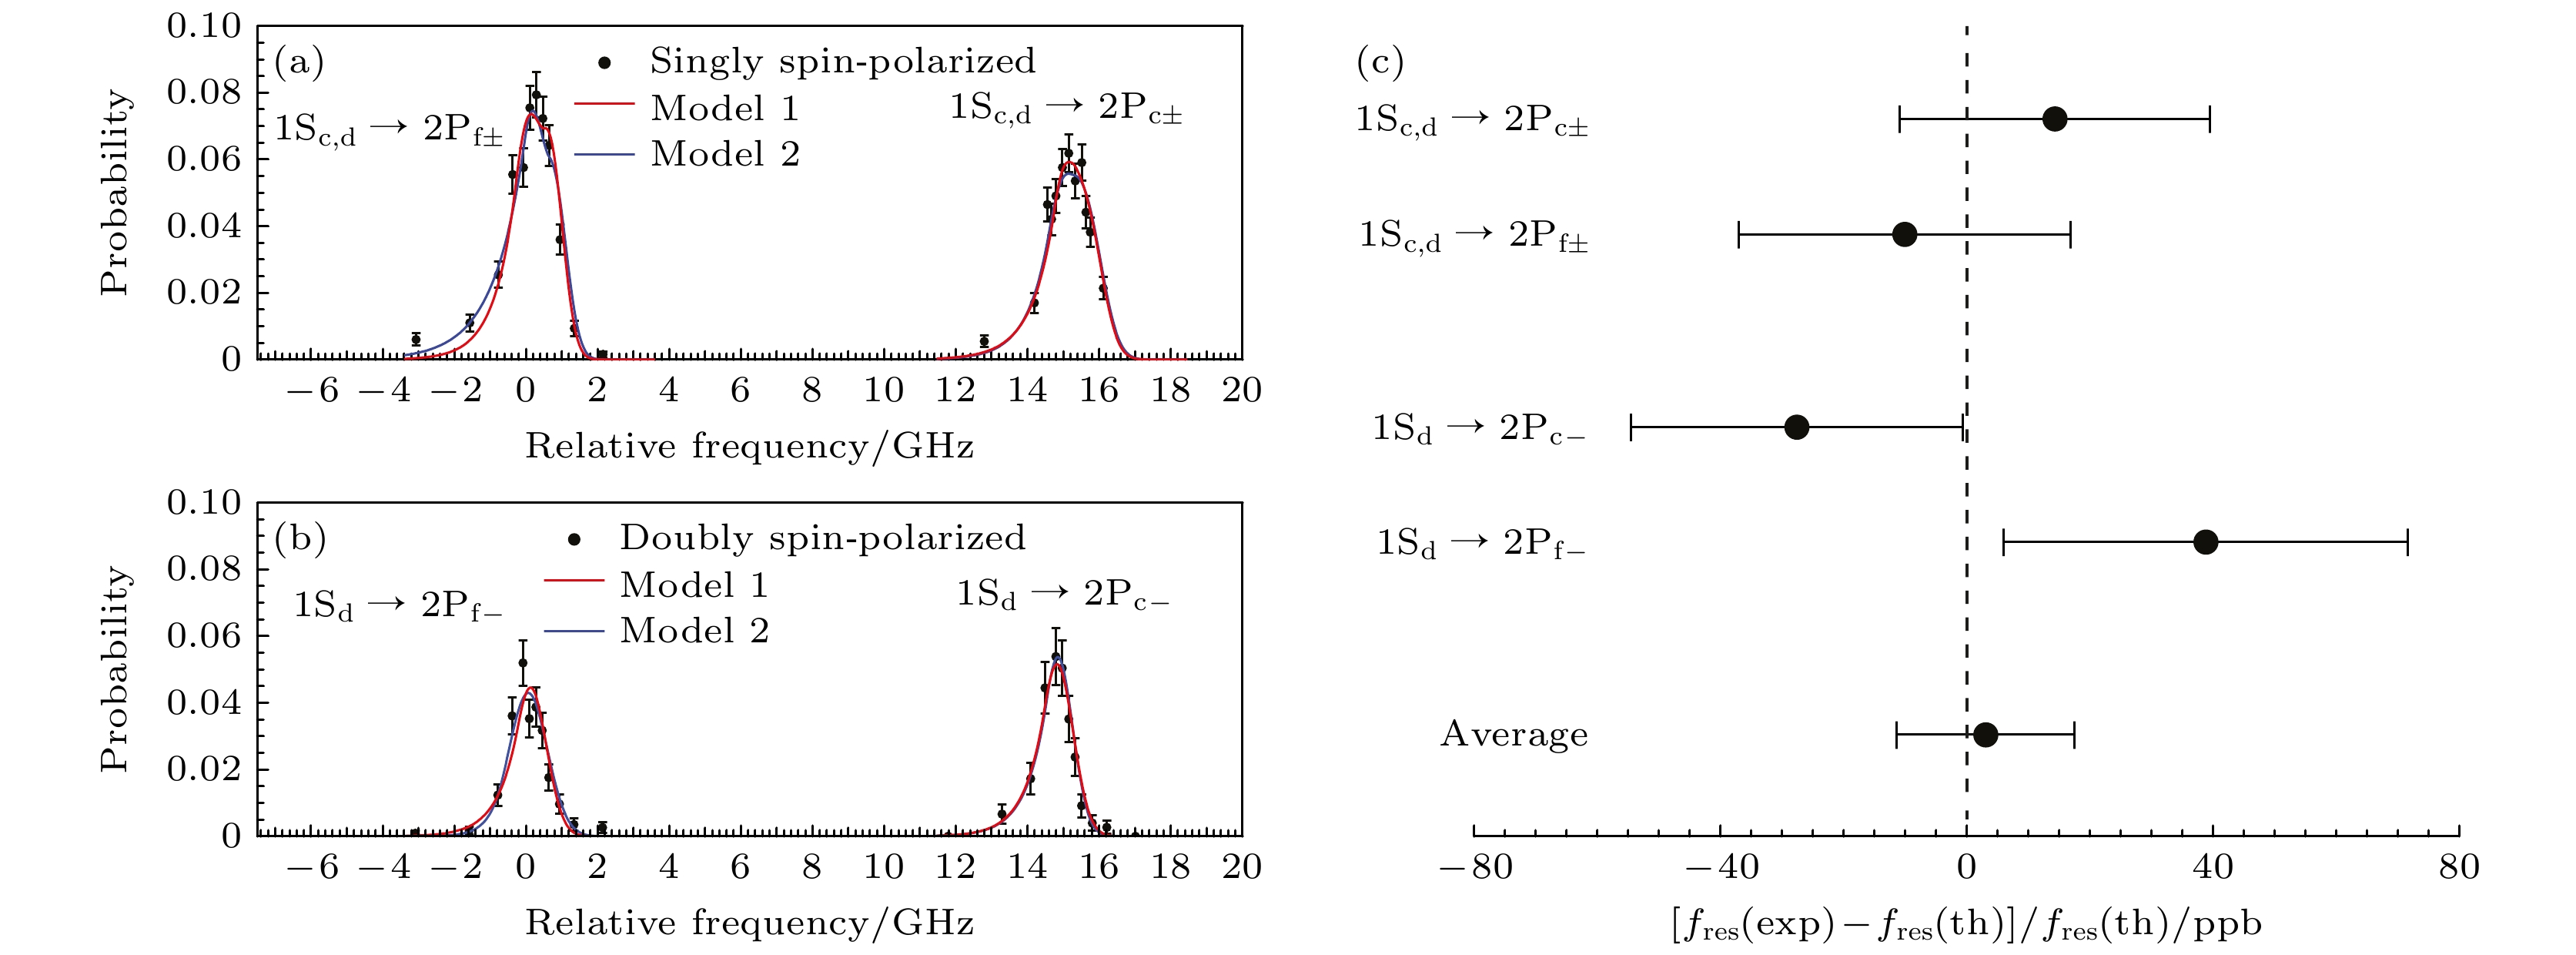
图 14 (a)单自旋极化和(b)双自旋极化反氢样品的实验数据(填充圆圈)和拟合线形[92]. 数据点是在激光脉冲能量为0.5 nJ时从检测到的自旋翻转事件中获得的, 并归一化为被捕获的反氢原子总数. 误差带为1σ计数不确定性. 频率偏移2, 466, 036.3 GHz. 红色拟合曲线是通过标准拟合程序(模型1)得到的, 蓝色曲线是通过另一个拟合模型(模型2)得到的. (c)反氢$ f_{{\mathrm{res}}} $(exp)中1S-2P转变的实验测量频率与氢$ f_{{\mathrm{res}}} $(th) 的理论预期频率进行了比较. 所有四次测量结果都与氢一致, 它们的平均值给出了在十亿分之1时对CPT不变性的测试. 误差带为1σ, 平均误差带的计算考虑了其他相关的误差[92]
Figure 14. Experimental data (filled circles) and fitted lines for (a) single-spin polarized and (b) double-spin polarized antihydrogen samples[92]. Data points were obtained from detected spin-flip events at a laser pulse energy of 0.5 nJ, normalized to the total number of trapped antihydrogen atoms. Error bands represent 1σ counting uncertainty. The frequency offset is 2, 466, 036.3 GHz. The red fitted curve is obtained using a standard fitting procedure (Model 1), while the blue curve is derived from another fitting model (Model 2). (c) Experimental measured frequency of the 1S-2P transition in antihydrogen $ f_{{\mathrm{res}}} $(exp)is compared with the theoretical expected frequency for hydrogen $ f_{{\mathrm{res}}} $(th). All four measurements are consistent with hydrogen, and their average provides a test of CPT invariance at the level of one billionth. Error bands represent 1σ, and the average error band calculation takes into account other related uncertainties[92].
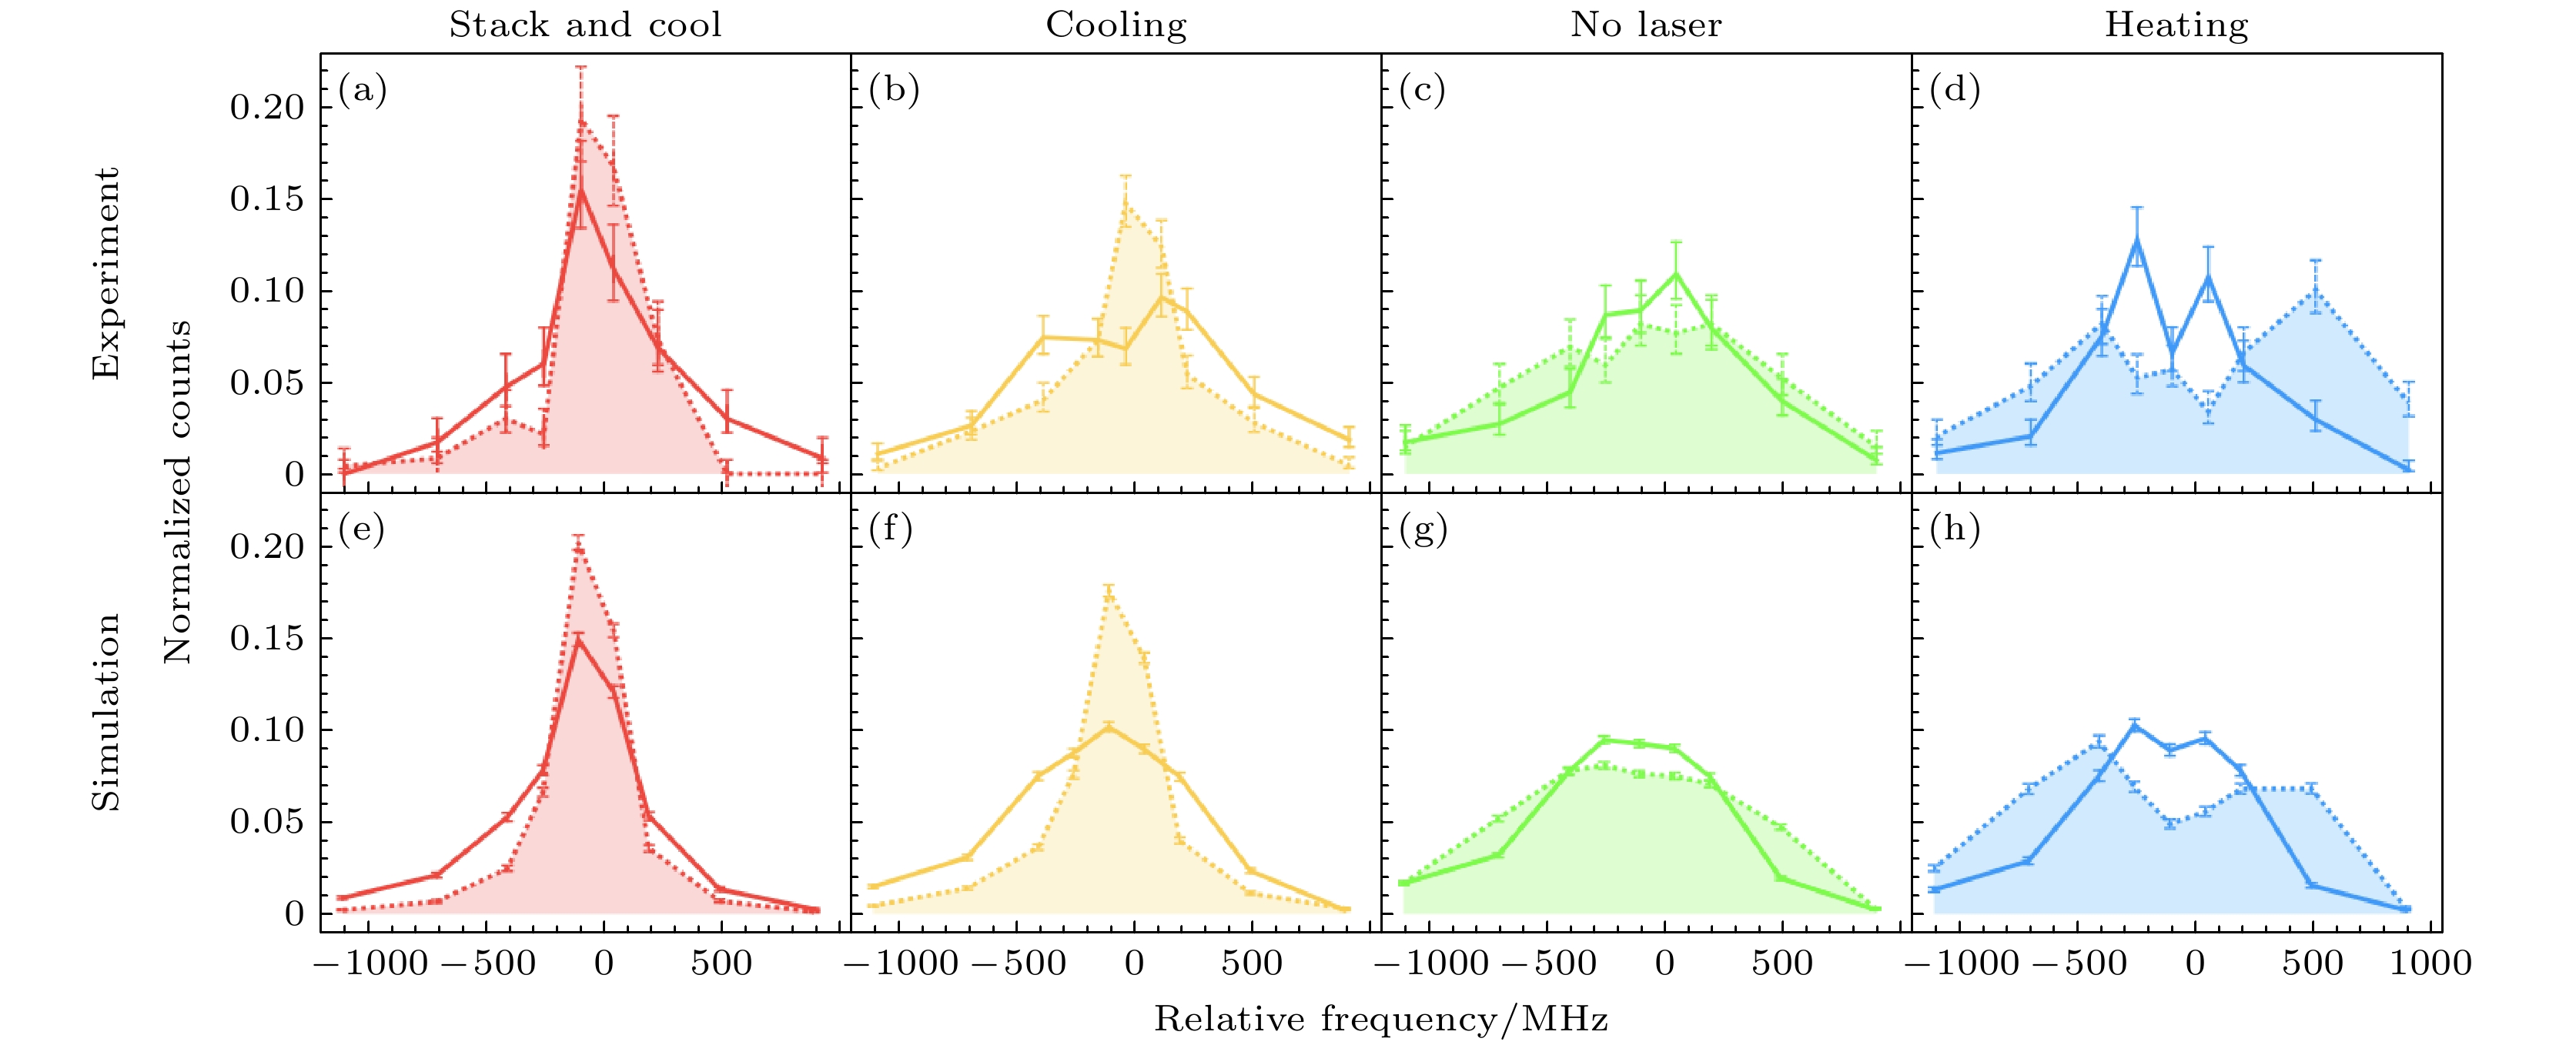
图 15 冷却实验中同一系列中横向冷反质子和热反质子光谱线形的比较[93] (a) “堆叠和冷却”系列数据中同等大小子样本之间光谱线形的比较, 横向能量大于(小于)中值的子样本的线型用实线表示(虚线填充在曲线下); (b)冷却、(c)无激光和(d)加热系列的类似比较, 以及(e)—(h)相应的模拟. 在所有情况下, 连线是为了引导视线. 在图(a), (b)激光冷却系列中, 横向较冷的原子纵向也较冷, 而图(d)加热系列的相关性则相反
Figure 15. Comparison of spectral line shapes of transversely cooled antiprotons and thermally excited antiprotons in the same series of cooling experiments[93]: (a) Comparison of spectral line shapes between equally sized subsamples in the “stacking and cooling” series data. The line shapes for subsamples with transverse energies greater than (less than) the median are represented by solid (dashed, filled under the curve) lines. (b)–(h) Similar comparisons for the (b) cooling, (c) no laser, and (d) heating series, along with (e)–(h) corresponding simulations. In all cases, the connecting lines are intended to guide the eye. In the laser cooling series as shown in panels (a) and (b), transversely cooler atoms are also longitudinally cooler, while the correlation is reversed in the heating series and shown in panel (d).
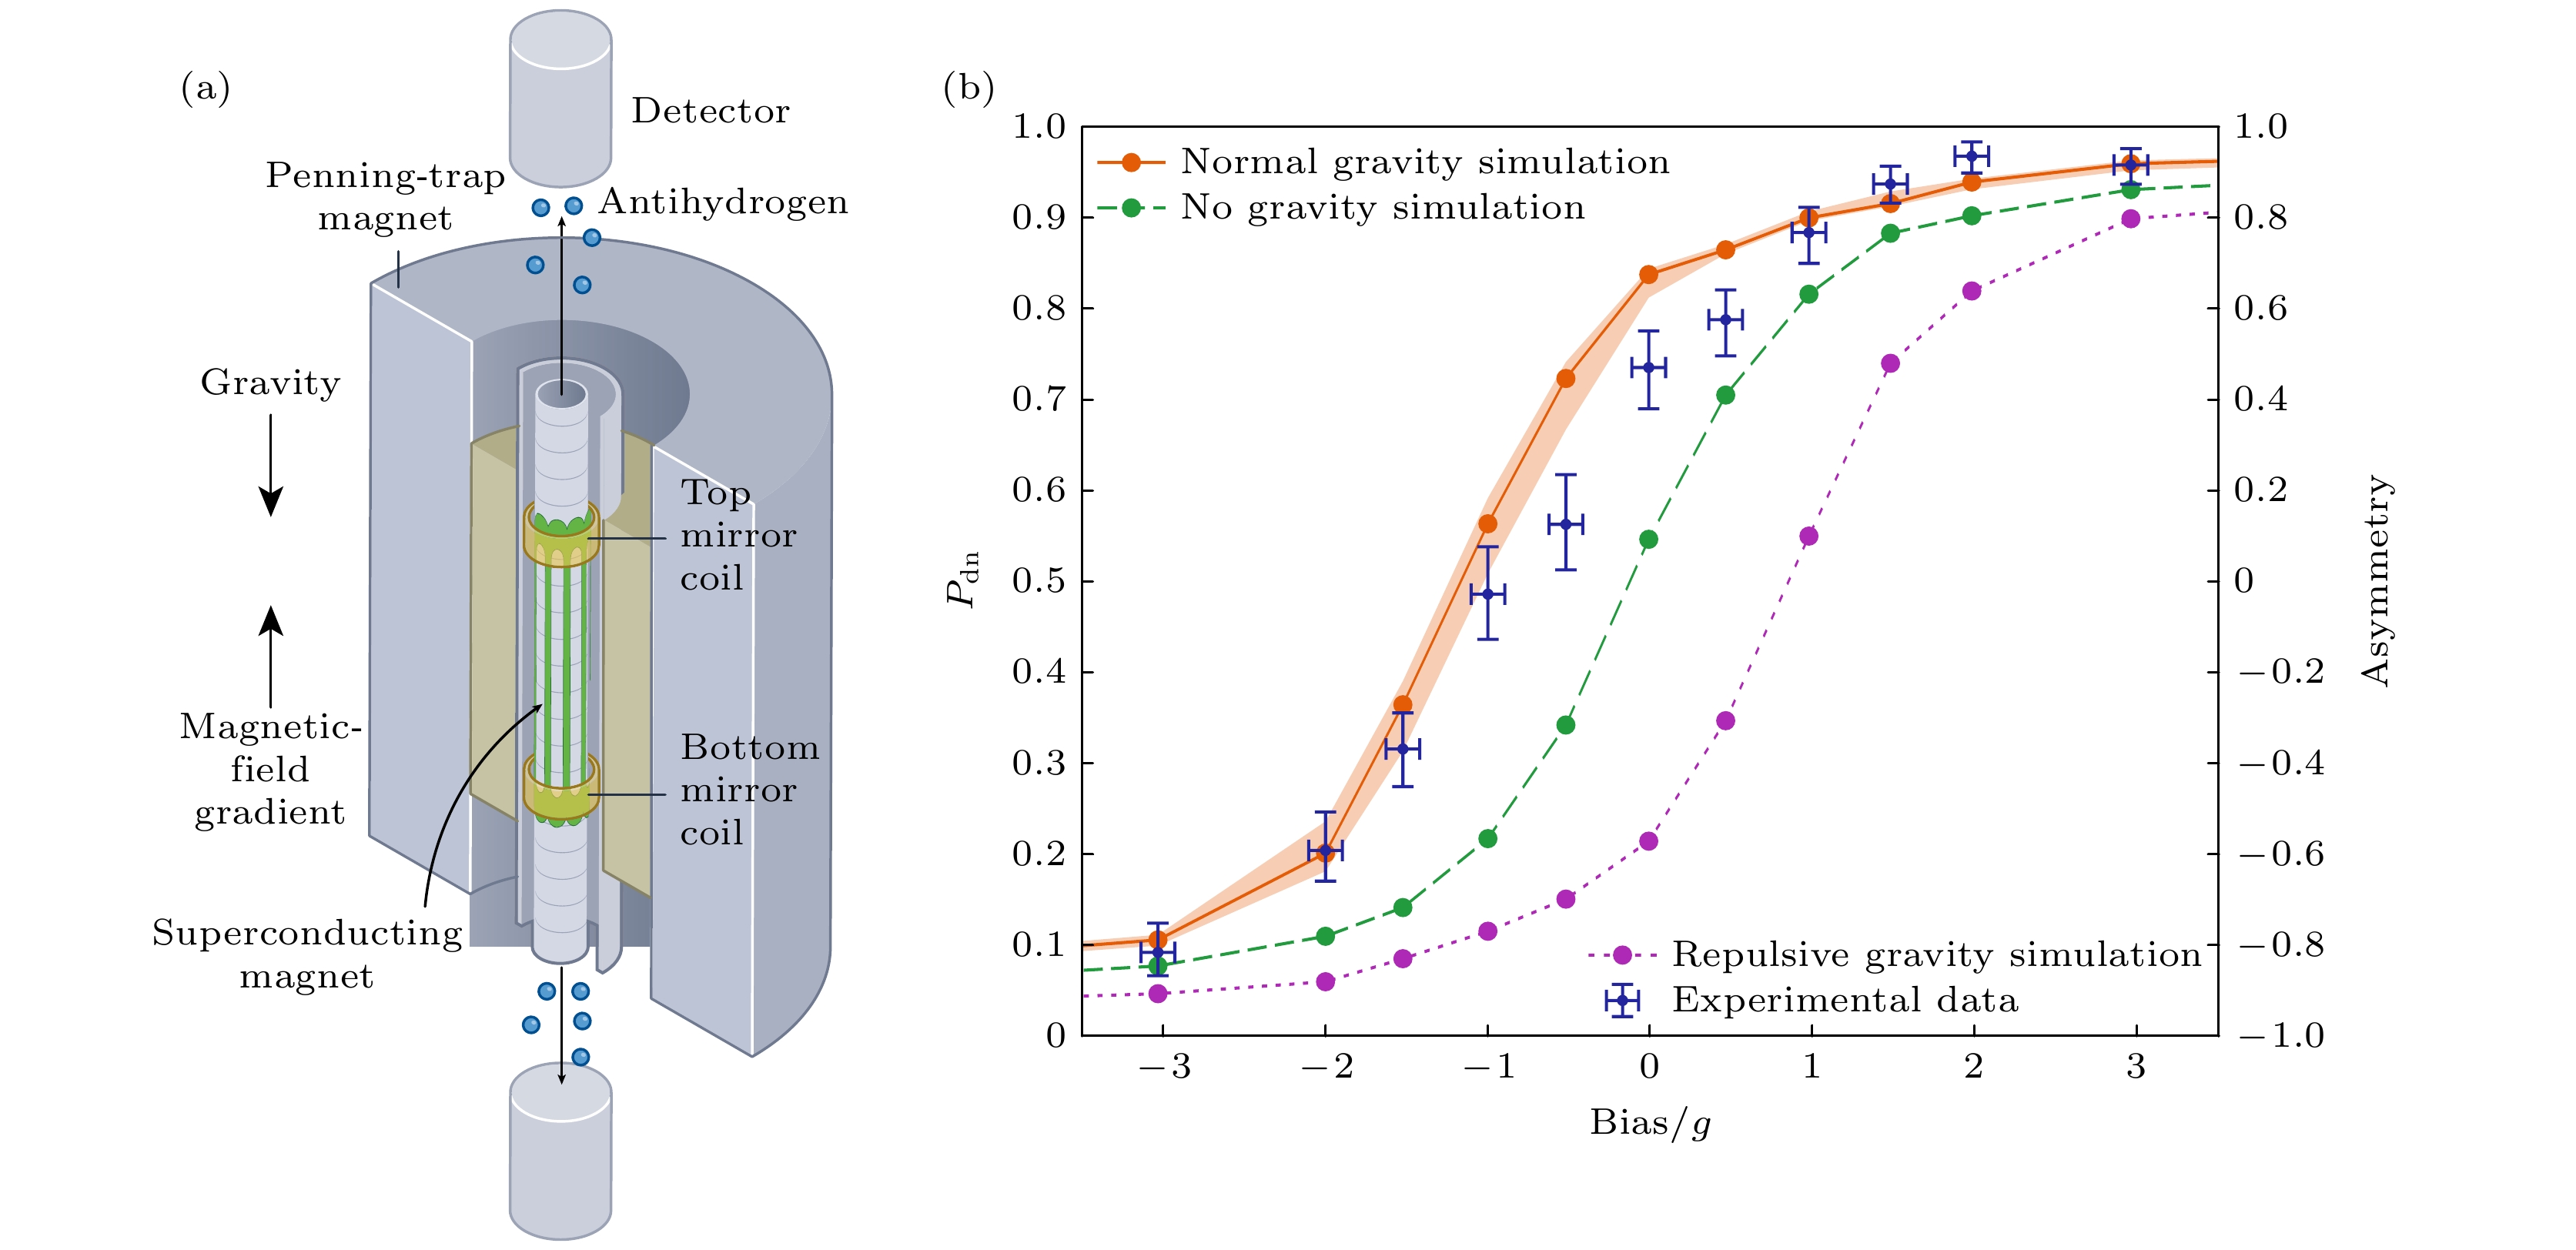
图 16 反氢原子的重力测试实验 (a) 示意图. ALPHA合作组首先在潘宁阱的装置中操纵形成反氢原子, 它被困在一个由超导磁体和两个称为镜像线圈的电磁铁产生的磁场中. 在两个镜像线圈上施加电压以模拟重力效应的磁场梯度. 然后, 释放反氢原子, 并在仪器壁上检测到它们. 当磁场梯度与重力加速度平衡时, 在顶部和底部的壁上会发现相似数量的原子, 这表明反氢原子受到与氢原子相同的引力作用[94]. (b)实验数据和模拟实验得出的反氢原子向下逃逸的概率$ P_{{\mathrm{dn}}} $值与偏差的关系图[95]. 图中显示了三种重力加速度$ a_{\mathrm{g }}$值: 1 g (正重力, 橙色)、0 g (无重力, 绿色)和–1 g (斥重力, 紫色). 右侧纵坐标为反粒子往上往下不对称A = 2$ P_{{\mathrm{dn}}} - 1$. 无引力和斥引力模拟的置信区间与正常引力模拟的置信区间相当, 为清晰起见这类未画出
Figure 16. Gravity test experiment of antihydrogen atoms: (a) Schematic diagram. The ALPHA collaboration first manipulates the formation of antihydrogen atoms in a Penning trap apparatus, where they are confined in a magnetic field generated by superconducting magnets and two electromagnetic coils known as mirror coils. Voltage is applied to the two mirror coils to simulate the magnetic field gradient of the gravitational effect. Antihydrogen atoms are then released and detected on the walls of the apparatus. When the magnetic field gradient balances with the gravitational acceleration, a similar number of atoms will be found on both the top and bottom walls, indicating that antihydrogen atoms experience gravitational effects similar to those of hydrogen atoms[94]. (b) Relationship between the experimental data and the probability $ P_{{\mathrm{dn}}} $ of antihydrogen atoms escaping downwards, derived from simulated experiments, as a function of deviation[95]. Graph displays three values of gravitational acceleration $ a_{\mathrm{g}} $: 1 g (normal gravity, orange), 0 g (zero gravity, green), and –1 g (repulsive gravity, purple). The right vertical axis represents the asymmetry of antiparticles moving upwards and downwards, A = 2$ P_{{\mathrm{dn}}}-1 $. The confidence intervals for the zero gravity and repulsive gravity simulations are comparable to those for normal gravity simulations, although these are not depicted for clarity.
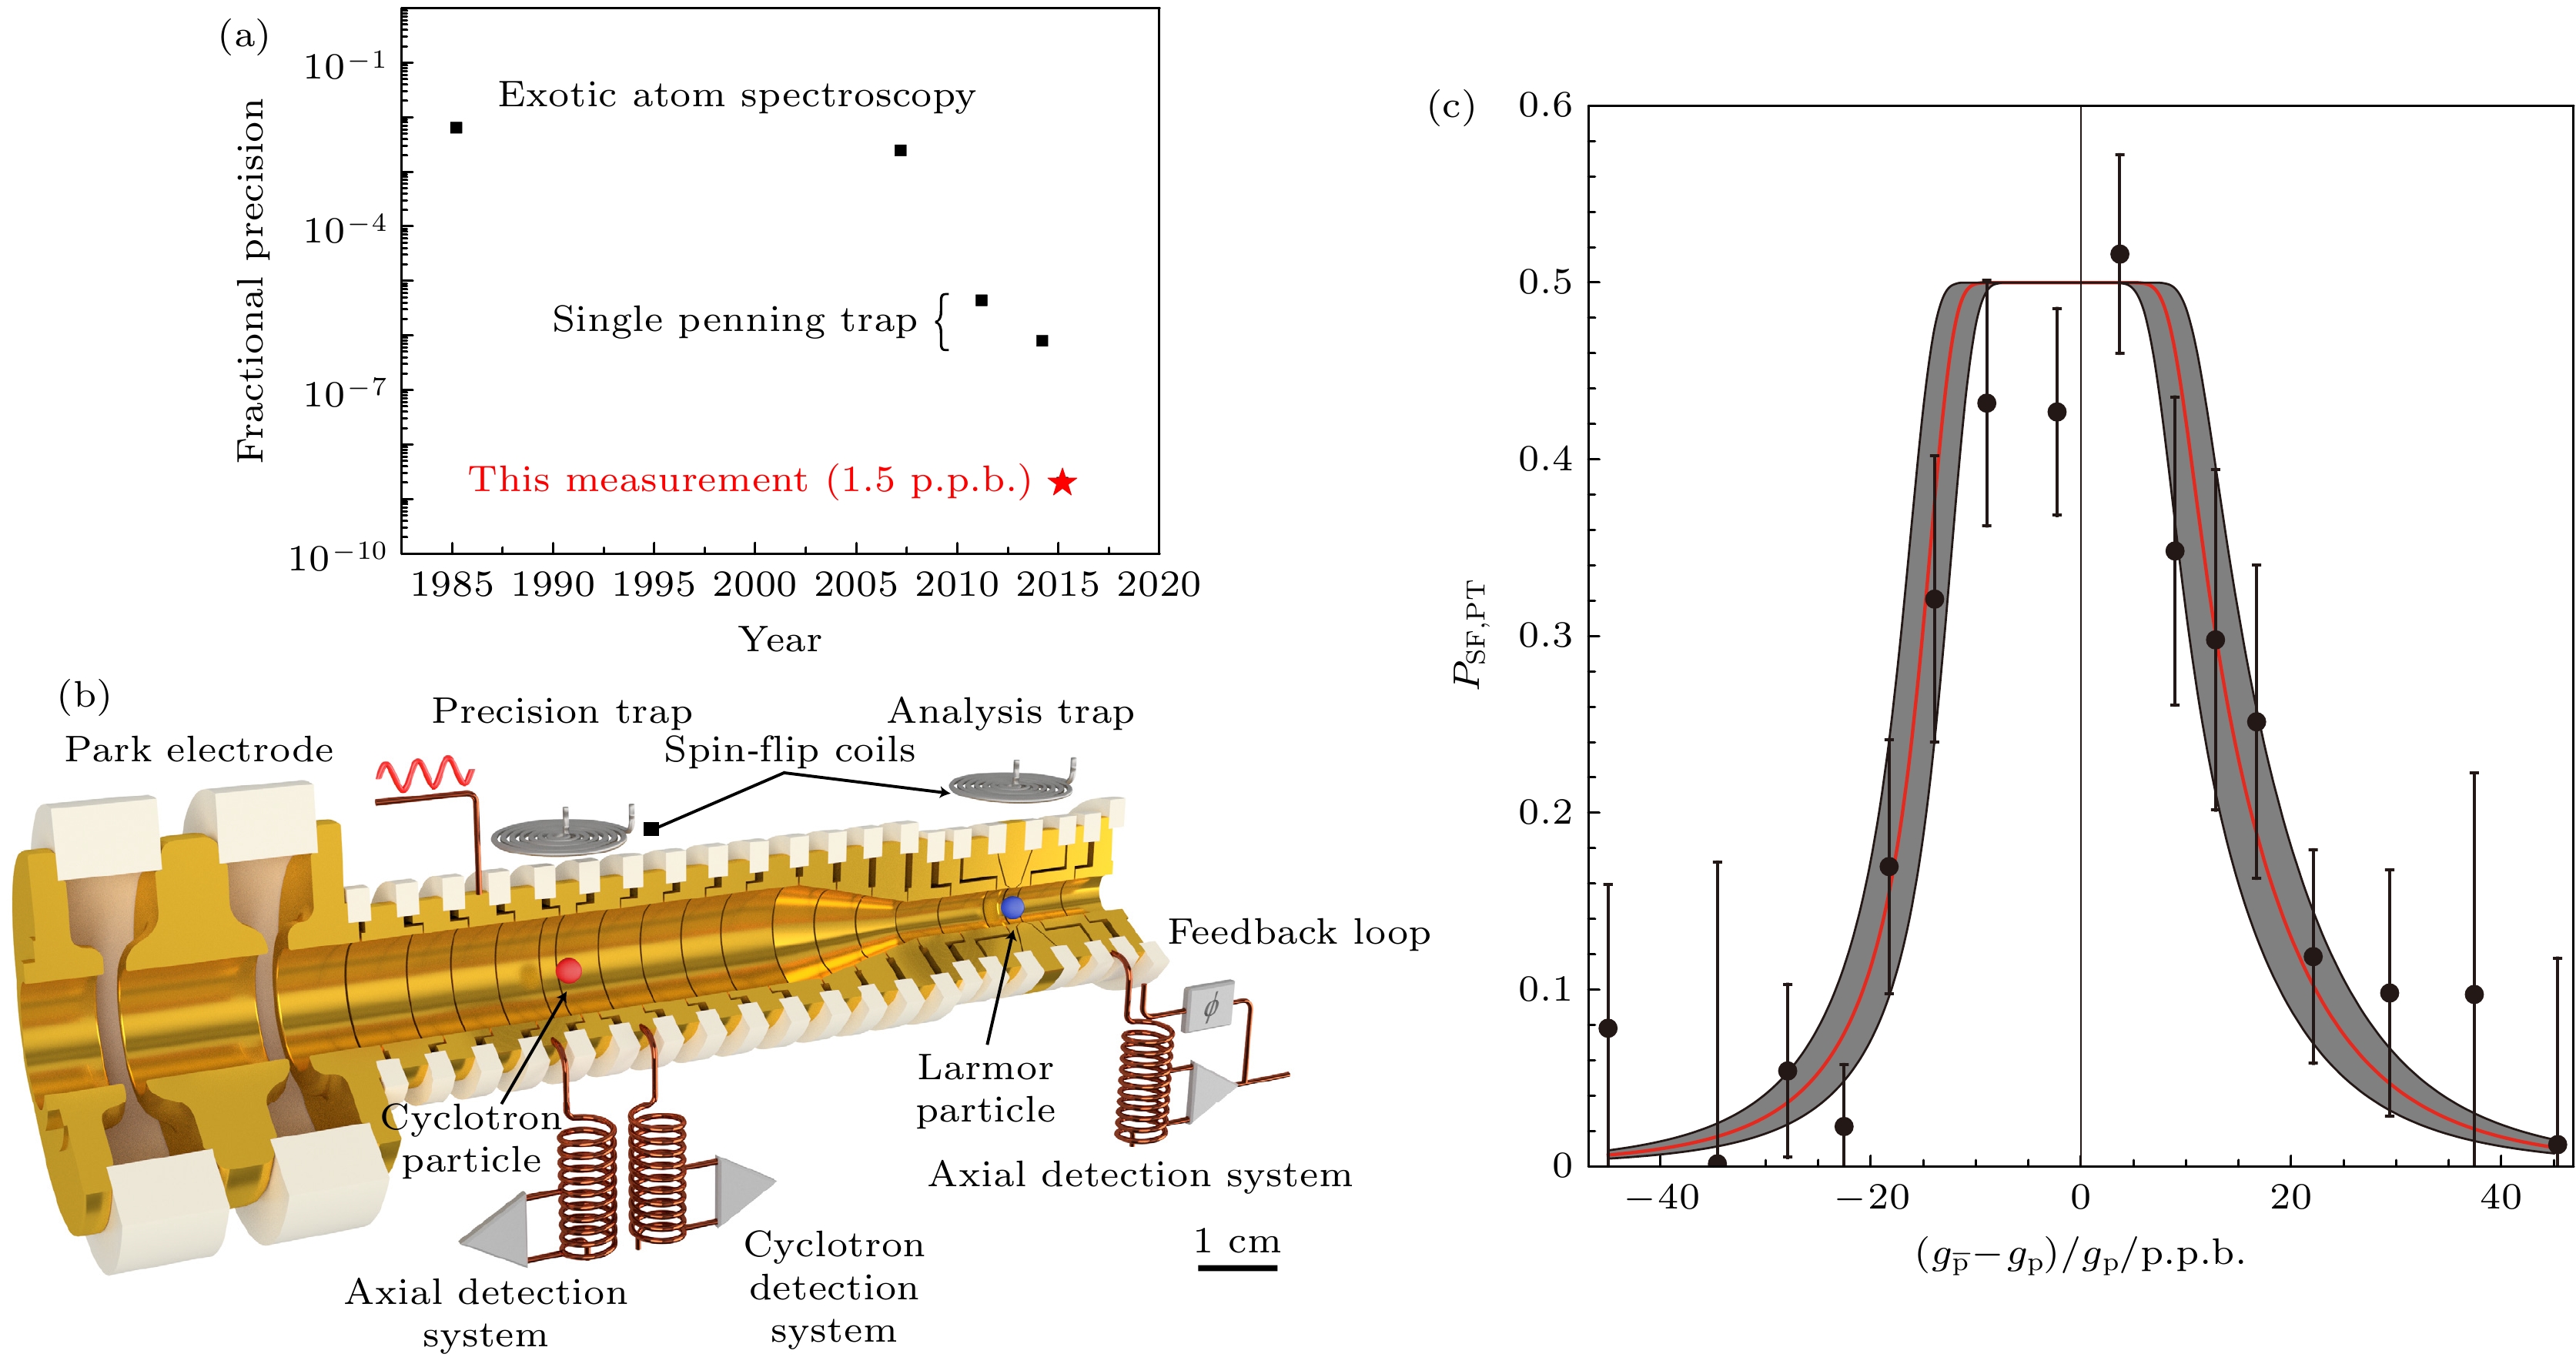
图 17 (a)反质子磁矩测量的历史概述[96]; (b)实验中使用的潘宁陷阱组件的相关部分[96]. 在精密陷阱的均匀磁场中, 测量回旋粒子的回旋频率, 并诱导拉莫尔粒子的自旋转变. 在分析阱的非均相磁场中, 首先初始化自旋态, 然后在精密阱中每次尝试自旋翻转后进行分析. (c)自旋翻转概率[96]. 红线是直接似然估计$ g_{\mathrm{p}} $和$ \varOmega_{\mathrm{R}} $的结果. 灰色区域表示68%的误差带. 黑色数据点为$ P_{{\mathrm{SF}}} $ (Γ) 测量值的分档平均值, 误差带为1σ
Figure 17. (a) A historical overview of the measurement of the magnetic moment of antiprotons[96]. (b) Relevant components of the Penning trap used in the experiment[96]. In the uniform magnetic field of the precision trap, the cyclotron frequency of the particles is measured, and the spin transitions of the Larmor particles are induced. In the inhomogeneous magnetic field of the analysis trap, the spin state is first initialized, and then analyzed after each attempt to flip the spin in the precision trap. (c) Spin flip probability[96]. The red line represents the results of the direct likelihood estimation of $ g_{\mathrm{p}} $ and $ \varOmega_{\mathrm{R}} $. The gray area indicates the 68% error band. The black data points represent the binned average values of $ P_{{\mathrm{SF}}} $ (Γ) measurements, with the error band corresponding to 1σ.
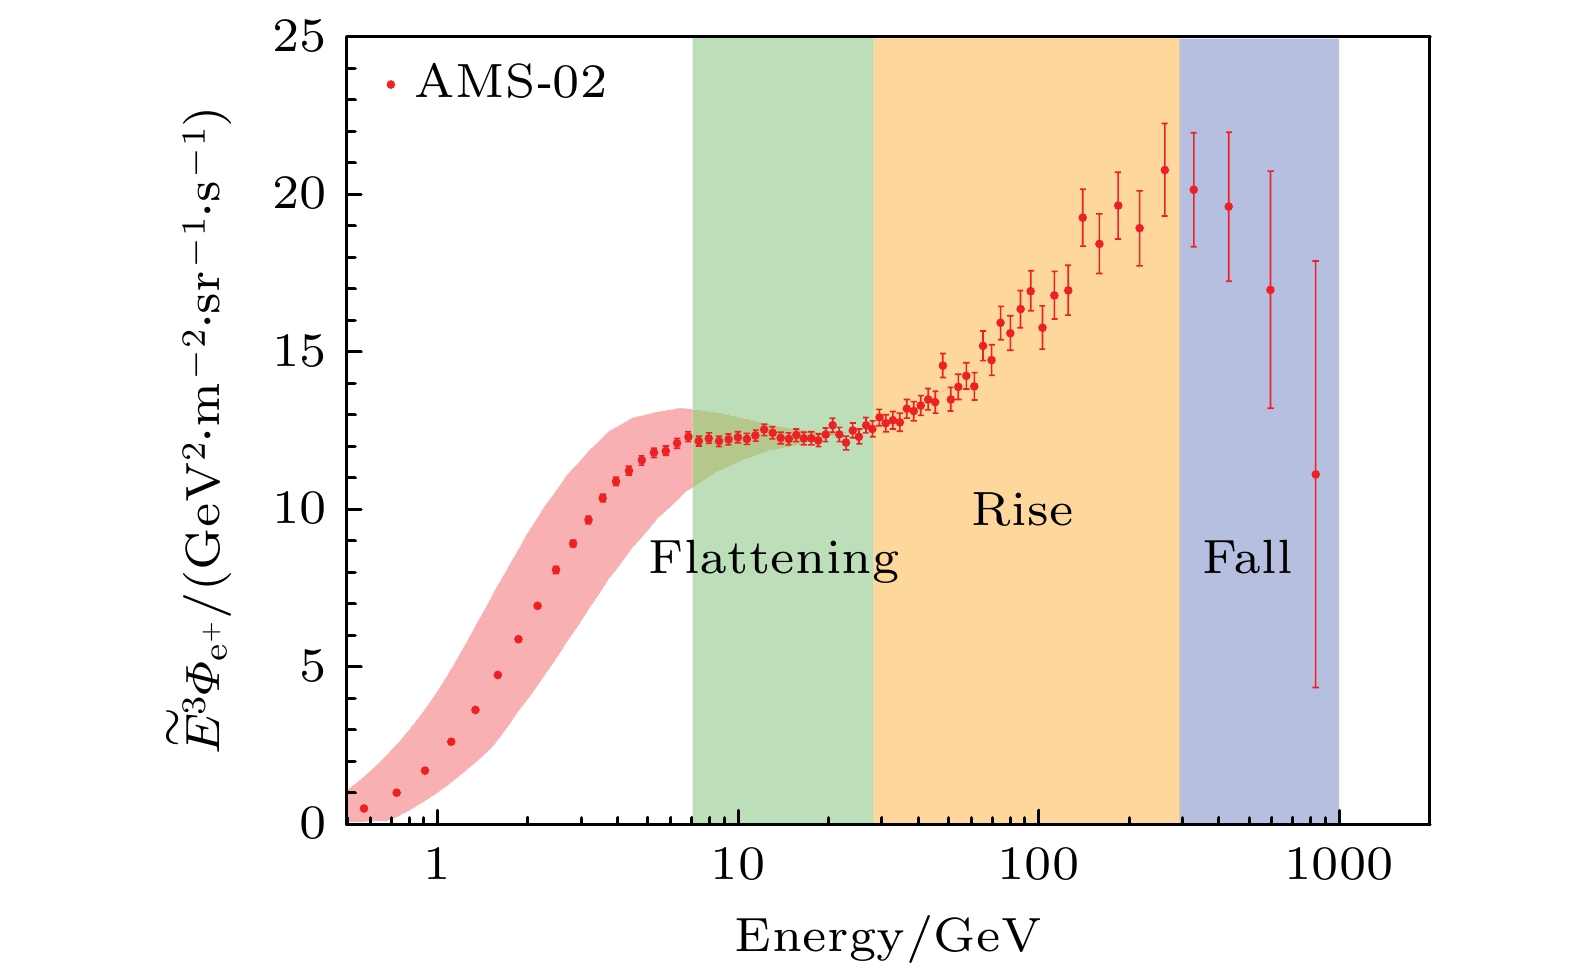
图 18 正电子通量$ \varPsi_{{\mathrm{e}}^+} $以$ E^3 $的比例表示, 导出的AMS正电子谱$ E^3 \varPsi_{{\mathrm{e}}^+} $(红色数据点)与能量E的关系[103]. 由于太阳调制[104], 低能量时的通量随时间的变化用红色条带表示. 为了引导视线, 垂直色带表示与光谱变化行为相对应的能量范围: 平坦、上升和下降光谱
Figure 18. Positron flux $ \varPsi_{{\mathrm{e}}^+} $ is expressed as a function of $ E^3 $[103]. Derived AMS positron spectrum $ E^3 \varPsi_{{\mathrm{e}}^+} $ (red data points) is plotted against energy E. Due to solar modulation[104], the flux at low energies varies over time, indicated by the red bands. To guide the eye, the vertical colored bands represent the energy ranges corresponding to the spectral behavior: flat, rising, and declining spectra.
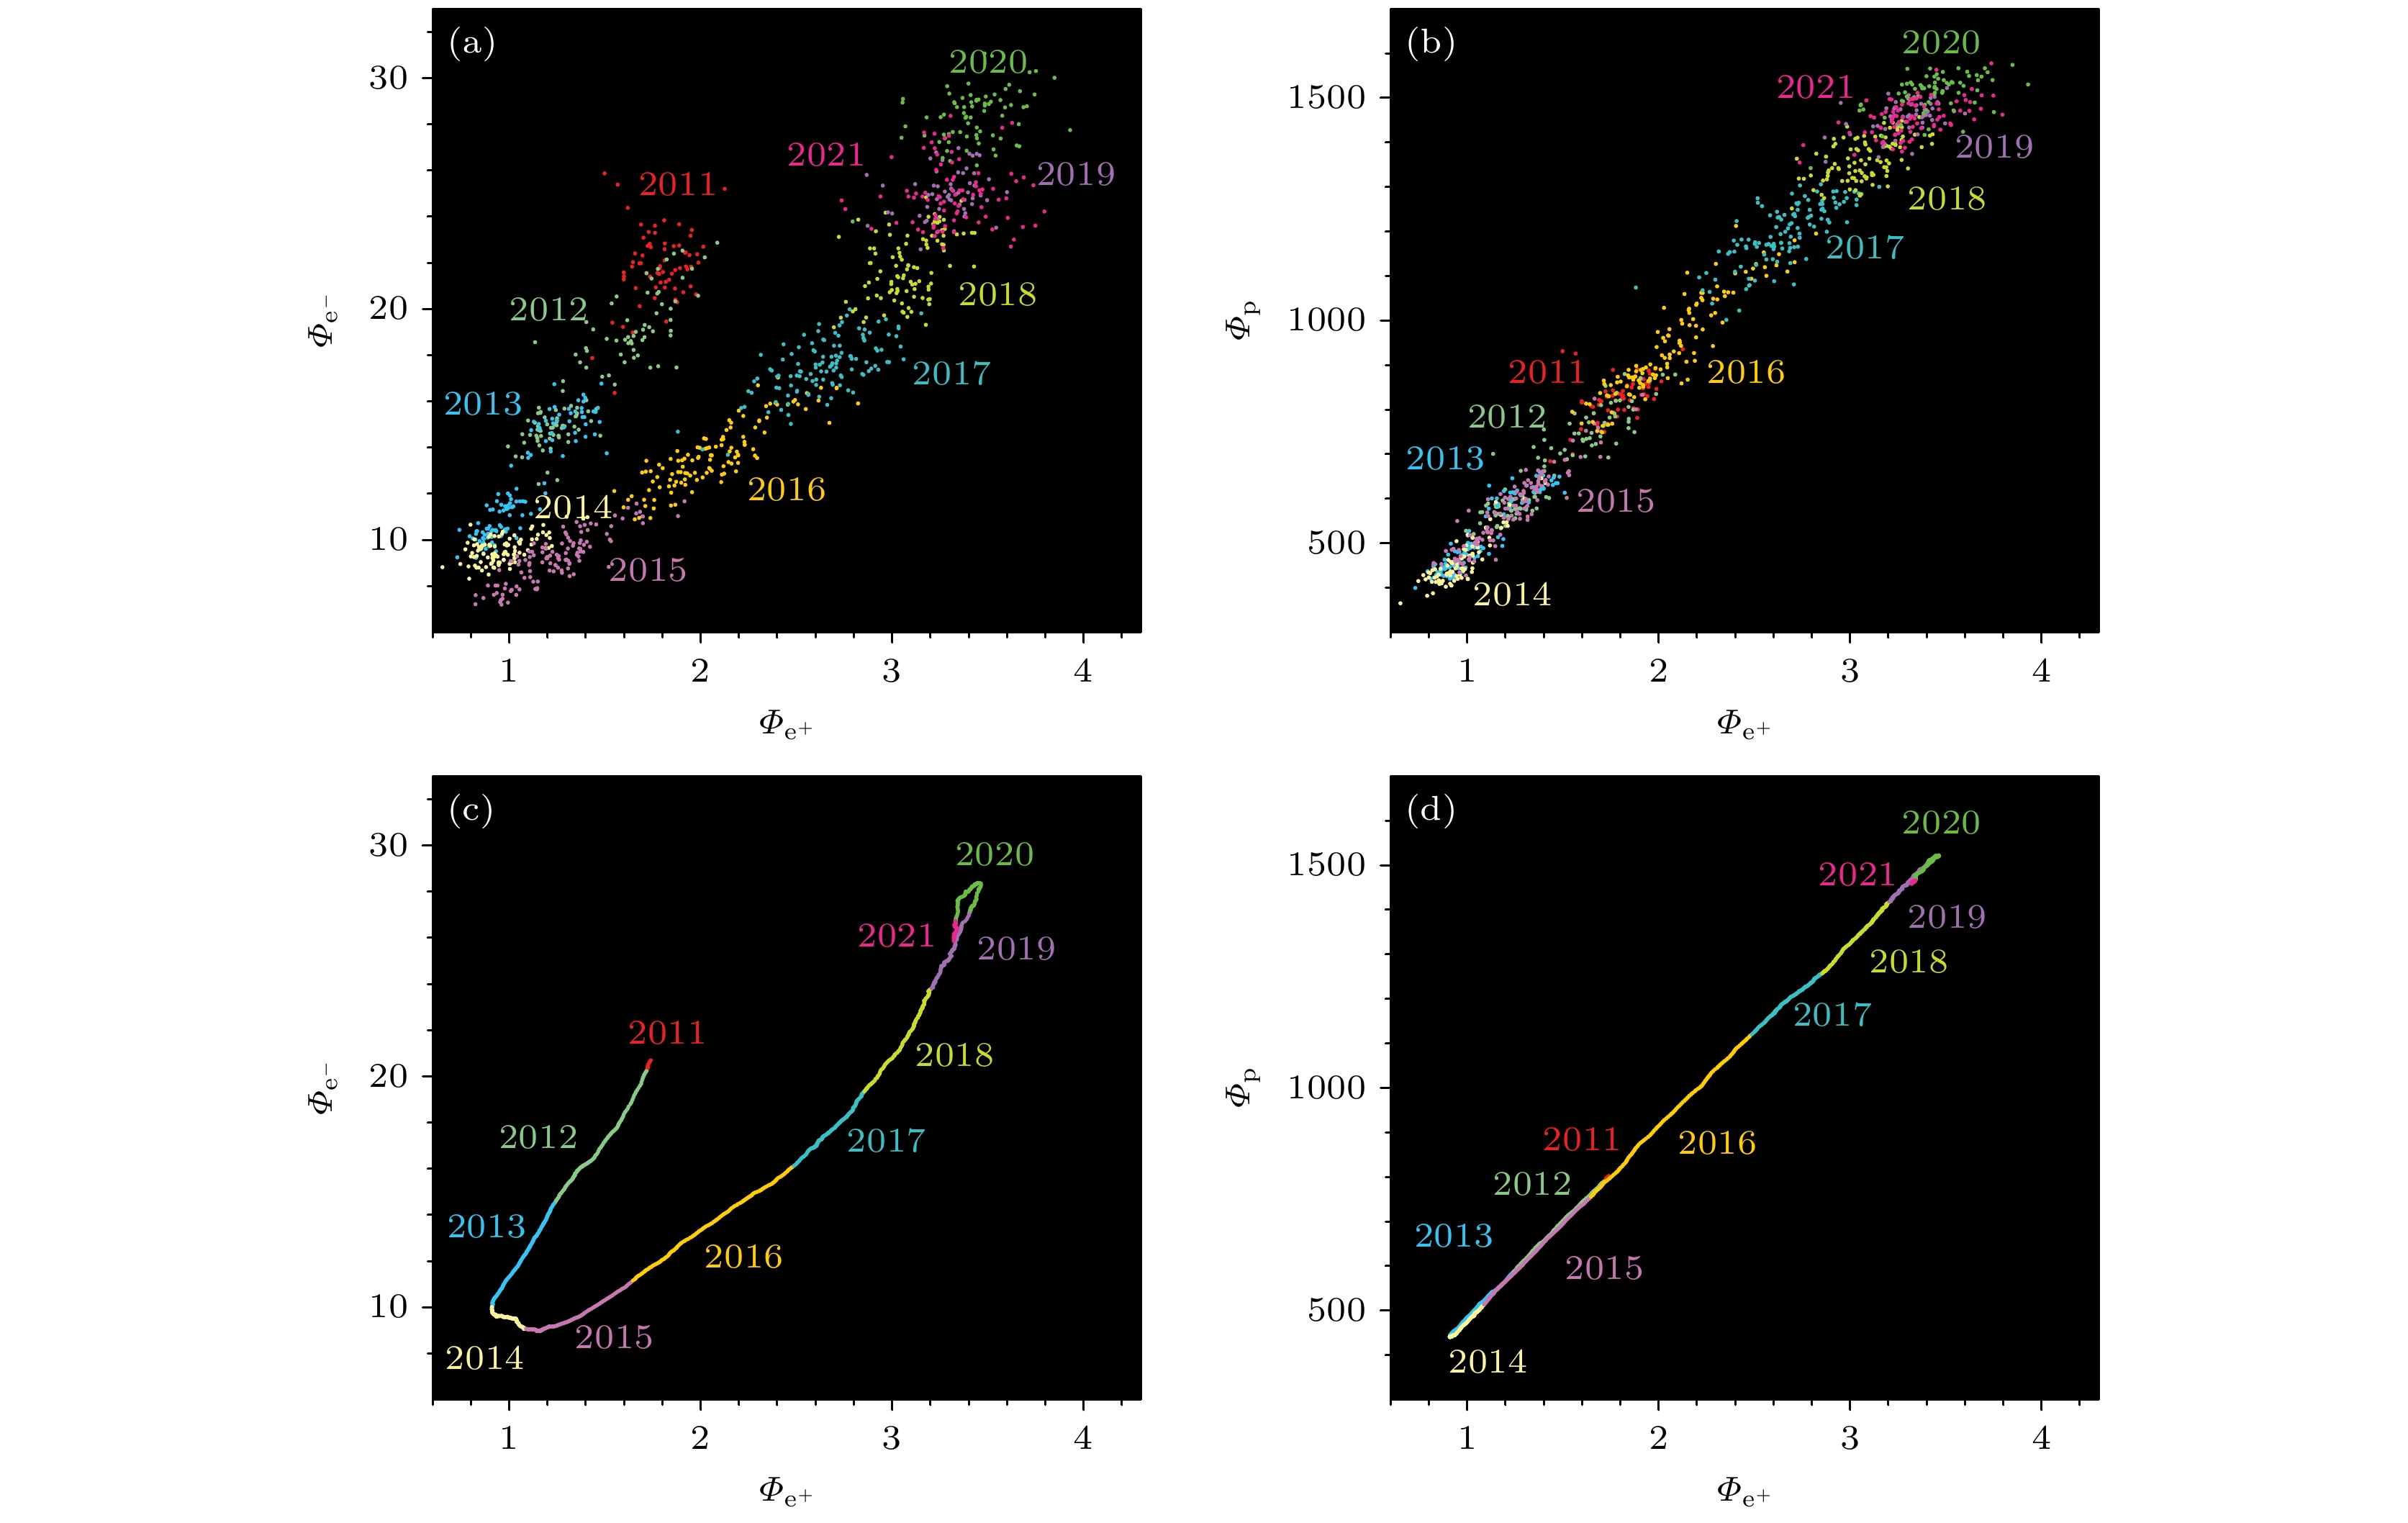
图 19 在1.00—1.71 GV的磁刚度范围内, (a), (c)电子通量$ \varPsi_{{\mathrm{e}}^-} $与正电子通量$ \varPsi_{{\mathrm{e}}^+} $的关系, (b), (d)质子通量$ \varPsi_{{\mathrm{p}}} $与正电子通量$ \varPsi_{{\mathrm{e}}^+} $的关系. (a), (b)中的数据点对应于3天的平均通量[106]. 对于图(c), (d), $ \varPsi_{{\mathrm{e}}^-} $、$ \varPsi_{{\mathrm{p}}} $和$ \varPsi_{{\mathrm{e}}^+} $是以14 BRs的移动平均值和3天的步长计算的. 通量单位为[$ {\mathrm{m^{-2}{\cdot} sr^{-1}{\cdot} s^{-1}{\cdot} GV}}^{-1} $]. 不同颜色表示不同年份
Figure 19. In the magnetic rigidity range from 1.00 to 1.71 GV, (a) and (c) show the relationship between electron flux $ \varPsi_{{\mathrm{e}}^-} $ and positron flux $ \varPsi_{{\mathrm{e}}^+} $, while (b) and (d) depict the relationship between proton flux $ \varPsi_{{\mathrm{p}}} $ and positron flux $ \varPsi_{{\mathrm{e}}^+} $[106]. The data points in panels (a) and (b) correspond to the average flux over 3 days. For (c) and (d), $ \varPsi_{{\mathrm{e}}^-} $, $ \varPsi_{{\mathrm{p}}} $, and $ \varPsi_{{\mathrm{e}}^+} $ are calculated as moving averages over 14 BRs with a 3-day step. The flux units are [$ {\mathrm{m^{-2}{\cdot} sr^{-1} {\cdot} s^{-1}{\cdot} GV}}^{-1} $]. Different colors represent different years.
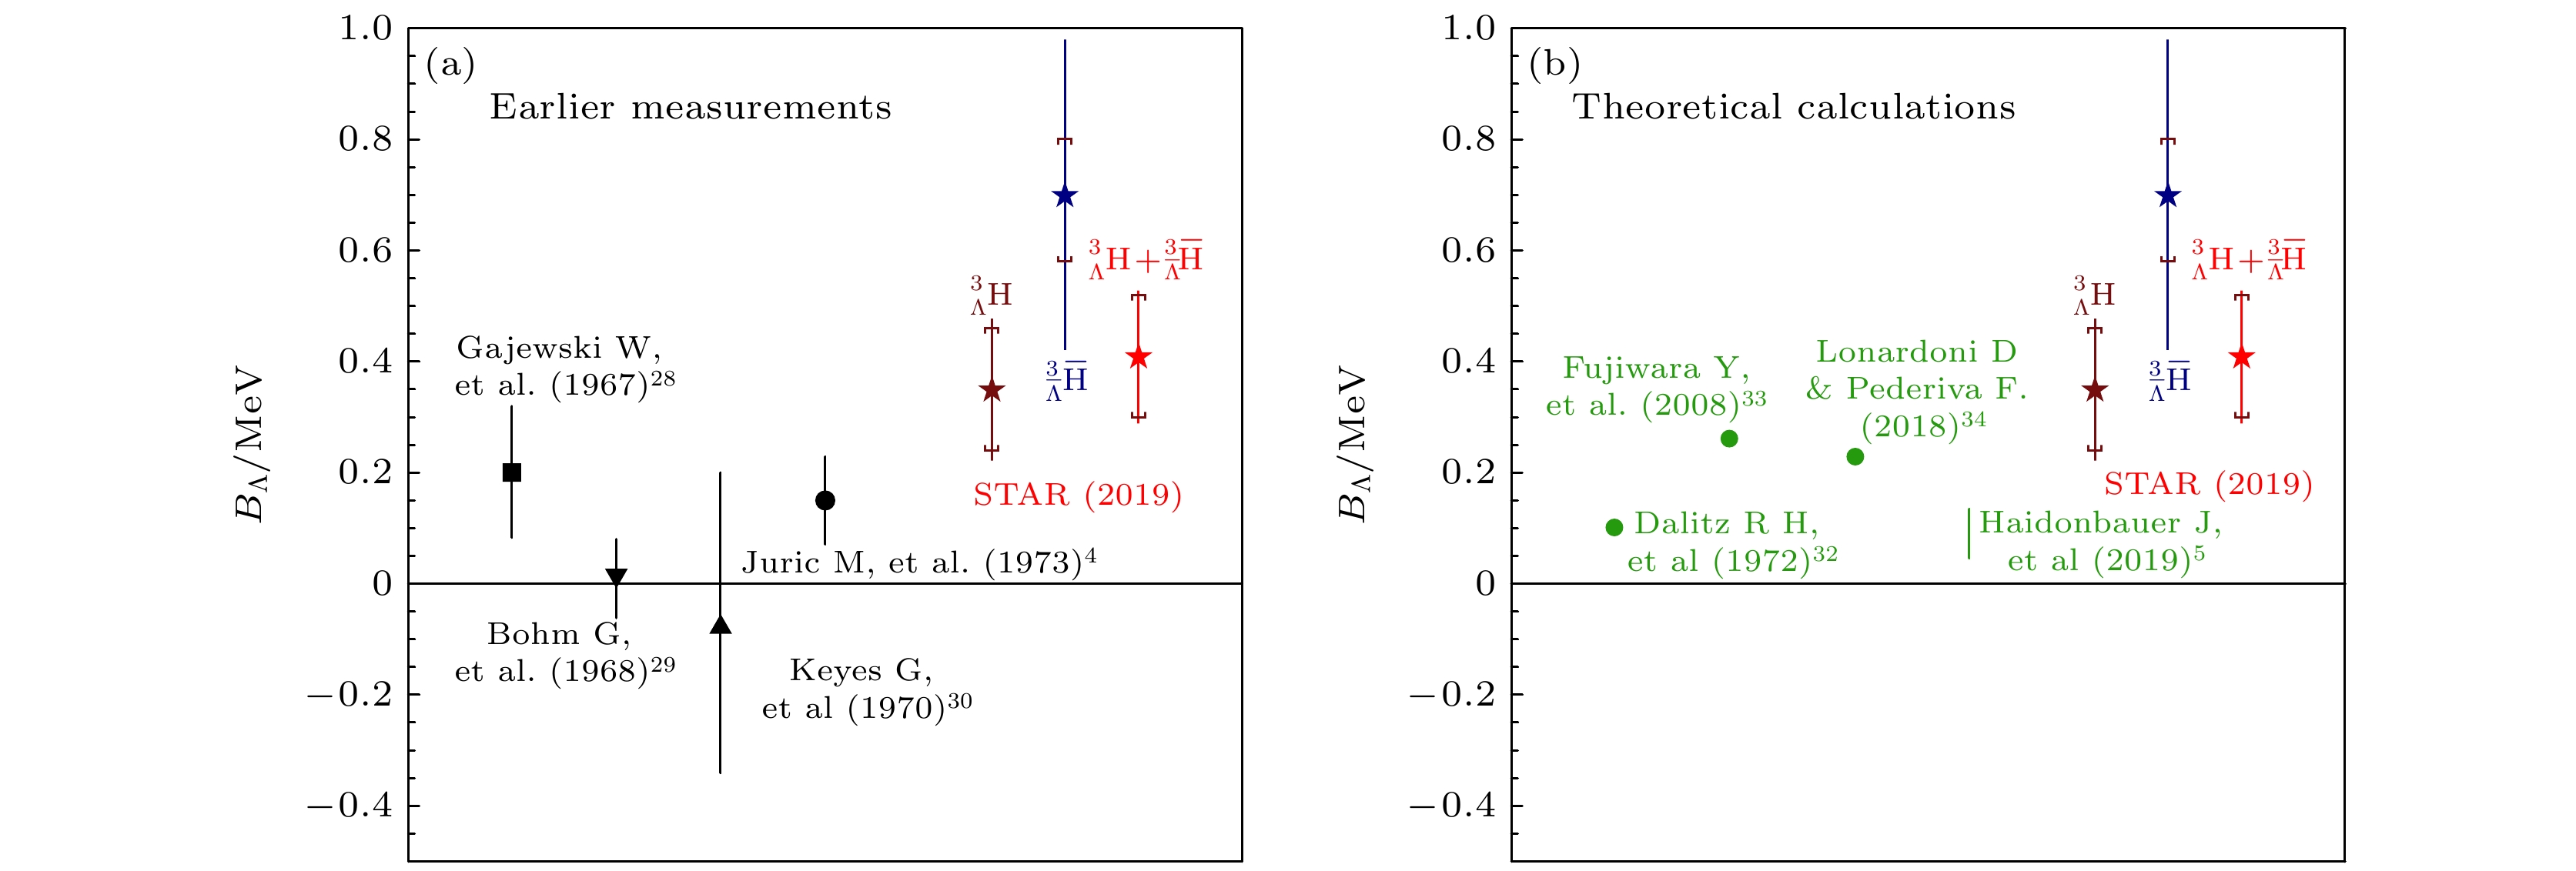
图 8 超氚结合能的(a)实验与(b)理论值. 早期测量的实验结果用黑点及其对应的误差棒表示. STAR超氚与反超氚的合并值是假定了其CPT对称性, 其中垂直的误差棒为标准统计误差, 而帽子表示系统误差. 图(b)的实点和直线表示理论计算结果, 水平线表示束缚能为0的位置
Figure 8. (a) Experimental and (b) theoretical values of the binding energy of hypertriton[52]. The early measurement results are represented by black dots and their corresponding error bars. The combined value of hypertriton and anti-hypertriton from the STAR collaboration assumes the CPT symmetry, where the vertical error bars indicate standard statistical errors, and the caps represent systematic errors. The solid points and lines on the panel (b) represent theoretical calculation results, while the horizontal line indicates the position where the binding energy is zero.
-
[1] Lee T D, Yang C N 1956 Phys. Rev. 104 254
[2] Wu C S, Ambler E, Hayward R W, Hoppes D D, Hudson R P 1957 Phys. Rev. 105 1413
[3] Christenson J H, Fitch V L, Cronin J W, Turlay R 1964 Phys. Rev. Lett. 13 138
 Google Scholar
[4] Schuster A 1898 Nature 1503 367
[5] Dirac P 1928 Proceedings of the Royal Society of London Series A 117 610
[6] Chao C Y 1930 PNAS 16 431
[7] Anderson C D 1932 Phys. Rev. 41 405
 Google Scholar
[8] Chamberlain O, Goldhaber G, Jauneau L, Kalogeropoulos T, Segrè E, Silberberg R 1959 Phys. Rev. 113 1615
 Google Scholar
[9] Dorfan D E, Eades J, Lederman L M, Lee W, Ting C C 1965 Phys. Rev. Lett. 14 1003
 Google Scholar
[10] Antipov Yu M, Denisov S P, Donskov S V, et al. 1971 Nucl. Phys. B 31 235
 Google Scholar
[11] Abelev B, et al. 2010 Science 328 58
 Google Scholar
[12] STAR Collaboration 2011 Nature 473 353
 Google Scholar
[13] STAR Collaboration 2015 Nature 527 345
 Google Scholar
[14] STAR Collaboration 2020 Nat. Phys. 16 409
 Google Scholar
[15] STAR Collaboration 2024 Nature 632 1026
 Google Scholar
[16] Chen J, Keane D, Ma Y G, Tang A, Xu Z 2018 Phys. Rep. 760 1
 Google Scholar
[17] Arsene I, et al. (BRAHMS Collaboration) 2005 Nucl. Phys. A 757 1
 Google Scholar
[18] Back B B, et al. (PHOBOS Collaboration) 2005 Nucl. Phys. A 757 28
 Google Scholar
[19] Adam J, et al. (STAR Collaboration) 2005 Nucl. Phys. A 757 102
 Google Scholar
[20] Adcox K, et al. (PHENIX Collaboration) 2005 Nucl. Phys. A 757 184
 Google Scholar
[21] Arkhipkin D, Lauret J 2017 J. Phys. Conf. Ser. 898 032023
 Google Scholar
[22] Adamczyk L, Adkins J K, Agakishiev G, et al. 2017 Nat. 548 62
 Google Scholar
[23] STAR Collaboration 2023 Nat. 614 244
 Google Scholar
[24] Wang X N 2023 Nucl. Sci. Tech. 34 15
 Google Scholar
[25] Adams J, et al. (STAR Collaboration) 2021 Phys. Rev. Lett. 127 052302
 Google Scholar
[26] 杨帅, 唐泽波, 杨驰, 查王妹 2023 72 211201
 Google Scholar
Yang S, Tang Z B, Yang C, Zha W M 2023 Acta Phys. Sin. 72 211201
 Google Scholar
[27] STAR Collaboration 2023 Sci. Adv. 9 eabq3903
 Google Scholar
[28] Ma Y G 2023 Nucl. Sci. Tech. 34 16
 Google Scholar
[29] Abdallah M S, et al. (STAR Collaboration) 2022 Phys. Rev. C 105 014901
 Google Scholar
[30] 寿齐烨, 赵杰, 徐浩洁, 李威, 王钢, 唐爱洪, 王福强 2023 72 112504
 Google Scholar
Shou Q Y, Zhao J, Xu H J, Li W, Wang G, Tang A H, Wang F Q 2023 Acta Phys. Sin. 72 112504
 Google Scholar
[31] 赵新丽, 马国亮, 马余刚 2023 72 112502
 Google Scholar
Zhao X L, Ma G L, Ma Y G 2023 Acta Phys. Sin. 72 112502
 Google Scholar
[32] Liang Z T, Wang X N 2005 Phys. Rev. Lett. 94 102301
 Google Scholar
[33] Liang Z T, Wang X N 2005 Phys. Lett. B 629 20
 Google Scholar
[34] 高建华, 黄旭光, 梁作堂, 王群, 王新年 2023 72 072501
 Google Scholar
Gao J H, Huang X G, Liang Z T, Wang Q, Wang X N 2023 Acta Phys. Sin. 72 072501
 Google Scholar
[35] 盛欣力, 梁作堂, 王群 2023 72 072502
 Google Scholar
Sheng X L, Liang Z T, Wang Q 2023 Acta Phys. Sin. 72 072502
 Google Scholar
[36] 阮丽娟, 许长补, 杨驰 2023 72 112401
 Google Scholar
Ruan L J, Xu Z B, Yang C 2023 Acta Phys. Sin. 72 112401
 Google Scholar
[37] Chen J H, Keane D, Ma Y G, Oliva L, Sheng X L, Singha S, Sun X, Tang A H, Wang Q, Zhou C S 2024 Nucl. Phys. News 34 17
 Google Scholar
[38] Chen J, Liang Z T, Ma Y G, Wang Q 2023 Sci. Bull. 68 874
 Google Scholar
[39] Lattimer J M, Prakash M 2004 Science 304 536
 Google Scholar
[40] Lea R 2013 Nucl. Phys. A 914 415
 Google Scholar
[41] 马余刚, 陈金辉 2011 科学 63 11
Ma Y G, Chen J H 2011 Science 63 11
[42] 马余刚, 陈金辉 2011 中国基础科学 13 20
 Google Scholar
Ma Y G, Chen J H 2011 Chin. Bas. Sci. 13 20
 Google Scholar
[43] Xue L, (for the STAR Collaboration) 2011 Jour. of Phys. G: Nucl. and Part. Phys. 38 124072
 Google Scholar
[44] Ma Y G 2013 J. Phys. Conf. Ser. 420 012036
 Google Scholar
[45] 马余刚 2012 科学发展报告 (北京: 科学出版社) 第108页
Ma Y G 2012 Sci. Dev. Rep. (Beijing: Science Press) p108
[46] Abdallah M, et al. 2022 Phys. Lett. B 834 137449
 Google Scholar
[47] Hanbury Brown R, Twiss R Q 1956 Nature 178 1046
 Google Scholar
[48] Ma Y G, Fang D Q, Sun X Y, et al. 2015 Phys. Lett. B 743 306
 Google Scholar
[49] Zhang Z Q, Ma Y G 2016 Nucl. Sci. Tech. 27 152
 Google Scholar
[50] 马余刚, 张正桥 2016 科学 68 10
Ma Y G, Zhang Z Q 2016 Science 68 10
[51] Liu P 2019 Nucl. Phys. A 982 811
 Google Scholar
[52] ALICE Collaboration 2015 Nat. Phys. 11 811
 Google Scholar
[53] Ma Y G 2023 Nucl. Sci. Tech. 34 97
 Google Scholar
[54] Chen J H, Dong X, Ma Y G, Xu Z 2023 Sci. Bull. 68 3252
 Google Scholar
[55] Liu D N, Ko C M, Ma Y G, Mazzaschi F, Puccio M, Shou Q Y, Sun K J, Wang Y Z 2024 Phys. Lett. B 855 138855
 Google Scholar
[56] Acharya S, et al. 2023 Nat. Phys. 19 61
 Google Scholar
[57] Zhu L L, Wang B, Wang M, Zheng H 2022 Nucl. Sci. Tech. 33 245
 Google Scholar
[58] Lan S W, Shi S S 2022 Nucl. Sci. Tech. 33 21
 Google Scholar
[59] 孙旭, 周晨升, 陈金辉, 陈震宇, 马余刚, 唐爱洪, 徐庆华 2023 72 072401
 Google Scholar
Sun X, Zhou C S, Chen J H, Chen Z Y, Ma Y G, Tang A H, Xu Q H 2023 Acta Phys. Sin. 72 072401
 Google Scholar
[60] Ko C M 2023 Nucl. Sci. Tech. 34 80
 Google Scholar
[61] 孙开佳, 陈列文, 柯治明, 李峰, 徐骏, 许长补 2023 核技术 46 040012
 Google Scholar
Sun K J, Chen L W, Ko C M, Li F, Xu Z B 2023 Nucl. Tech. 46 040012
 Google Scholar
[62] Andronic A, Braun-Munzinger P, Redlich K, Stachel H 2018 Nat. 561 321
 Google Scholar
[63] 张宇, 张定伟, 罗晓峰 2023 核技术 46 040001
 Google Scholar
Zhang Y, Zhang D, Luo X 2023 Nucl. Tech. 46 040001
 Google Scholar
[64] 姜寅, 廖劲峰 2023 核技术 46 040011
 Google Scholar
Jiang Y, Liao J F 2023 Nucl. Tech. 46 040011
 Google Scholar
[65] 陈倩, 马国亮, 陈金辉 2023 核技术 46 040013
 Google Scholar
Chen Q, Ma G L, Chen J H 2023 Nucl. Tech. 46 040013
 Google Scholar
[66] 李甫鹏, 庞龙刚, 王新年 2023 核技术 46 040014
 Google Scholar
Li F P, Pang L G, Wang X N 2023 Nucl. Tech. 46 040014
 Google Scholar
[67] He W B, Ma Y G, Pang L G, Song H C, Zhou K 2023 Nucl. Sci. Tech. 34 88
 Google Scholar
[68] Ma Y G, Pang L G, Wang R, Zhou K 2023 Chin. Phys. Lett. 40 122101
 Google Scholar
[69] Zhao J, Chen J H, Huang X G, Ma Y G 2024 Nucl. Sci. Tech. 35 20
 Google Scholar
[70] Pang L G, Wang X N 2023 Nucl. Sci. Tech. 34 194
 Google Scholar
[71] Wu W H, Tao J Q, Zheng H, Zhang W C, Liu X Q, Zhu L L, Bonasera A 2023 Nucl. Sci. Tech. 34 151
 Google Scholar
[72] Andronic A, Braun-Munzinger P, Stachel J, Stocker H 2011 Phys. Lett. B 697 203
 Google Scholar
[73] Hirenzaki S, Suzuki T, Tanihata I 1993 Phys. Rev. C 48 2403
 Google Scholar
[74] Cho S, et al. 2017 Prog. Part. Nucl. Phys. 95 279
 Google Scholar
[75] Shao T, Chen J, Ma Y G, Xu Z 2022 Phys. Rev. C 105 065801
 Google Scholar
[76] Shah N, Ma Y G, Chen J H, Zhang S 2016 Phys. Lett. B 754 6
 Google Scholar
[77] Zhang L, Zhang S, Ma Y G 2022 Euro. Phys. J. C 82 416
 Google Scholar
[78] Wang R, Ma Y G, Chen L W, Ko C M, Sun K J, Zhang Z 2023 Phys. Rev. C 108 L031601
 Google Scholar
[79] Danielewicz P, Bertsch G F 1991 Nucl. Phys. A 533 712
 Google Scholar
[80] Sun K J, Wang R, Ko C M, Ma Y G, Shen C 2024 Nat. Commun. 15 1074
 Google Scholar
[81] Bleicher M 2024 Nucl. Sci. Tech. 35 129
 Google Scholar
[82] Abdulhamid M, et al. (STAR Collaboration) 2023 Phys. Rev. Lett. 130 202301
 Google Scholar
[83] Andresen G B, Ashkezari M, Baquero-Ruiz M, et al. 2010 Nature 468 673
 Google Scholar
[84] Amoretti M, Amsler C, Bonomi G, et al. 2002 Nature 419 456
 Google Scholar
[85] ALPHA Collaboration 2011 Nat. Phys. 7 558
 Google Scholar
[86] Amole C, Ashkezari M, Baquero-Ruiz M, et al 2014 Nat. Commun. 5 3955
 Google Scholar
[87] Ahmadi M, Baquero-Ruiz M, Bertsche W, et al. 2016 Nature 529 373
 Google Scholar
[88] Ulmer S, et al. 2015 Nature. 524 196
 Google Scholar
[89] Borchert M J, Devlin J A, Erlewein S R, et al. 2021 Nature 601 53
 Google Scholar
[90] Ahmadi M, Alves B, Baker C, et al. 2017 Nature 541 506
 Google Scholar
[91] Ahmadi M, Alves B X R, Baker C J, et al. 2018 Nature 557 71
 Google Scholar
[92] ALPHA Collaboration 2020 Nature 578 375
 Google Scholar
[93] Baker C J, Bertsche W, Capra A, et al. 2020 Nature 592 35
 Google Scholar
[94] Soter A 2023 Nature 621 699
 Google Scholar
[95] Anderson E K, Baker C J, Bertsche W, et al. 2023 Nature 621 716
 Google Scholar
[96] Smorra C, Sellner S, Borchert M, et al. 2017 Nature 550 371
 Google Scholar
[97] Aguilar M, et al. (AMS Collaboration) 2021 Phys. Rep. 894 1
 Google Scholar
[98] Adriani O, Barbarino G C, Bazilevskay G A, et al. 2011 Science 332 69
 Google Scholar
[99] Ajello M, et al. (FERMI-LAT Collaboration) 2022 Science 376 521
 Google Scholar
[100] Abe K, et al. 2012 Phys. Rev. Lett. 108 051102
 Google Scholar
[101] Sakai K, et al. (BESS Collaboration) 2024 Phys. Rev. Lett. 132 131001
 Google Scholar
[102] Aguilar M, et al. (AMS Collaboration) 2019 Phys. Rev. Lett. 122 101101
 Google Scholar
[103] Aguilar M, et al. (AMS Collaboration) 2019 Phys. Rev. Lett. 122 041102
 Google Scholar
[104] Aguilar M, et al. (AMS Collaboration) 2018 Phys. Rev. Lett. 121 051102
 Google Scholar
[105] Aguilar M, et al. (AMS Collaboration) 2023 Phys. Rev. Lett. 130 161001
 Google Scholar
[106] Aguilar M, et al. (AMS Collaboration) 2023 Phys. Rev. Lett. 131 151002
 Google Scholar
Catalog
Metrics
- Abstract views: 12091
- PDF Downloads: 413
- Cited By: 0


 DownLoad:

